Propionate reinforces epithelial identity and reduces aggressiveness of lung carcinoma
- PMID: 37766669
- PMCID: PMC10701619
- DOI: 10.15252/emmm.202317836
Propionate reinforces epithelial identity and reduces aggressiveness of lung carcinoma
Abstract
The epithelial-to-mesenchymal transition (EMT) plays a central role in the development of cancer metastasis and resistance to chemotherapy. However, its pharmacological treatment remains challenging. Here, we used an EMT-focused integrative functional genomic approach and identified an inverse association between short-chain fatty acids (propionate and butanoate) and EMT in non-small cell lung cancer (NSCLC) patients. Remarkably, treatment with propionate in vitro reinforced the epithelial transcriptional program promoting cell-to-cell contact and cell adhesion, while reducing the aggressive and chemo-resistant EMT phenotype in lung cancer cell lines. Propionate treatment also decreased the metastatic potential and limited lymph node spread in both nude mice and a genetic NSCLC mouse model. Further analysis revealed that chromatin remodeling through H3K27 acetylation (mediated by p300) is the mechanism underlying the shift toward an epithelial state upon propionate treatment. The results suggest that propionate administration has therapeutic potential in reducing NSCLC aggressiveness and warrants further clinical testing.
Keywords: H3K27 acetylation; epithelial-mesenchymal transition; metabolic inhibitor; metastasis; propionate.
© 2023 The Authors. Published under the terms of the CC BY 4.0 license.
Conflict of interest statement
The authors declare that they have no conflict of interest.
Figures
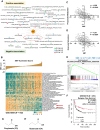
- A
Network visualization of positively and negatively associated metabolic processes with EMT inferred from the meta‐correlation analysis of the activation scores of the gene‐sets in lung cancer gene expression profiles (N = 1,476) from six datasets. meta‐r < −0.3 and meta‐r > 0.3; meta‐P < 0.05.
- B
Representative heatmap visualization of significant positively and negatively associated metabolic processes activation with the increasing activation levels of EMT gene signature as a bar plot in GSE72094 (N = 442) above heatmap. Red arrows indicate propionate and butanoate metabolisms negatively associated with EMT activation.
- C, D
Correlation plot between the metabolic process activation scores of short‐chain fatty acids (propionate (C) or butanoate (D)) with EMT gene signature activation in GSE72094 profile (N = 442).
- E
Gene set enrichment analysis of hallmark EMT gene‐set with the lung cancer patient samples (GSE72094; N = 442) categorized as low and high based on the propionate gene‐set activation levels showed EMT enrichment in low propionate patient samples. Ranking of genes with signal2noise metric was used for GSEA.
- F
Relapse free survival analysis in lung cancer patient samples (GSE30219; N = 293) categorized as low‐ and high‐propionate levels based on the median showed good prognosis for propionate gene‐set. HR – Hazard ratio for high propionate group was calculated using Cox proportional hazards model. P‐value was calculated using log‐rank method.
- G, H
Structure of short‐chain fatty acids, propionate (G) and butanoate (H).

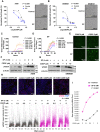
- A–C
Western blot analysis of E‐cadherin and ZEB1 protein levels in A549 cells treated with sodium acetate (SA) (A), sodium propionate (SP) (B) or sodium butanoate (SB) (C) in the indicated dose‐ and time‐dependent manner. β‐Actin was used as an internal control. Numbers indicate the fold change compared to the control of the respective time points.
- D, E
Western blot analysis of E‐cadherin and ZEB1 in NSCLC cell lines SKMES1 (D) and NCI‐H520 (E) treated with sodium propionate (SP) in the indicated dose and time points. β‐Actin was used as an internal control.
- F
Immunofluorescence staining of E‐cadherin in NSCLC cell lines, A549 and SKMES1, treated with sodium propionate (5 mM) for 3 days. DAPI was used as a nuclear stain. Scale bars: 10 μm.
- G
Flow cytometry analysis of membrane‐associated PE‐conjugated E‐cadherin in A549 cells treated with sodium propionate (SP) at 5 mM concentration for 48 h. PE‐conjugated IgG1 was used as a control for flow cytometry.
- H
Western blot analysis of E‐cadherin and ZEB1 protein levels in A549 cells pre‐treated with sodium propionate (SP) for 48 h followed by TGF‐β1 for 24 h. β‐Actin was used as an internal control.
- I
Western blot analysis of E‐cadherin and ZEB1 protein levels in A549 cells co‐treated with sodium propionate (SP) or sodium butanoate (SB) in combination with TGF‐β1 for 72 h. β‐Actin was used as an internal control.
- J
Line plot depicts the rate of wound healing, expressed as relative wound density in A549 cells treated with sodium propionate (SP) (n = 10) over the course of 72 h from making the wound for migration assay.
- K
Line plot depicts the rate of wound healing, expressed as relative wound density in A549 cells treated with sodium propionate (SP, 5 mM) for 48 h followed by TGF‐β1 (2 ng/ml) for 24 h from making the wound for migration assay. P‐value was calculated from two‐way ANOVA followed by Tukey's multiple comparison test.
- L
Cell adhesion assay in A549 cells treated with sodium propionate (5 mM) for 72 h. Data points (n = 8) are represented as mean ± SD and P‐value was calculated from t‐test.

- A
Western blot analysis of E‐cadherin and ZEB1 in A549 cell line treated with indicated equimolar concentration of sodium chloride (SC) or sodium propionate (SP) in a time‐dependent manner. β‐Actin was used as an internal control.
- B
Western blot analysis of E‐cadherin and ZEB1 in SKMES1 cells treated with sodium butanoate (SB) in the indicated dose‐ and time‐dependent manner. β‐Actin was used as an internal control. The experiment was performed three independent times.
- C
Western blot analysis of E‐cadherin and ZEB1 in NCI‐H23 cell line treated with 1 mM of sodium propionate for 72 h. β‐Actin was used as an internal control. The experiment was performed three independent times.
- D, E
Western blot analysis of E‐cadherin and ZEB1 in CALU‐1 (D) and in H1299 (E) cell lines treated with sodium propionate (SP) or sodium butanoate (SB) in the indicated dose‐dependent manner for 48 h. β‐Actin was used as an internal control. The experiment was performed three independent times.
- F
Flow cytometry analysis of membrane‐associated E‐cadherin (PE‐conjugated E‐cadherin) in A549 cells treated with sodium propionate at 5 mM concentration for 48 h. Mean fluorescence intensity of PE‐E‐cadherin in SP treated cells and controls were 62,858 and 21,999, respectively. PE‐conjugated IgG1 was used as a control for flow cytometry. The experiment was performed three independent times.
- G
Real‐time quantitative PCR analysis of epithelial genes CDH1 in A549 cell line treated with sodium propionate (SP) at 5 mM for 3 days. GAPDH was used as an internal control. Red dotted line represents the fold change cut‐off at 1.5. Data points (n = 3) are technical replicates represented as mean ± SD of one experiment, and the experiment was performed three independent times. Significance was calculated using unpaired t‐test.
- H
Detection of intracellular levels of propionate in A549 cell line treated with SP (5 mM) for 3 days (n = 3). 13C propionate was used as an internal standard. Data is represented as mean ± SD of technical replicates and significance was calculated using unpaired t‐test.
- I, J
Western blot analysis of E‐cadherin and ZEB1 in A549 cells treated with TGF‐β1 (2 ng/ml) for 48 h followed by treatment with 5 mM SP (I) or 1 mM SB (J) for 24 h. β‐Actin was used as an internal control. The experiments were repeated three independent times.
- K
Western blot analysis of E‐cadherin, ZEB1 and NNMT protein levels in A549 cells pre‐treated with sodium propionate (SP, 5 mM) or sodium butanoate (SB, 1 mM) for 48 h followed by TGF‐β1 (2 ng/ml) for 24 h. β‐Actin was used as an internal control. The experiment was performed three independent times.
- L
Western blot analysis of E‐cadherin, ZEB1 and NNMT protein levels in A549 cells co‐treated with sodium propionate (SP, 5 mM) or sodium butanoate (SB, 1 mM) in combination with TGF‐β1 (2 ng/ml) for 72 h. β‐Actin was used as an internal control. The experiment was performed three independent times.
- M
Line Plot depicts the quantification of spheroid brightfield area of A549 spheroids treated with sodium propionate (SP, 5 mM) and TGF‐β1 (2 ng/ml). Data points (n = 4) are technical replicates represented as mean ± SD and the experiment was performed three independent times. P‐value was calculated from two‐way ANOVA followed by multiple comparison between conditions using Tukey's multiple comparison test.

- A
Real‐time cell proliferation analysis of A549 cells treated with sodium propionate (5 mM) for 12 days. Data points (n = 3) are technical replicates represented as mean ± SD of one experiment and the experiment was performed at least three independent times. P‐value was calculated from two‐way ANOVA.
- B, C
In vivo imaging of lung colonization ability of A549‐pFUL2G cells treated in vitro with sodium propionate (5 mM) for 3 days followed by tail‐vein injection in NSG mice (B). Quantification of luciferase activity as bioluminescence signal (total flux) in the lung metastatic NSG mice injected with A549‐pFUL2G cells treated in vitro with sodium propionate (5 mM) for 3 days (C). Data (n = 11 in control and n = 13 in SP) are represented as mean ± SEM with significance calculated using un‐paired two tailed t‐test.
- D
Real‐time cell proliferation analysis of SKMES1 cells treated with sodium propionate (5 mM) for 12 days. Data points (n = 3) are technical replicates represented as mean ± SD of one experiment and the experiment was performed three independent times. P‐value was calculated from two‐way ANOVA.
- E, F
In vivo imaging of lung colonization ability of SKMES1‐pFUL2G cells treated in vitro with sodium propionate (5 mM) for 3 days followed by tail‐vein injection in NSG mice (E). Quantification of luciferase activity as bioluminescence signal (total flux) in the lung metastatic NSG mice injected with SKMES1‐pFUL2G cells treated in vitro with sodium propionate (5 mM) for 3 days (F). Data (n = 11 in control and n = 10 in SP) are represented as mean ± SEM with significance calculated using un‐paired two tailed t‐test.
- G
Schematic representation of analysis of survival probability and lymph node metastatic inhibitory activity of sodium propionate by administering in drinking water to AAV‐KPL virus lung intubated Cas9‐C57BL/6 mice.
- H
Survival analysis of Cas9‐C57BL/6 mice with lung tumorigenesis intubated with AAV‐KPL virus and administered with sodium propionate (SP) in drinking water (n = 7 per group). HR – Hazard ratio for SP was calculated using Mantel–Haenszel method. Significance was calculated using log‐rank method.
- I
Representative images of lung cancer metastasis to axial lymph nodes in KPL mice of control (LN‐Control) condition while no metastasis in the sodium propionate (LN‐SP) condition. Scale bar: 200 μm. Red arrows point to the metastatic cells in the lymph nodes.
- J
Pie chart representation of percent lung cancer metastasis to axial lymph nodes (n = 10 per group) in AAV‐KPL virus lung intubated Cas9‐C57BL/6 mice administered with sodium propionate (SP) in drinking water.
- K
Western blot analysis of E‐cadherin and Zeb1 levels in KPL cell line derived from Cas9‐C57BL/6 mice with lung tumorigenesis intubated with AAV‐KPL virus. β‐Actin was used as an internal control. The experiment was performed three independent times.
- A
Dose responsive curve of cisplatin (CDDP) treatment in combination with SP (5 mM) in A549 cell line with pre‐treatment condition for 48 h. Data points (n = 3) are technical replicates represented as mean ± SD normalized to control of one experiment and the experiment was performed three independent times. P‐value was calculated from two‐way ANOVA analysis. In the right, images represent growth inhibition of A549 cell line pre‐treated with SP for 48 h followed by cisplatin (10 μM). Scale bars: 300 μm.
- B
Dose responsive curve of cisplatin (CDDP) treatment in combination with SP (5 mM) in SKMES1 cell line with pre‐treatment condition for 48 h. Data points (n = 3) are technical replicates represented as mean ± SD normalized to control of one experiment and the experiment was performed three independent times. P‐value was calculated from two‐way ANOVA analysis. In the right, images represent growth inhibition of SKMES1 cell line pre‐treated with SP for 48 h followed by cisplatin (5 μM). Scale bars: 300 μm.
- C–E
Quantification of dead cells (green object count) using Cytotox Green in A549 cells treated with dose‐dependent cisplatin (CDDP) in the absence (C) and presence of SP (D) with pre‐treatment condition for 48 h. Data points (n = 3) are technical replicates represented as mean ± SD of one experiment and the experiment was performed three independent times. P‐value was calculated from two‐way ANOVA analysis. Representative images of A549 cells treated with cisplatin (CDDP, 5 μM) in combination with SP (5 mM). Scale bars: 400 μm (E).
- F, G
Western blot analysis of γH2AX levels in A549 cells (F) and SKMES1 cells (G) treated with cisplatin (CDDP) in the indicated dose‐dependent concentrations along with SP (5 mM). β‐Actin was used as an internal control. The experiment was performed three independent times.
- H
QIBC analysis of γH2AX levels in A549 cells treated in the indicated dose‐dependent concentrations of cisplatin (CDDP) for around 6 h in combination with SP pre‐treatment (5 mM) for 24 h (bottom). Dots represent single cells (n = ~9,000) and significance (P < 0.0001) was calculated using two‐way ANOVA. Top, Images represent the γH2AX levels in A549 cells treated in the presence and absence of cisplatin (5 μM) along with SP pre‐treatment (5 mM) for 24 h. DAPI was used as a nuclei stain. Scale bars: 50 μm.
- I
QIBC analysis of sum intensity levels of γH2AX foci in A549 cells (n = ~9,000 single cells) showing an increasing trend with the treatment of cisplatin (CDDP) in the indicated dose‐dependent concentrations in combination with SP (5 mM) with pre‐treatment condition for 24 h. Significance was calculated using two‐way ANOVA.

- A
Western blot analysis of E‐cadherin and ZEB1 protein expression in time series in A549 cell line treated with sodium propionate (SP) for 12 days. β‐Actin was used as an internal control. The experiment was performed three independent times. Numbers indicate the fold change compared to the control of the respective time points.
- B
Principal component analysis of RNA‐seq expression profile of A549 cell line treated with SP for 3 and 12 days reveals a high variance in the gene expression profiles between the treated and the control samples (n = 3 per group).
- C
Real‐time quantitative PCR analysis of epithelial genes (CDH1, KRT18, KRT19, EPCAM and ICAM1) and mesenchymal gene (ZEB1) in A549 cell line treated with sodium propionate (SP, 5 mM) for 3 days. GAPDH was used as an internal control. Blue and red dotted lines represent the fold change cut‐off at 1.5 and 0.67, respectively. Data points (n = 3) are technical replicates represented as mean ± SD of one experiment, and the experiment was performed three independent times. Significance was calculated using unpaired t‐test.
- D
Gene set enrichment analysis of hallmark apical junction gene‐set enrichment in a lung cancer gene expression profile GSE72094 (N = 442) as continuous label of SP 3 days gene‐set z‐score activity. Ranking of genes was based on Pearson's correlation metric in GSEA.
- E
Immunofluorescence staining of EPCAM and ZO‐1 in A549 cell line treated with sodium propionate (SP, 5 mM) for 3 days. DAPI was used as a nuclear stain. Scale bars: 50 μm.
- F
Western blot analysis of GRHL1 and OVOL2 protein levels in time series in A549 cell line treated with sodium propionate (SP, 5 mM) for 3 days showed an increase in the epithelial‐specific transcription factors expression. β‐Actin was used as an internal control.
- G
Single cell RNA sequencing of parental A549 cell line revealed five different clusters of cells obtained from t‐SNE (t‐distributed stochastic neighbor embedding) analysis with a resolution of 0.4 and perplexity of 50 from first 25 principal components.
- H
Dot plot pattern analysis of epithelial and mesenchymal gene‐sets using AddmoduleScore analysis in Seurat showed the enrichment of SP up‐regulated genes along with the epithelial gene‐sets in cluster 3 of parental A549 cells from scRNA sequencing.
- I
Gene set enrichment analysis of SP 3 days down‐regulated gene‐set in TGFβ1‐induced HMLE cell line compared to the control obtained from GSE24202 (n = 3). Ranking of genes with signal2noise metric was used for GSEA.
- J, K
Box plot visualization of the enriched airway epithelial cell‐type associated gene‐set (J) and cancer stem cell marker, ALDH1A1 (K) in SP 3 days and SP 12 days samples compared to the control. The central band inside the box represents the median value of the data (n = 3) obtained using the lower (bottom) and upper (top) quartile values of the box. The maximum and minimum values of the data are displayed with vertical lines (whiskers) connecting the box. Significance was calculated using un‐paired t‐test between the SP treated cells and the control.

- A, B
Real‐time quantitative PCR analysis of E‐cadherin (A) and ZEB1 (B) in A549 cell line treated with sodium propionate at 5 mM in time series for 12 days. Dotted line represents the fold change cut‐off at 1.5 (A) or at 0.67 (B). Data points (n = 3) are technical replicates represented as mean ± SD of one experiment and the experiment was performed three independent times. Significance was calculated using un‐paired t‐test.
- C
Unsupervised hierarchical clustering analysis of RNA‐seq samples of A549 cell line treated with SP for 3 days and 12 days along with control (n = 3 per group).
- D, E
MA plot of differentially expressed genes identified in SP treated 3 days (D) and 12 days (E) compared to the control (n = 3 per group). Blue dots represent the significantly differentially expressed genes with a fold change of log2 (1).
- F, G
Venn diagram representation of overlap analysis between SP 3 days and SP 12 days up‐regulated (F) or down‐regulated (G) genes.
- H–J
GSEA of hallmark apical surface gene‐set enrichment in SP 3 days samples compared to the control (H), and enrichment of hallmark apical junction gene‐set (I) or hallmark apical surface (J) in SP 12 days samples compared to the control (n = 3). Ranking of genes based on Pearson's correlation metric was used for GSEA.
- K
Magnified images of immunofluorescence staining of EPCAM and ZO‐1 in A549 cell line treated with sodium propionate (SP) at 5 mM for 3 days from Fig 5E showing the increased expression of EPCAM and ZO‐1 in the membrane region. DAPI was used as a nuclear stain. Image was re‐used from Fig 5E. Scale bars: 10 μm.
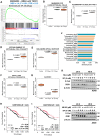
- A
Gene set enrichment analysis of SP 12 days down‐regulated gene‐set in TGFβ1‐induced HMLE cell line compared to the control obtained from GEO (GSE24202) (n = 3). Ranking of genes with signal2noise metric was used for GSEA.
- B–G
Box plot visualization of the markers of lung epithelial cell‐type gene‐set (B), pulmonary alveolar type II cell‐type gene‐set (C), establishment of epithelial cell polarity gene‐set (D), hallmark apical surface gene‐set (E), distal lung epithelial progenitor genes (F), and cancer stem cell marker (ALDH3A1 (G)) in control, SP 3 days and SP 12 days RNA‐seq samples of A549 cell line. The central band inside the box represents the median value of the data (n = 3) obtained using the lower (bottom) and upper (top) quartile values of the box. The maximum and minimum values of the data are displayed with vertical lines (whiskers) connecting the box. Significance was calculated using un‐paired t‐test between the SP treated cells and the control. All the lung epithelial cell‐type associated gene‐sets were collected from PanglaoDB (B–D) and hallmark apical surface gene‐set from MSigDB (E).
- H, I
Overall survival analysis in lung cancer patient samples (GSE72094; N = 442) categorized as low‐ and high‐propionate levels of SP 3 days (H) or SP 12 days (I) gene‐set z‐score activity based on the median showed good prognosis. HR – Hazard ratio for high propionate group was calculated using Cox proportional hazards model. P‐value was calculated using log‐rank method.
- J
Bar plot indicates the top ranked drug gene signatures similar to SP 12 days gene‐set based on the similarity score identified from L1000CDS2 search engine. Identical drugs from different treatment conditions are colored the same.
- K, L
Western blot analysis of E‐cadherin and ZEB1 in A549 cells treated with HDAC inhibitor, mocetinostat (K) or MI192 (L) in the indicated dose‐ and time‐dependent manner in combination with SP 5 mM. β‐Actin was used as an internal control.
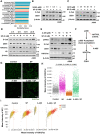
- A
Bar plot indicates the top ranked drug gene signatures similar to SP 12 days gene‐set based on the similarity score identified from L1000CDS2. Identical drugs from different treatment conditions are colored the same.
- B, C
Western blot analysis of E‐cadherin and ZEB1 protein expression in A549 cells treated with vorinostat (SAHA) (B) or Histone Acetyl Transferase inhibitor VII, CTK7A (HATi) (C) in the indicated dose‐dependent concentrations in combination with sodium propionate (SP, 5 mM) for 24 h. β‐Actin was used as an internal control. The experiments were performed three independent times.
- D
Western blot analysis of E‐cadherin, ZEB1, H3K27ac and H3 in A549 cells treated with sodium propionate (SP, 5 mM) in time series for 24 h. β‐Actin was used as an internal control. The experiment was performed three independent times.
- E
Western blot analysis of p300 acetylation, E‐cadherin, ZEB1 and H3K27ac in A549 cell line treated with HAT inhibitor, A‐485, in the indicated dose‐dependent concentrations in combination with sodium propionate (SP, 5 mM) for 24 h. β‐Actin was used as an internal control. The experiment was performed three independent times.
- F
Schematic flowchart of sodium propionate's role in the regulation of E‐cadherin expression through p300 histone acetyl transferase activity on H3K27ac mark.
- G
Images represent the H3K27ac mark levels analyzed by QIBC in A549 cells treated with A‐485 (10 μM) in the presence and absence of SP (5 mM). DAPI was used as a nuclei stain. Scale bars: 50 μm.
- H
QIBC analysis of mean intensity levels of H3K27ac mark in A549 cells (n = ~2000 single cells) treated with A‐485 (10 μM) in the presence and absence of SP (5 mM) for 24 h. Dots represent single cells and significance was calculated using One‐way ANOVA with post‐hoc analysis of t‐test between the conditions.
- I
Biplot representation of mean intensity of HP1 to H3K27ac mark levels from QIBC analysis in A549 cells (n = ~2000 single cells) treated with A‐485 (10 μM) in the presence and absence of SP (5 mM) for 24 h. Color intensity values represent the mean intensity levels of the histone marks with gray representing null to red indicating high intensity.
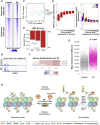
Heatmap visualization of ChIP‐sequencing for H3K27 acetylation (H3K27ac) mark enrichment at promoters and enhancers sites in A549 cells treated for 3 h with sodium propionate (SP, 5 mM) (n = 3 per group). Color intensity scale bar represents the normalized tag counts or read density at a given region.
UCSC Genome browser screen shot visualization of H3K27ac peak enrichment at CDH1 promoter region identified from ChIP‐seq for H3K27ac in A549 cells treated for 3 h with sodium propionate (SP, 5 mM). Peaks represented in the tracks are the normalized FPKM counts.
Principal component analysis of RNA‐seq expression profile of A549 cell line treated with SP for 3 and 24 h (n = 3 per group).
Bar plot represents the EMT score for control, 3 and 24 h RNA‐seq samples in biological replicates (n = 3) of A549 cells treated with sodium propionate. EMT score is the difference between the mesenchymal gene‐set score and epithelial gene‐set score obtained from SingScore. Data is represented as mean ± SE. P‐value was calculated from Welsch's two‐sided t‐test.
Box plot visualization of H3K27ac and gene expression changes with sodium propionate treatment in A549 cells for all expressed genes sorted low‐to‐high binning of gene expression from control. Left plot represent the log2 fold difference in H3K27ac profile during SP treatment for 3 h while the right plot represents the log2 fold difference in the gene expression profile of SP for 3 h and 24 h. RNA‐seq and ChIP‐seq was performed in biological replicates (n = 3). Boxplot: Center line, median; box limits; upper and lower quartiles; whiskers, 1.5× interquartile range; outliers are not shown.
Heatmap representation of top modulated post‐histone modifications identified by mass spectrometry in A549 cells treated with sodium propionate (SP) in time series for 24 h (n = 4 per group). Color intensity scale bar represent the log2 fold difference (FC) of SP with control (blue, FC < 0; white, FC = 0; red, FC > 0).
QIBC analysis of mean intensity levels of H3K4me3 in A549 cells treated with sodium propionate (SP, 5 mM) for 24 h (n = ~7,000 single cells). Dots represent single cells and significance between the conditions was calculated using un‐paired t‐test.
Schematic representation of the molecular mechanistic role of sodium propionate in epigenetic re‐programming to induce epithelial genes expression.
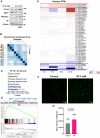
Western blot analysis of E‐cadherin, ZEB1, H3K27ac and H3 in A549 cells treated with sodium propionate (5 mM) for 3 and 24 h. β‐Actin was used as an internal control. The experiment was performed three independent times.
Unsupervised hierarchical clustering analysis of RNA‐seq samples of A549 cell line treated with SP at 5 mM for 3 and 24 h along with control (n = 3 per group).
Enrichr analysis of SP 24 h up‐regulated genes identified from RNA‐seq. P‐value was calculated using Fisher's exact test.
GSEA analysis of hallmark EMT gene‐set enrichment analysis in a lung cancer gene expression profile (GSE72094, N = 442) as a continuous label of SP 24 h down‐regulated gene‐set z‐score activity. Ranking of genes was based on Pearson's correlation metric in GSEA.
Heatmap representation of histone post‐translational modifications identified using mass spectrometry in A549 cells treated with sodium propionate at 5 mM in time series for 24 h (n = 4). Red highlighted box indicates the increased histone modifications in SP treated conditions compared to the control. Blue highlighted box indicates the decreased histone modifications in SP treated conditions compared to the control. Color intensity scale bar represent the log2 fold difference (FC) of SP with control (blue, FC < 0; white, FC = 0; red, FC > 0).
Representative images from QIBC analysis of A549 cells treated with SP (5 mM) for 24 h and stained with H3K4me3 antibody. Scale bars: 50 μm.
Bar plot of mean intensity level of H3K4me3 in A549 cells treated with SP (5 mM) for 24 h. Data points (n = ~7,000) are represented as mean ± SD and significance was calculated from un‐paired t‐test.
Similar articles
-
Circular RNA hsa_circ_0008305 (circPTK2) inhibits TGF-β-induced epithelial-mesenchymal transition and metastasis by controlling TIF1γ in non-small cell lung cancer.Mol Cancer. 2018 Sep 27;17(1):140. doi: 10.1186/s12943-018-0889-7. Mol Cancer. 2018. PMID: 30261900 Free PMC article.
-
Prediction of survival prognosis of non-small cell lung cancer by APE1 through regulation of Epithelial-Mesenchymal Transition.Oncotarget. 2016 May 10;7(19):28523-39. doi: 10.18632/oncotarget.8660. Oncotarget. 2016. PMID: 27074577 Free PMC article.
-
Remodelin delays non-small cell lung cancer progression by inhibiting NAT10 via the EMT pathway.Cancer Med. 2024 Jun;13(11):e7283. doi: 10.1002/cam4.7283. Cancer Med. 2024. PMID: 38826095 Free PMC article.
-
MCRS1 overexpression, which is specifically inhibited by miR-129*, promotes the epithelial-mesenchymal transition and metastasis in non-small cell lung cancer.Mol Cancer. 2014 Nov 6;13:245. doi: 10.1186/1476-4598-13-245. Mol Cancer. 2014. PMID: 25373388 Free PMC article.
-
MTA1 promotes epithelial to mesenchymal transition and metastasis in non-small-cell lung cancer.Oncotarget. 2017 Jun 13;8(24):38825-38840. doi: 10.18632/oncotarget.16404. Oncotarget. 2017. PMID: 28418915 Free PMC article.
Cited by
-
The Effect of Microbiome-Derived Metabolites in Inflammation-Related Cancer Prevention and Treatment.Biomolecules. 2025 May 8;15(5):688. doi: 10.3390/biom15050688. Biomolecules. 2025. PMID: 40427581 Free PMC article. Review.
-
The role of short-chain fatty acids in cancer prevention and cancer treatment.Arch Biochem Biophys. 2024 Nov;761:110172. doi: 10.1016/j.abb.2024.110172. Epub 2024 Oct 4. Arch Biochem Biophys. 2024. PMID: 39369836 Review.
-
Identification and prognostic analysis of propionate metabolism-related genes in head and neck squamous cell carcinoma.Front Oncol. 2025 Jun 12;15:1518587. doi: 10.3389/fonc.2025.1518587. eCollection 2025. Front Oncol. 2025. PMID: 40575157 Free PMC article.
-
Microbial diagnostic features identified across populations possess potential antitumor properties in breast cancer.mSystems. 2025 Jul 22;10(7):e0027125. doi: 10.1128/msystems.00271-25. Epub 2025 Jun 23. mSystems. 2025. PMID: 40548719 Free PMC article.
-
Biomarkers of Immunotherapy Response in Patients with Non-Small-Cell Lung Cancer: Microbiota Composition, Short-Chain Fatty Acids, and Intestinal Permeability.Cancers (Basel). 2024 Mar 13;16(6):1144. doi: 10.3390/cancers16061144. Cancers (Basel). 2024. PMID: 38539479 Free PMC article.
References
-
- den Besten G, Bleeker A, Gerding A, van Eunen K, Havinga R, van Dijk TH, Oosterveer MH, Jonker JW, Groen AK, Reijngoud DJ et al (2015) Short‐chain fatty acids protect against high‐fat diet‐induced obesity via a PPARγ‐dependent switch from lipogenesis to fat oxidation. Diabetes 64: 2398–2408 - PubMed
-
- Botling J, Edlund K, Lohr M, Hellwig B, Holmberg L, Lambe M, Berglund A, Ekman S, Bergqvist M, Pontén F et al (2013) Gene Expression Omnibus GSE37745. (https://www.ncbi.nlm.nih.gov/geo/query/acc.cgi?acc=GSE37745). [DATASET]
MeSH terms
Substances
Associated data
- Actions
- Actions
Grants and funding
LinkOut - more resources
Full Text Sources
Medical
Molecular Biology Databases
Research Materials
Miscellaneous

