. 2023 Sep 15;7(10):bvad117.
doi: 10.1210/jendso/bvad117. eCollection 2023 Aug 28.

Riluzole Suppresses Growth and Enhances Response to Endocrine Therapy in ER+ Breast Cancer

Affiliations

Riluzole Suppresses Growth and Enhances Response to Endocrine Therapy in ER+ Breast Cancer

Ayodeji O Olukoya et al. J Endocr Soc. .

Abstract

Background: Resistance to endocrine therapy in estrogen receptor-positive (ER+) breast cancer remains a significant clinical problem. Riluzole is FDA-approved for the treatment of amyotrophic lateral sclerosis. A benzothiazole-based glutamate release inhibitor with several context-dependent mechanism(s) of action, riluzole has shown antitumor activity in multiple malignancies, including melanoma, glioblastoma, and breast cancer. We previously reported that the acquisition of tamoxifen resistance in a cellular model of invasive lobular breast cancer is accompanied by the upregulation of GRM mRNA expression and growth inhibition by riluzole.

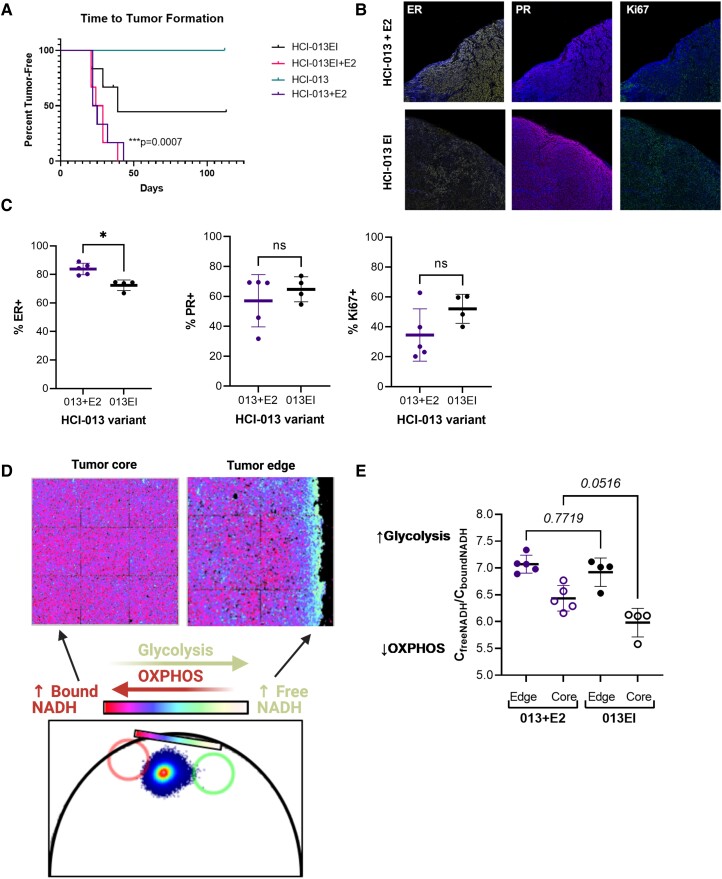
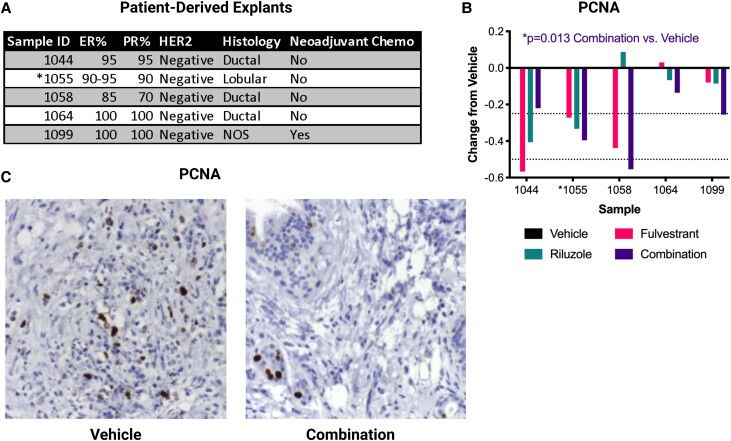
Methods: We tested the ability of riluzole to reduce cell growth, alone and in combination with endocrine therapy, in a diverse set of ER+ invasive ductal and lobular breast cancer-derived cell lines, primary breast tumor explant cultures, and the estrogen-independent, ESR1-mutated invasive lobular breast cancer patient-derived xenograft model HCI-013EI.

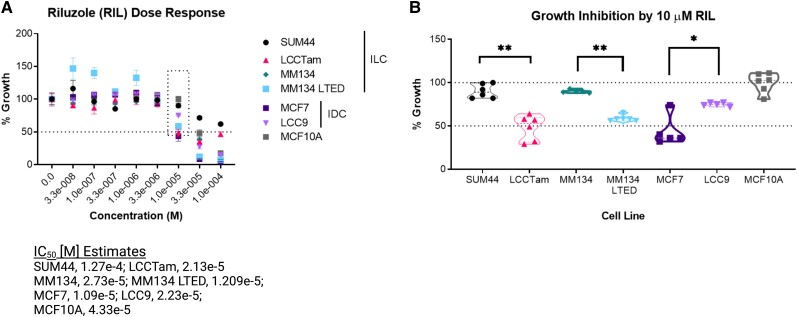
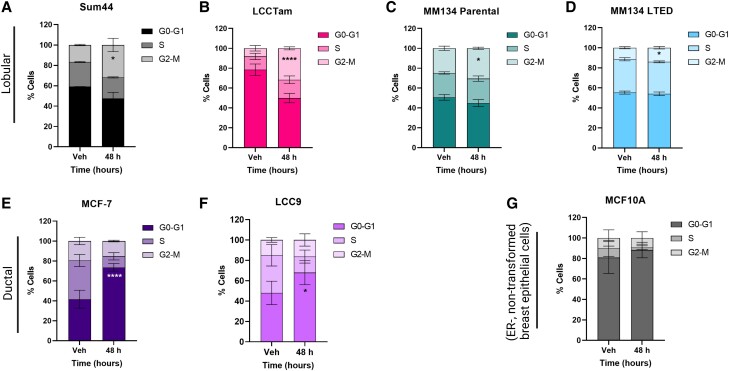
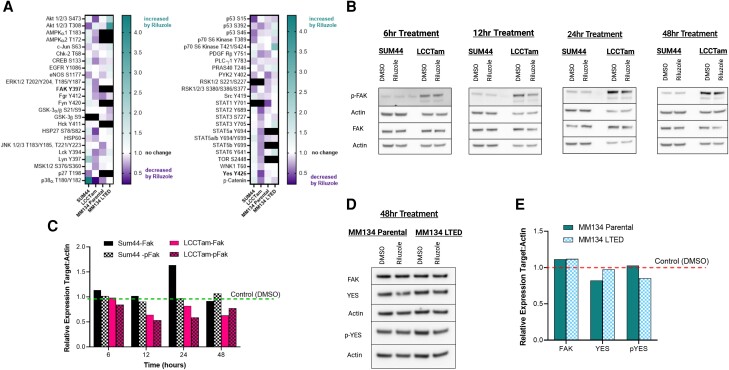
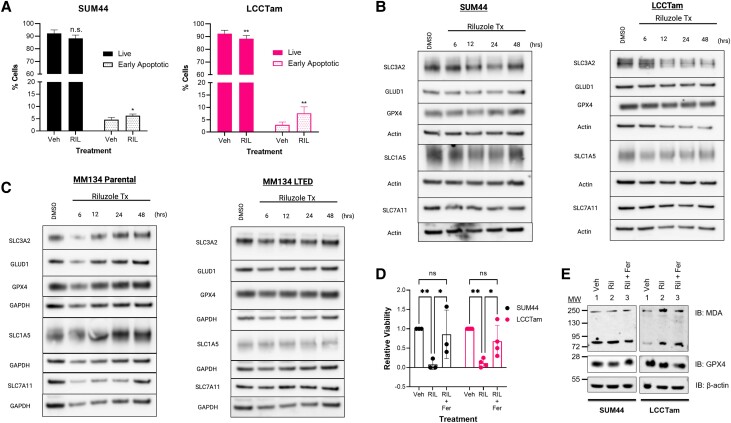
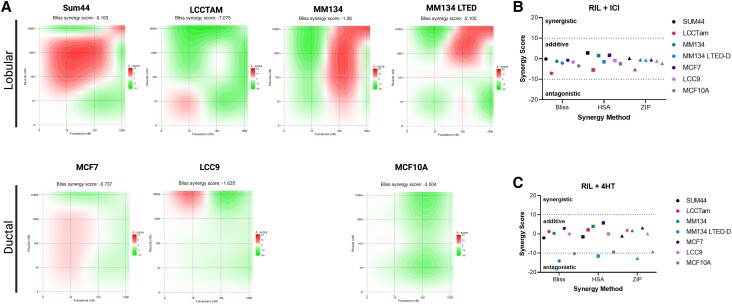
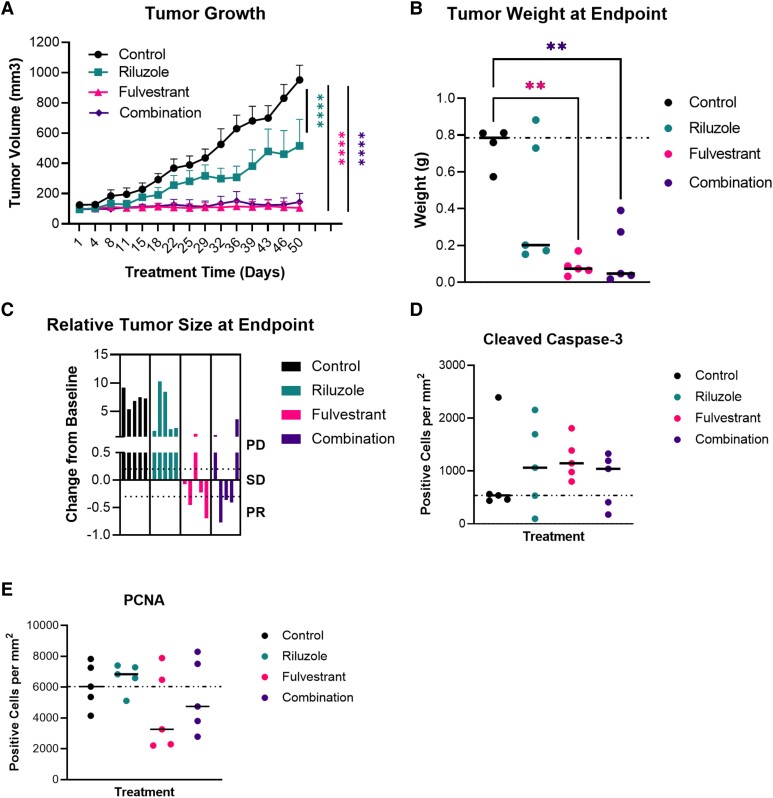
Results: Single-agent riluzole suppressed the growth of ER+ invasive ductal and lobular breast cancer cell lines in vitro, inducing a histologic subtype-associated cell cycle arrest (G0-G1 for ductal, G2-M for lobular). Riluzole induced apoptosis and ferroptosis and reduced phosphorylation of multiple prosurvival signaling molecules, including Akt/mTOR, CREB, and Fak/Src family kinases. Riluzole, in combination with either fulvestrant or 4-hydroxytamoxifen, additively suppressed ER+ breast cancer cell growth in vitro. Single-agent riluzole significantly inhibited HCI-013EI patient-derived xenograft growth in vivo, and the combination of riluzole plus fulvestrant significantly reduced proliferation in ex vivo primary breast tumor explant cultures.

Conclusion: Riluzole may offer therapeutic benefits in diverse ER+ breast cancers, including lobular breast cancer.

Keywords: estrogen receptor; fulvestrant; invasive lobular breast cancer; riluzole.


Figures

Figure 1.
Figure 1.
Growth suppression of ER+ breast cancer cell lines by riluzole. A, Cells seeded in 96-well plates were treated with the indicated concentrations of riluzole (RIL, 33nM to 100μM) or DMSO control for 7 to 8 days prior to staining with crystal violet. Data are presented as mean % growth ± standard error of the mean (SEM) of % growth (vehicle = 100%) for 5 or 6 technical replicates and represent 2 to 4 independent biological assays. The dotted line box indicates data re-graphed in panel B. Data were analyzed by nonlinear regression ([inhibitor] vs normalized response), yielding the following IC50 [M] estimates: SUM44, 1.27e-4; LCCTam, 2.13e-5; MM134, 2.73e-5; MM134 LTED, 1.209e-5; MCF7, 1.09e-5; LCC9, 2.23e-5; MCF10A, 4.33e-5. B, Relative response to 10μM RIL re-graphed from panel A (dotted line box). Data are presented as median % growth with upper/lower quartiles of % growth (vehicle = 100%) for 5 to 6 technical replicates and represent 2 to 4 independent biological assays. For the SUM44/LCCTam, MM134/MM134 LTED, and MCF7/LCC9 cell line pairs, data were compared by the Mann-Whitney test. **P = .002, **P = .0043, and *P = .024 respectively. Dashed lines denote 50% (panels A and B) and 100% growth (panel B).
Figure 2.
Figure 2.
Riluzole induces a histologic subtype-associated cell cycle arrest (A-D, ILC; E-F, IDC; G, nontransformed cell control). Cells seeded in 6-well plates were treated with 10μM riluzole or DMSO control (vehicle, Veh) for the indicated times prior to collection, fixation, staining, and cell cycle analysis. Data are presented as mean % cells ± SD for 3 or 4 independent biological assays and analyzed by two-way ANOVA followed by either Sidak's (single time point) or Dunnett's (multiple time points) multiple comparisons tests. SUM44: *P = .018. LCCTam: ****P < .0001. MM134: *P = .011. MM134 LTED: *P = .05. MCF7: ****P < .0001. LCC9: *P = .015. MCF10A: not significant.
Figure 3.
Figure 3.
Riluzole inhibits phosphorylation of prosurvival signaling molecules and Fak/Src kinases. A, Cells seeded in 6-well plates were treated with 10μM riluzole or DMSO control (vehicle, Veh) for 2 days prior to collection, lysis, and processing, then assayed using the Human Phospho-Kinase Proteome ProfilerTM Array. A ratio of background-corrected intensity values for targets (phospho-kinase spots) to references (control spots) was created for each condition (DMSO and riluzole) within each cell line. Black squares indicate absence of the indicated phospho-antibody from the array used for that cell line pair. Data are presented as the geometric mean of the riluzole: DMSO ratio for 2 technical replicates from a single experiment. B, SUM44, and LCCTam cells seeded in 6-well plates were treated with 10μM riluzole or DMSO control for several time points (6,12, 24, and 48 hours). Cells were collected, lysed, and Western blot analysis was performed to test for expression and phosphorylation of Fak Y397. The data are presented as images showing expression levels. C, Quantification analysis of Fak and P-Fak protein band density from Western blot in Fig. 3B. D, MM134, and MM134 LTED, cells seeded in 6-well plates were treated with 10μM riluzole or DMSO control for 48 hours. Cells were collected, lysed, and Western blot analysis was performed to test for expression of Fak, as well as expression and phosphorylation of Yes Y426. E, Quantification analysis of Fak, Yes, and P-Yes protein band density from Western blot in Fig. 3D.
Figure 4.
Figure 4.
Riluzole can induce apoptosis and ferroptosis, and it alters expression of glutamate transporters and metabolic enzymes. A, Cells seeded in 6-well plates were treated with 10μM riluzole or DMSO control (vehicle, Veh) for 2 days prior to staining with Annexin V and PI. The percent of live cells (PI, annexin V) and early apoptotic (PI, annexin V+) cells are shown. Data are presented as mean % cells ± SD for 3 (SUM44) or 4 (LCCTam) independent biological assays and analyzed by two-way ANOVA followed by Sidak's multiple comparisons test (*P = .021, **P = .04 (live) and **P = .011). B and C, SUM44 and LCCTam (B), and MM134 and MM134 LTED (C), cells seeded in 6-well plates were treated with 10μM riluzole or DMSO control for several time points (6,12, 24, and 48 hours). Cells were collected, lysed, and Western blot analysis was performed to test for expression of SLC1A5, SLC3A2, SLC7A11, GLUD1, and GPX4. The data are presented as images showing expression levels. D, SUM44 and LCCTam cells were seeded in 6-well plates. Twenty-four hours later, cells were treated with control (DMSO), riluzole (10μM), or a combination of riluzole and ferrostatin-1 (10 uM). 24 hours after treatment, the cells were collected, stained with trypan blue, and counted. Data are presented as mean ± SD of the ratio of the cell number of the treatment groups relative to the control for 3 or 4 independent biological assays and analyzed by two-way ANOVA followed by Tukey's multiple comparison test (SUM44, [**P = .005, *P = .016]; LCCTam, [**P = .002, *P = .043]). E, SUM44, and LCCTam cells seeded in 6-well plates were treated with control (DMSO), riluzole (10µM), or a combination of riluzole and ferrostatin-1 (10µM) for 48 hour. After treatment, cells were collected, lysed, and Western blot analysis was performed to test for expression of the malondialdehyde (MDA) byproduct of lipid peroxidation, and GPX4. The data are presented as images showing expression levels.
Figure 5.
Figure 5.
Additive suppression of ER+ breast cancer cell line growth by riluzole in combination with endocrine therapies. A, Cells seeded in 96-well plates were treated with 1μM fulvestrant, 10μM riluzole (RIL), the combination, or DMSO control (vehicle, Veh) for 7 to 8 days prior to staining with crystal violet. Data are processed as the mean % growth for 5 or 6 technical replicates and represent 2 to 4 independent biological assays. The mean % growth data of a representative single technical replicate was then used to create a combination matrix used in SynergyFinder, and the results were presented as 2D surface plots. The SynergyFinder scores are shown at the top of the plots, highlighting the level of synergy. B and C, Graphical representation of the synergy scores from the riluzole/fulvestrant (B) and riluzole/4-hydroxytamoxifen (4HT) (C) combination using 3 models: Bliss, highest single agent (HSA), and zero interaction potency (ZIP).
Figure 6.
Figure 6.
Characterization of tumor growth, hormone receptor expression, and metabolic state for HCI-013 vs HCI-013EI ILC PDX models. A, Tumor latency for HCI-013 and HCI-013EI patient-derived xenografts (PDXs) with or without estrogen (E2) supplementation. Mice (6 mice per group) were orthotopically implanted with a 1- to 3-mm3 PDX fragment, then followed until measurable tumor development (by calipers). Data are presented as percent tumor free and were analyzed by log-rank (Mantel-Cox) test. ***P = .0007. B, Representative images of ER, PR, and Ki67 staining from HCI-013+E2 and HCI-013EI tumors. C, Semi-quantitative analysis of multiplex IHC (mIHC) staining for ER, PR, and Ki67 from HCI-013+E2 (n = 5) and HCI-013EI (n = 4) tumors from mice independent of those for whom tumor latency is shown in panel A. Data are presented as overall mean ± SD of % marker positivity for 5 to 13 fields per tumor. D, Representative schematic of fluorescence lifetime imaging microscopy (FLIM) analysis of cellular metabolism at the tumor core and edge. Images are pseudo-colored based on the phasor plot (below) where more protein-bound and more free NADH phasor positions are indicated by red and cyan circles, respectively, and the color scheme chosen reflects more bound NADH in purple and more free NADH in cyan. E, Quantification of FLIM in HCI-013 + E2 vs HCI-013EI tumor cores and edges. Tumor edges were strongly glycolytic in both HCI-013 + E2 and HCI-013EI, but tumor cores were preferentially in an oxidative phosphorylated state in HCI-013EI.The data were analyzed by one-way ANOVA (P < .0001) followed by Tukey's multiple comparisons test. Each symbol indicates the mean Cfree NADH/Cbound NADH for 16 fields of view of the tumor edge or core in an individual tumor (n = 4-5 tumors per PDX line).
Figure 7.
Figure 7.
Single-agent riluzole inhibits tumor growth in vivo, but the combination with fulvestrant is not better than fulvestrant alone in the HCI-013EI ILC PDX model. A, Forty-eight mice were orthotopically implanted with a 1- to 3-mm3 HCI-013EI PDX fragment without E2 supplementation, then followed until tumors reached ∼100 mm3 before enrollment into 1 of 4 treatment arms: control (n = 5), fulvestrant (n = 5), riluzole (n = 5), or the combination (n = 5). Mice were monitored for tumor growth (measured by calipers) and body weight twice per week. Data are presented as mean tumor volume ± SEM, and were analyzed by mixed-effects analysis followed by Dunnett's multiple comparisons tests at each timepoint vs control. B, At the end of the study, tumors were collected and weighed. The graph illustrates the summary of the collected data, which were analyzed using Browne-Forsyth and Welch ANOVA followed by Dunnett's T3 multiple comparisons tests. C, Graph showing relative tumor size at endpoint according to RECIST 1.1 criteria. It shows that 2 of 5 tumors in the fulvestrant group and 3 of 5 in the combination group achieved partial response. Abbreviations in Figure 7C graph: PD, progressive disease; PR, partial response; SD, stable disease. D and E, The tumors collected from each treatment group were formalin-fixed, paraffin-embedded, sectioned, and stained with proliferating cell nuclear antigen (PCNA) and Caspase-3 by IHC. These antibodies served as a proxy for proliferation and apoptosis, respectively. The stained samples were analyzed, and the data were presented graphically in D for PCNA, and E for Caspase-3.
Figure 8.
Figure 8.
Riluzole plus fulvestrant significantly inhibits proliferation in primary breast tumor explant cultures. A, Pathologic data for 5 patient-derived explants (PDEs). ER, PR, and Ki67% are from the initial surgical specimen, and NOS = not otherwise specified. *denotes the PDE for which representative images are shown in panel C. B, PDEs were treated with 100nM fulvestrant, 10μM riluzole, the combination, or DMSO control (vehicle) for 2 days prior to formalin fixation, paraffin embedding, sectioning, and staining for PCNA by IHC. Data are presented as change relative to vehicle (set to 0) for each explant and analyzed by one-sample t test vs 0 (vehicle). *P = .013 Vehicle vs Combination. *denotes the PDE for which representative images are shown in panel C. C, Representative images of PCNA and Caspase-3 staining from PDE #1055 (ILC).

Comment in

Similar articles

Cited by

References

    1. Siegel RL, Miller KD, Wagle NS, Jemal A. Cancer statistics, 2023. CA Cancer J Clin. 2023;73(1):17‐48. - PubMed
    1. Burstein HJ, Lacchetti C, Anderson H, et al. . Adjuvant endocrine therapy for women with hormone receptor-positive breast cancer: ASCO clinical practice guideline focused update. J Clin Oncol. 2019;37(5):423‐438. - PubMed
    1. Hanker AB, Sudhan DR, Arteaga CL. Overcoming endocrine resistance in breast cancer. Cancer Cell. 2020;37(4):496‐513. - PMC - PubMed
    1. Ciriello G, Gatza ML, Beck AH, et al. . Comprehensive molecular portraits of invasive lobular breast cancer. Cell. 2015;163(2):506‐519. - PMC - PubMed
    1. Desmedt C, Zoppoli G, Gundem G, et al. . Genomic characterization of primary invasive lobular breast cancer. J Clin Oncol. 2016;34(16):1872‐1881. - PubMed

LinkOut - more resources