. 2023 Apr 14:8:171.
doi: 10.12688/wellcomeopenres.18827.1. eCollection 2023.

A controlled evaluation of filter paper use during staining of sputum smears for tuberculosis microscopy

Affiliations

A controlled evaluation of filter paper use during staining of sputum smears for tuberculosis microscopy

Nataly Bailon et al. Wellcome Open Res. .

Abstract

Background: Some sputum smear microscopy protocols recommend placing filter paper over sputum smears during staining for Mycobacterium tuberculosis (TB) . We found no published evidence assessing whether this is beneficial. We aimed to evaluate the effect of filter paper on sputum smear microscopy results. Methods: Sputum samples were collected from 30 patients with confirmed pulmonary TB and 4 healthy control participants. From each sputum sample, six smears (204 smears in total) were prepared for staining with Ziehl-Neelsen (ZN), auramine or viability staining with fluorescein diacetate (FDA). Half of the slides subjected to each staining protocol were randomly selected to have Whatman grade 3 filter paper placed over the dried smears prior to stain application and removed prior to stain washing. The counts of acid-fast bacilli (AFB) and precipitates per 100 high-power microscopy fields of view, and the proportion of smear that appeared to have been washed away were recorded. Statistical analysis used a linear regression model adjusted by staining technique with a random effects term to correct for between-sample variability. Results: The inclusion of filter paper in the staining protocol significantly decreased microscopy positivity independent of staining with ZN, auramine or FDA (p=0.01). Consistent with this finding, there were lower smear grades in slides stained using filter paper versus without (p=0.04), and filter paper use reduced AFB counts by 0.28 logarithms (95% confidence intervals, CI=0.018, 0.54, p=0.04) independent of staining technique. In all analyses, auramine was consistently more sensitive with higher AFB counts versus ZN (p=0.001), whereas FDA had lower sensitivity and lower AFB counts (p<0.0001). Filter paper use was not associated with the presence of any precipitate (p=0.5) or the probability of any smear washing away (p=0.6) during the staining process. Conclusions: Filter paper reduced the sensitivity of AFB microscopy and had no detectable beneficial effects so is not recommended.

Keywords: Auramine; Filter paper; Ziehl Neelsen; acid-fast bacilli; fluorescein diacetate; microscopy; sputum smear; tuberculosis.


Conflict of interest statement

No competing interests were disclosed.

Figures

Figure 1.
Figure 1.. Diagnostic tests performed including 204 microscopy slides from all 34 samples included in the study.
PCR and culture testing were omitted for the 4 samples from healthy control participants. Note: ZN indicates Ziehl-Neelsen and FDA indicates fluorescein diacetate.
Figure 2.
Figure 2.. Diagram of how filter paper was used to stain each smear with Ziehl-Neelsen (ZN), auramine (AR) and fluorescein diacetate (FDA).
Figure 3.
Figure 3.. Percentage positivity of slides stained without versus with filter paper used during staining.
Error bars indicate 95% confidence intervals (CI). The P value is from a linear regression model with a random effects term shown in Table 3, whereas crude data are shown graphically. Note: ZN indicates Ziehl-Neelsen and FDA indicates fluorescein diacetate.
Figure 4.
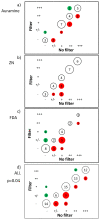
Figure 4.. Matrix bubble plot comparing the smear microscopy grade without versus with filter paper used during staining.
The numbers indicate the number of samples, which is proportional to the area of each circle (bubble). Note per 100 high-power fields visualized: - indicates negative; +/- indicates 1-10 bacilli; + indicates 10-99 bacilli; ++ indicates 100-999 bacilli; +++ indicates =>1000 bacilli; red circles indicate smear grade reduced with filter paper; and green circles indicate smear grade increased with filter paper. The P value is from a linear regression model with a random effects term shown in Table 3, whereas crude data are presented in all plots.
Figure 5.
Figure 5.. Average base-10 logarithmic acid-fast bacilli (log AFB) counts per 100 high-power fields visualized without versus with filter paper used during staining, Error bars indicate 95% confidence intervals (CI).
The P value is from a linear regression model with a random effects term shown in Table 3, whereas crude data are shown graphically. Note: ZN indicates Ziehl-Neelsen and FDA indicates fluorescein diacetate.
Figure 6.
Figure 6.. Percentage of slides with any precipitates visible per 100 high-power fields on each sputum smear without versus with filter paper.
Error bars indicate 95% confidence intervals (CI). The P value is from a linear regression model with a random effects term shown in Table 4, whereas crude data are shown graphically. Note: ZN indicates Ziehl-Neelsen and FDA indicates fluorescein diacetate.
Figure 7.
Figure 7.. Box plot of the number of precipitates visible per 100 high-power fields on each sputum smear stained without versus with filter paper.
The median value is shown by the horizontal line within the box, and outer box limits indicating the inter-quartile range (IQR). The P value is from a linear regression model with a random effects term shown in Table 4, whereas crude data are shown graphically. Note: ZN indicates Ziehl-Neelsen and FDA indicates fluorescein diacetate.
Figure 8.
Figure 8.. Percentage with any of the sputum smear area that appeared to have been washed away during staining on each sputum smear without versus with filter paper.
Error bars indicate 95% confidence intervals (CI). The P value is from a linear regression model with a random effects term shown in Table 4, whereas crude data are shown graphically. Note: ZN indicates Ziehl-Neelsen and FDA indicates fluorescein diacetate.
Figure 9.
Figure 9.. Box and whisker plots of the percentage of the sputum smear area that was estimated to have been washed away during staining.
The median value is shown by the horizontal line within the box, and outer box limits indicating the inter-quartile range (IQR). Outlier data are shown as individual points. The P value is from generalised linear regression model with a random effects term shown in Table 4, whereas crude data are shown graphically. Note: ZN indicates Ziehl-Neelsen and FDA indicates fluorescein diacetate.

Similar articles

References

    1. World Health Organization: Global tuberculosis report 2020. 2020. Reference Source
    1. Datta S, Shah L, Gilman RH, et al. : Comparison of sputum collection methods for tuberculosis diagnosis: a systematic review and pairwise and network meta-analysis. Lancet Glob Health. 2017;5(8):e760–e771. 10.1016/S2214-109X(17)30201-2 - DOI - PMC - PubMed
    1. Datta S, Alvarado K, Gilman RH, et al. : Optimising fluorescein diacetate sputum smear microscopy for assessing patients with pulmonary tuberculosis. PLoS One. 2019;14(4):e0214131. 10.1371/journal.pone.0214131 - DOI - PMC - PubMed
    1. Hooja S, Pal N, Malhotra B, et al. : Comparison of Ziehl Neelsen & Auramine O staining methods on direct and concentrated smears in clinical specimens. Indian J Tuberc. 2011;58(2):72–6. - PubMed
    1. Girma S, Avanzi C, Bobosha K, et al. : Evaluation of Auramine O staining and conventional PCR for leprosy diagnosis: A comparative cross-sectional study from Ethiopia. PLoS Negl Trop Dis. 2018;12(9):e0006706. 10.1371/journal.pntd.0006706 - DOI - PMC - PubMed

LinkOut - more resources