. 2023 Sep 9;26(10):107854.
doi: 10.1016/j.isci.2023.107854. eCollection 2023 Oct 20.

Bayesian multivariate genetic analysis improves translational insights

Affiliations

Bayesian multivariate genetic analysis improves translational insights

Sarah M Urbut et al. iScience. .

Abstract

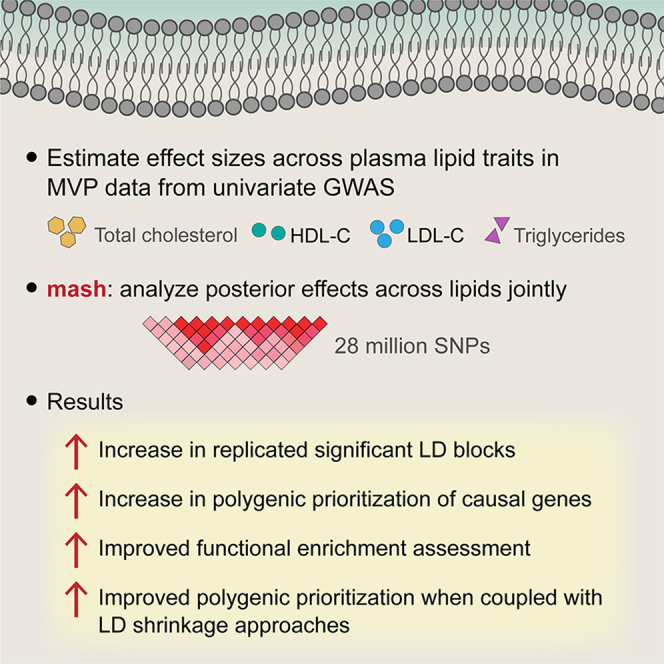
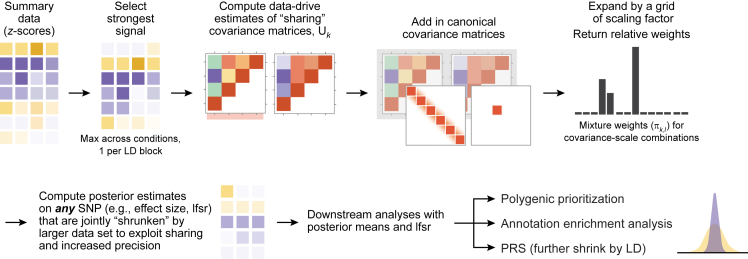
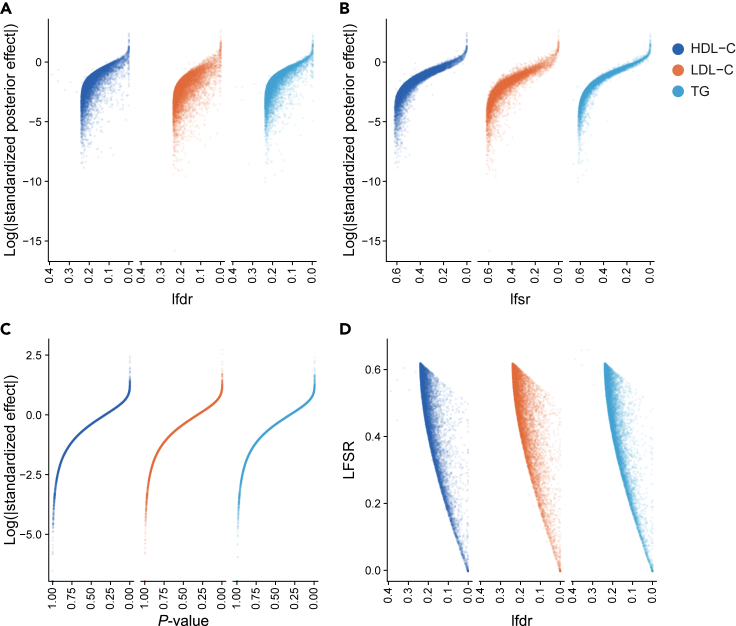
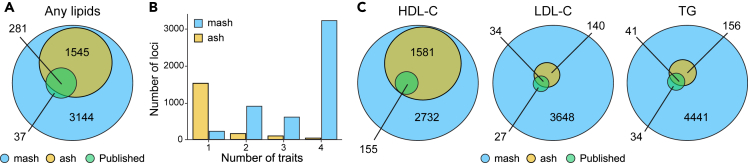
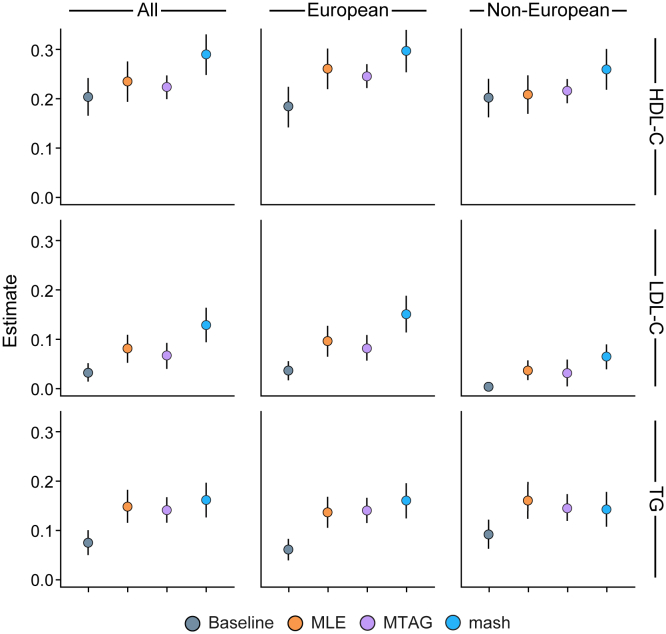
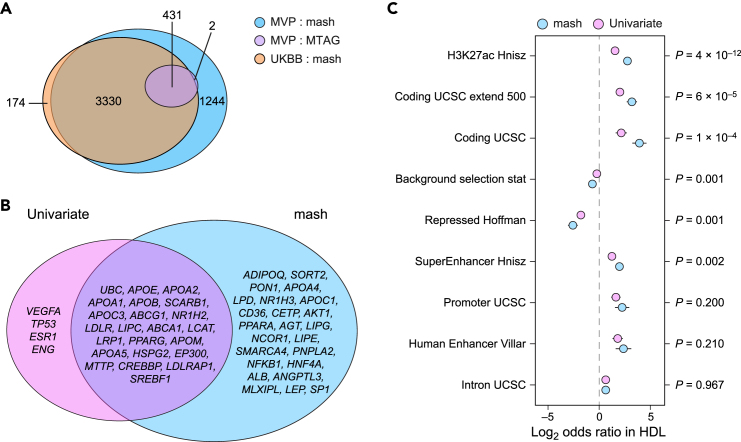
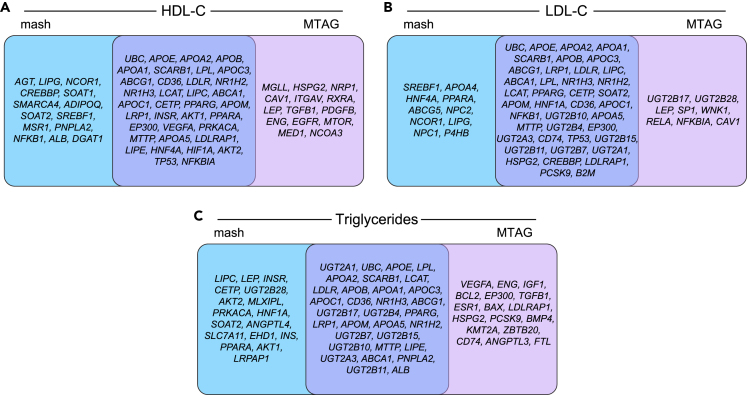
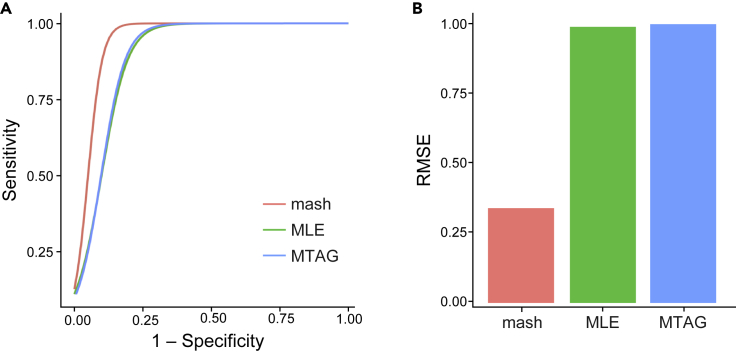
While lipid traits are known essential mediators of cardiovascular disease, few approaches have taken advantage of their shared genetic effects. We apply a Bayesian multivariate size estimator, mash, to GWAS of four lipid traits in the Million Veterans Program (MVP) and provide posterior mean and local false sign rates for all effects. These estimates borrow information across traits to improve effect size accuracy. We show that controlling local false sign rates accurately and powerfully identifies replicable genetic associations and that multivariate control furthers the ability to explain complex diseases. Our application yields high concordance between independent datasets, more accurately prioritizes causal genes, and significantly improves polygenic prediction beyond state-of-the-art methods by up to 59% for lipid traits. The use of Bayesian multivariate genetic shrinkage has yet to be applied to human quantitative trait GWAS results, and we present a staged approach to prediction on a polygenic scale.

Keywords: Association analysis; Biocomputational method; Computational bioinformatics; Genomic analysis; Human genetics.


Conflict of interest statement

C.J.O. is an employee of Novartis. P.N. reports research grants from Allelica, Apple, Amgen, Boston Scientific, Genentech/Roche, and Novartis, personal fees from Allelica, Apple, AstraZeneca, Blackstone Life Sciences, Eli Lilly & Co, Foresite Labs, Genentech/Roche, GV, HeartFlow, Magnet Biomedicine, and Novartis, scientific advisory board membership of Esperion Therapeutics, Preciseli, and TenSixteen Bio, scientific co-founder of TenSixteen Bio, equity in MyOme, Preciseli, and TenSixteen Bio, and spousal employment at Vertex Pharmaceuticals, all unrelated to the present work.

Figures

None
Graphical abstract
Figure 1
Figure 1
Mash estimates data-drive covariance patterns of true genetic effects as the multivariate prior to improve posterior estimates for downstream analyses Mash estimates the covariance of the effects in an empirical Bayes fashion, thus estimating patterns of sharing among conditions (here, lipid traits) from the strongest signals in the data, and estimating the relative abundance of such patterns from a random set of all data. This allows us to provide the posterior estimate of the effect and its associated local false sign rate, or posterior probability of incorrectly identifying the sign of the effect, for each SNP and use these posterior estimates to improve performance in polygenic prioritization, enrichment analyses, on polygenic risk scoring. mash, multivariate adaptive shrinkage; SNP, single nucleotide polymorphism; lfsr, local false sign rate; PRS, polygenic risk score; LD, linkage disequilibrium.
Figure 2
Figure 2
The utility of controlling for false discovery (A and B) (A) A multivariate approach allows that for a given probability of being null (lfdr) or for a given local false sign rate (lfsr) (B) there can be a variety of effect sizes depending on the relative strength of evidence in alternative subgroups. (C) We demonstrate the relationship between effect size and p value. (D) Finally, (D) a given non-null rate can lead to greater resolutions in the range of possible local false sign rates as reflected in a variety of Local false sign rates for a given non-null rate. HDL-C, high-density lipoprotein cholesterol; lfsr, local false sign rate; lfdr, local false discovery ratel; LDL-C, low-density lipoprotein cholesterol; LDSC, linkage disequilibrium score; TG, triglycerides.
Figure 3
Figure 3
Control of false discovery improves power to detect over control of family-wise error rate (A and B) (A) Univariate measure of local false sign rate control using ash replicates essentially all existing associations and dramatically increases power to detect. Multivariate adaptive shrinkage adds an additional layer of local false sign rate control by incorporating information across phenotypes. We plot the number of LD blocks containing at least one significant variant across traits in (B) joint approach results in most significant associations being shared in at least 2 subgroups, whereas a univariate approach does not capture the tendency to share effects across conditions. (C) HDL-C, LDL-C, and TG. Of note, there are 5583 500-kb blocks present in our dataset. Ash, univariate adaptive shrinkage; mash, multivariate adaptive shrinkage; HDL-C, high-density lipoprotein cholesterol; LDL-C, low-density lipoprotein cholesterol; TG, triglycerides.
Figure 4
Figure 4
Mash improves polygenic prediction We consider the improvement in proportion of variation explained by LDpred2 on prediction of lipid traits across ethnicities using mash derived posteriors and univariate GWAS estimates as weight inputs over a model including only baseline covariates. Here we display the estimate of R2 and corresponding 95% CI. We compare the performance of the infinitesimal model using maximum likelihood estimates (MLE), multivariate (mash) or multivariate trait association for GWAS (MTAG) output for all (global), European ancestry, or non-European ancestry (See STAR methods for details; Table S4 for results in tabular form) to a baseline model using only baseline covariates of age and sex in each model. GWAS, genome-wide association study; Ash, univariate adaptive shrinkage; mash, multivariate adaptive shrinkage; HDL-C, high-density lipoprotein cholesterol; LDL-C, low-density lipoprotein cholesterol; TG, triglycerides.
Figure 5
Figure 5
Bayesian multivariate method improves discovery and improves polygenic prioritization consistency of known lipid targets while enhancing known annotation estimation (A) MVP and UKB were fit using mash separately. MTAG was fit on the MVP dataset. We delimited identical 500-kb LD blocks and computed all blocks containing at least one variant at an lfsr <0.05 across traits. There are 5583 blocks present in total. Hypergeometric p = 1 × 10−83 for replication between mash and UKBB. (B) Mash consistently prioritizes 47 genes among LDL-C, HDL-C, and TG, while univariate methods prioritize 23. Of these, 24 are found consistently by mash but not by univariate (MLE) approach, while only 4 are found consistently by univariate approach but not mash. We use polygenic prioritization framework detailed in. (C) Using TORUS we consider enrichment in 27 of the 52 classes examined by Finucane et al. and see that mash versus univariate estimates tend to increase features known to be enriched in GWAS hits and decrease those known to be depleted (p values for difference in the plot). We display for HDL-cholesterol (LDL-C, TG, and TC in Figures S5–S7; Table S5).GWAS = genome-wide association study, HDL-C, high-density lipoprotein cholesterol; LDL-C, low-density lipoprotein cholesterol; mash, multivariate adaptive shrinkage; TG, triglycerides; TC, total cholesterol; MVP:mash, Million Veterans Program data analyzed using mash; MVP:uni, Million Veterans Program Data analyzed using traditional GWAS univariate analysis; UKB:mash, UK Biobank data analyzed using mash; UKBB:uni, UK Biobank data analyzed using traditional GWAS univariate analysis; MVP:MTAG, Million Veterans Program Data analyzed using MTAG.
Figure 6
Figure 6
Performance of polygenic prioritization using MTAG and mash (A–C) Above, we use mash or MTAG summary effect sizes for 11.8 M variants from the Millions Veterans Project (N = 330K) as inputs to PoPS polygenic prioritization and return the top 50 ranked genes in HDL, LDL and TG (A,B,C). HDL-C, HDL cholesterol; LDL-C, LDL-cholesterol; TG, Triglycerides. Full list available in Table S2B mash, multivariate adaptive shrinkage; MLE, maximum likelihood estimate; MTAG, multi-trait analysis of GWAS.
Figure 7
Figure 7
Mash exceeds existing multivariate method MTAG in simulated framework (A) Here, we simulate 1.3 million HapMap3 SNPS with genome-wide heritability of 0.6 across four traits. In this setting, the 1000 causal SNPS are shared identically by all traits, while the effect sizes have a between trait correlation of 0.7 with the main trait. Under these conditions, we estimate the tradeoff in True Positives versus False Positives for a given threshold. The empirical True Positive (sensitivity) and False Positive (1- specificity) are plotted along the x axis in (A). (B) We display the root mean squared error for all effects, defined as RMSE=(θθˆ)2wherehereθrepresentsthetrueeffect. The simulation is intentionally sparse to replace a GWAS instance with less than 0.001% causal effects. Please see detailed STAR Methods section for further details. mash, multivariate adaptive shrinkage; MLE, maximum likelihood estimate; MTAG, multi-trait analysis of GWAS.

Similar articles

References

    1. Zuk O., Hechter E., Sunyaev S.R., Lander E.S. The mystery of missing heritability: Genetic interactions create phantom heritability. Proc. Natl. Acad. Sci. USA. 2012;109:1193–1198. doi: 10.1073/pnas.1119675109. - DOI - PMC - PubMed
    1. Manolio T.A., Collins F.S., Cox N.J., Goldstein D.B., Hindorff L.A., Hunter D.J., McCarthy M.I., Ramos E.M., Cardon L.R., Chakravarti A., et al. Finding the missing heritability of complex diseases. Nature. 2009;461:747–753. - PMC - PubMed
    1. Zhu X., Stephens M. Bayesian Large-Scale Multiple Regression with Summary Statistics from Genome-wide Association Studies. bioRxiv. 2016 doi: 10.1101/042457. Preprint at. - DOI - PMC - PubMed
    1. Urbut S.M., Wang G., Carbonetto P., Stephens M. Flexible statistical methods for estimating and testing effects in genomic studies with multiple conditions. Nat. Genet. 2019;51:187–195. doi: 10.1038/s41588-018-0268-8. - DOI - PMC - PubMed
    1. Stephens M. False discovery rates: a new deal. Biostatistics. 2017;18:275–294. doi: 10.1093/biostatistics/kxw041. kxw041. - DOI - PMC - PubMed

LinkOut - more resources