. 2023 Aug 30;7(6):102179.
doi: 10.1016/j.rpth.2023.102179. eCollection 2023 Aug.

Tissue factor-heparanase complex: intracellular nonhemostatic effects

Affiliations

Tissue factor-heparanase complex: intracellular nonhemostatic effects

Shorook Ghanem et al. Res Pract Thromb Haemost. .

Abstract

Background: Heparanase, known to be involved in angiogenesis, cancer progression, and inflammation, was shown to form a complex with tissue factor (TF) via its procoagulant domain and to enhance the hemostatic system.

Objectives: To reveal a potential role of heparanase procoagulant domain in nonhemostatic effects.

Methods: Effects of peptides 16 and 16AC derived from the heparanase procoagulant domain, discovered by our group, were studied using the XTT proliferation assay, western blot analysis, and immunostaining in vitro and a mouse wound-healing model.

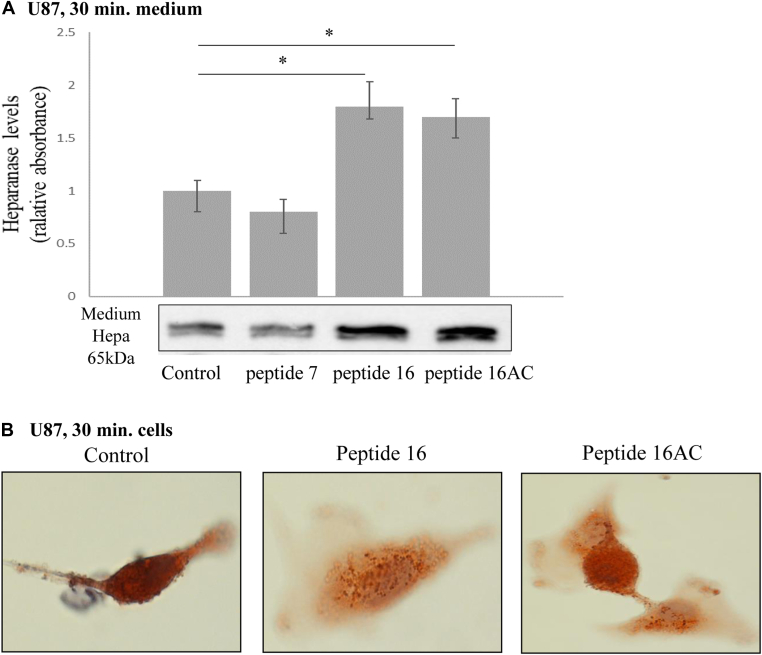
Results: Procoagulant peptides induced increased proliferation, release of heparanase, and upregulation of heparanase, TF, tissue factor pathway inhibitor (TFPI), and TFPI-2 in U87, T47D, and MCF-7 tumor cell lines and in endothelial cells. These results were reversed by a peptide derived from TFPI-2 that inhibited the heparanse procoagulant domain-TF complex. Thrombin had a similar effect on tumor cell proliferation and heparanase release, although the impact of thrombin on cell proliferation was mediated by the heparanase procoagulant domain. A mouse model of full-thickness skin incision exhibited higher levels of heparanase, TF, TFPI, and TFPI-2 in the healing skin, mainly in the blood vessel wall and lumen in animals injected with the procoagulant peptides compared to controls. The cells transfected to overexpress full-length TF or TF devoid of the cytoplasmic domain demonstrated that the procoagulant domain conveyed intracellular signaling via TF.

Conclusion: Heparanase procoagulant domain induces nonhemostatic effects via TF. The finding that TF serves as a receptor to heparanase supports the close direct relation between the hemostatic system and cancer progression.

Keywords: heparanase; neoplastic processes; receptor; tissue factor; tissue factor pathway inhibitor.


Figures

None
Graphical abstract
Figure 1
Figure 1
Procoagulant peptides stimulate a significant release of heparanase from tumor cells and upregulate the expression of heparanase, tissue factor (TF), tissue factor pathway inhibitor (TFPI), and tissue factor pathway inhibitor-2 (TFPI-2). (A) Western blot analysis. U87 heparanase overexpressing cells were seeded in tissue culture dishes. Peptide 16 (5 μg/mL), peptide 16AC (5 μg/mL), and heparanase inhibitory peptide 7 (50 μg/mL) were added to the cells. Cells were incubated for 30 minutes at 37 ºC, following collection of the medium. A strong band at 65 kDa was identified in the peptides 16 and 16AC lanes (right panel). A mild reduction in heparanase levels was observed with peptide 7 compared with control (left panel). Levels of heparanase were evaluated using densitometry analysis (upper panel). The assay was performed in triplicate. The results are presented as the mean and range. ∗P < .05. (B) Immunostaining assay. Peptide 16 or 16AC (5 μg/ml) was added to U87 heparanase overexpressing cells at 37 ºC for 30 minutes, and cells were fixed using 4% formaldehyde as described in the Methods section. A significant reduction in the heparanase level was observed in the cells treated with the procoagulant peptides. (C) Peptide 16 or 16AC (5 μg/mL) was added to U87 cells and compared with control cells after overnight incubation at 37 ºC. Immunostaining revealed a significant increase in heparanase, TF, TFPI, and TFPI-2 levels in the treated cells compared with controls. Nuclear staining was observed in heparanase. Representative images were visualized at × 50 magnification, with a 0.82 MDC objective lens, captured with a Nikon E995 digital camera (Nikon), and processed with Adobe Photoshop software (Adobe Systems).
Figure 1
Figure 1
Procoagulant peptides stimulate a significant release of heparanase from tumor cells and upregulate the expression of heparanase, tissue factor (TF), tissue factor pathway inhibitor (TFPI), and tissue factor pathway inhibitor-2 (TFPI-2). (A) Western blot analysis. U87 heparanase overexpressing cells were seeded in tissue culture dishes. Peptide 16 (5 μg/mL), peptide 16AC (5 μg/mL), and heparanase inhibitory peptide 7 (50 μg/mL) were added to the cells. Cells were incubated for 30 minutes at 37 ºC, following collection of the medium. A strong band at 65 kDa was identified in the peptides 16 and 16AC lanes (right panel). A mild reduction in heparanase levels was observed with peptide 7 compared with control (left panel). Levels of heparanase were evaluated using densitometry analysis (upper panel). The assay was performed in triplicate. The results are presented as the mean and range. ∗P < .05. (B) Immunostaining assay. Peptide 16 or 16AC (5 μg/ml) was added to U87 heparanase overexpressing cells at 37 ºC for 30 minutes, and cells were fixed using 4% formaldehyde as described in the Methods section. A significant reduction in the heparanase level was observed in the cells treated with the procoagulant peptides. (C) Peptide 16 or 16AC (5 μg/mL) was added to U87 cells and compared with control cells after overnight incubation at 37 ºC. Immunostaining revealed a significant increase in heparanase, TF, TFPI, and TFPI-2 levels in the treated cells compared with controls. Nuclear staining was observed in heparanase. Representative images were visualized at × 50 magnification, with a 0.82 MDC objective lens, captured with a Nikon E995 digital camera (Nikon), and processed with Adobe Photoshop software (Adobe Systems).
Figure 2
Figure 2
Procoagulant peptides induce tumor cell proliferation. (A) T47D cells (5 × 103 cells/well) were seeded in a 96-well plate. Peptides 16 (P16) and 16AC (P16AC) (5 μg/mL, 10 μg/mL) were added to the cells. Following incubation at 37 ºC for 48 hours, the XTT assay was performed as described in the Methods section. A significant increase in cell proliferation was observed in the cells exposed to P16 or P16AC. Similar results were obtained when the study was performed in 2 additional tumor cell lines: U87 (B) and MCF-7 (C). Subsequently, T47D (D), U87 (E), and MCF-7 (F) cells were seeded in a 96-well plate (5 × 103 cells/well). Peptide 7 (P7) inhibiting the heparanase-TF complex (50 μg/mL) was added to the cells for 1 hour, followed by the addition of P16 or P16AC (5 μg/mL). After incubation at 37 ºC for 48 hours, the XTT assay was performed. A significant reduction in cell proliferation was observed when P7 was added to P16 or P16AC (P < .05). All assays were performed in triplicate. The results are presented as the mean and range. ∗P < .05.
Figure 2
Figure 2
Procoagulant peptides induce tumor cell proliferation. (A) T47D cells (5 × 103 cells/well) were seeded in a 96-well plate. Peptides 16 (P16) and 16AC (P16AC) (5 μg/mL, 10 μg/mL) were added to the cells. Following incubation at 37 ºC for 48 hours, the XTT assay was performed as described in the Methods section. A significant increase in cell proliferation was observed in the cells exposed to P16 or P16AC. Similar results were obtained when the study was performed in 2 additional tumor cell lines: U87 (B) and MCF-7 (C). Subsequently, T47D (D), U87 (E), and MCF-7 (F) cells were seeded in a 96-well plate (5 × 103 cells/well). Peptide 7 (P7) inhibiting the heparanase-TF complex (50 μg/mL) was added to the cells for 1 hour, followed by the addition of P16 or P16AC (5 μg/mL). After incubation at 37 ºC for 48 hours, the XTT assay was performed. A significant reduction in cell proliferation was observed when P7 was added to P16 or P16AC (P < .05). All assays were performed in triplicate. The results are presented as the mean and range. ∗P < .05.
Figure 3
Figure 3
Heparanase procoagulant peptides increase the level of heparanase, tissue factor (TF), tissue factor pathway inhibitor (TFPI), and tissue factor pathway inhibitor-2 (TFPI-2) and induce cell proliferation in human umbilical vein endothelial cells (HUVECs). (A) Immunostaining assay. Peptide 16AC (P16AC; 5 μg/mL) was added to HUVECs and compared with control cells. After overnight incubation at 37 ºC, the cells were fixed using 4% formaldehyde and immunostained. Levels of heparanase, TF, TFPI, and TFPI-2 were significantly higher in the treated cells. Representative images were visualized at × 50 magnification, with a 0.82 MDC objective lens, captured with a Nikon E995 digital camera (Nikon), and processed with Adobe Photoshop software (Adobe Systems). The contingency table (lower panel) shows the staining intensity in the HUVECs. Significance was determined by the Mann–Whitney U-test. (B) Heparanase procoagulant peptides induce HUVEC proliferation. HUVECs were seeded in a 96-well plate (5 × 103 cells/well). Heparanase procoagulant peptides 16 (P16) and P16AC (2.5 μg/mL, 5 μg/mL) were added at increasing concentrations to the cells. After 48 hours, a significant increase in cell proliferation was observed using the XTT assay. ∗P < .05. (C) Inhibition of heparanase-TF complex impedes proliferation in HUVECs. A similar experiment is described in B, but 50 ng/mL of heparanase inhibitory peptide 7 (P7) was added to the cells for 1 hour prior to the addition of P16 (5 μg/mL) or P16AC (5 μg/mL). P7 significantly inhibited the proliferative effect of P16 and P16AC.
Figure 3
Figure 3
Heparanase procoagulant peptides increase the level of heparanase, tissue factor (TF), tissue factor pathway inhibitor (TFPI), and tissue factor pathway inhibitor-2 (TFPI-2) and induce cell proliferation in human umbilical vein endothelial cells (HUVECs). (A) Immunostaining assay. Peptide 16AC (P16AC; 5 μg/mL) was added to HUVECs and compared with control cells. After overnight incubation at 37 ºC, the cells were fixed using 4% formaldehyde and immunostained. Levels of heparanase, TF, TFPI, and TFPI-2 were significantly higher in the treated cells. Representative images were visualized at × 50 magnification, with a 0.82 MDC objective lens, captured with a Nikon E995 digital camera (Nikon), and processed with Adobe Photoshop software (Adobe Systems). The contingency table (lower panel) shows the staining intensity in the HUVECs. Significance was determined by the Mann–Whitney U-test. (B) Heparanase procoagulant peptides induce HUVEC proliferation. HUVECs were seeded in a 96-well plate (5 × 103 cells/well). Heparanase procoagulant peptides 16 (P16) and P16AC (2.5 μg/mL, 5 μg/mL) were added at increasing concentrations to the cells. After 48 hours, a significant increase in cell proliferation was observed using the XTT assay. ∗P < .05. (C) Inhibition of heparanase-TF complex impedes proliferation in HUVECs. A similar experiment is described in B, but 50 ng/mL of heparanase inhibitory peptide 7 (P7) was added to the cells for 1 hour prior to the addition of P16 (5 μg/mL) or P16AC (5 μg/mL). P7 significantly inhibited the proliferative effect of P16 and P16AC.
Figure 4
Figure 4
Procoagulant peptides upregulate the expression and enhance heparanase secretion, tissue factor (TF), tissue factor pathway inhibitor-1 (TFPI-1), and tissue factor pathway inhibitor-2 (TFPI-2) in the wound-healing model. Our previous study showed that the procoagulant peptides accelerated wound healing [9]. In the current model, a full-thickness skin incision of 10 mm was made in the back skin of ICR mice (with no specific genetic background). On days 1, 3, and 5, peptide 16, peptide 16AC, or the vehicle (phosphate-buffered saline) were injected subcutaneously opposite the wound at a dose of 225 μg/kg. On day 7, mice were sacrificed, and the wound skin was analyzed by immunostaining. A significant increase in the expression of heparanase, TF, TFPI-1, and TFPI-2 was observed, either directly induced by the peptides or as part of the wound-healing process. Increased staining was most prominent in the small blood vessel wall and lumen of the subcutis tissue. Representative images were visualized at × 50 magnification, with a 0.82 MDC objective lens, captured with a Nikon E995 digital camera (Nikon), and processed with Adobe Photoshop software (Adobe Systems).
Figure 5
Figure 5
Tissue factor (TF) conveys intracellular signaling induced by heparinase-derived peptides. HEK-293 cells stably transfected to overexpress full-length TF or TF devoid of the cytoplasmic domain (ΔTF) were transiently transfected to overexpress heparinase and compared with empty plasmid transfected cells (Vo, vector only; control). Twenty-four hours posttransfection, cells were washed twice with phosphate-buffered saline, and either peptide 16 or peptide 16AC (2.5 μg/mL) was added to the serum-free media for overnight incubation. (A) Peptide 16AC derived from the heparinase procoagulant domain increased p-p38 intracellular signaling in cells overexpressing TF compared with cells overexpressing TF devoid of the intracellular part (ΔTF), indicating that heparinase activates intracellular signaling via TF. (B) The heparinase release, induced by peptides 16 and 16AC, was more prominent in the cells overexpressing TF than in those overexpressing ΔTF, indicating that the release is mediated by TF. Levels of p-p38 or heparinase in the Western blot were evaluated using densitometry analysis (upper panel). Assays were performed in triplicate. The results are presented as the mean and range. ∗P < .05.
Figure 6
Figure 6
Thrombin induces heparinase release from tumor cells. (A) Western blot analysis. U87 heparanase overexpressing cells were seeded in tissue culture dishes and incubated with 1 unit/mL of thrombin, 5.5 μg/mL (1 μM) of ATP, 5 μg/mL of peptide 16, and 5 μg/mL of peptide 16AC at 37 ºC for 30 minutes. Forty μl of sample medium were loaded on the gel. Compared with the control lane, a strong band at 65 kDa was observed in the thrombin, ATP, 16, and 16AC lanes. Levels of heparinase were evaluated using densitometry analysis (upper panel). The assay was performed in triplicate. The results are presented as the mean and range. ∗P < .05. (B) Immunostaining assay. One unit/mL of thrombin or 5.5 μg/mL (1 μM) of ATP was added to U87 heparanase overexpressing cells and compared with the control. The cells were incubated at 37 ºC for 30 minutes and then fixed using 4% formaldehyde, as described in the Methods section. A significant reduction in the cell heparanase content was observed in treated cells. Similar results were obtained using MCF-7 heparanase overexpressing cells. Representative images were visualized at × 50 magnification, with a 0.82 MDC objective lens, captured with a Nikon E995 digital camera (Nikon), and processed with Adobe Photoshop software (Adobe Systems).
Figure 7
Figure 7
PAR-1 and PAR-2 are not involved in the thrombin-mediated release of heparanase. (A) Western blot analysis. U87 heparanase overexpressing cells (4 × 105/plate) were seeded in dishes. When cells reached 80% confluence, PAR-1 antagonist (SCH 530348, vorapaxar; 0.5 μM and 1 μM) was added for 10 minutes, followed by the addition of thrombin (1 unit/mL) for 20 minutes. TRAP-6, a direct PAR-1 activator (1 μM), was also tested. The medium was collected, and 40 μL of samples were loaded on the gel. A strong band at 65 kDa was observed in all the lanes compared with the baseline level observed in the control. (B) Similar to the experiment described in A, T47D heparanase overexpressing cells were incubated with PAR-1 antagonist (FR) (FR 171113, 0.05 μM) and/or PAR-2 antagonist (FS) (FSLLRY-NH2, 0.05μM) for 10 minutes, followed by the addition of thrombin (1 unit/mL) for 20 minutes. TRAP-6, a direct PAR-1 activator (2 μM), was also tested. The medium was collected, and 40 μL of samples were loaded on the gel. A strong band at 65 kDa was observed in all the lanes compared with the control, indicating that neither PAR-1 nor PAR-2 is involved in heparanase release in this cell line. Levels of heparanase in the Western blot were evaluated using densitometry analysis (upper panel). The assay was performed in triplicate. The results are presented as the mean and range. ∗P < .05.
Figure 8
Figure 8
Thrombin-related increase in tumor cell proliferation is mediated by heparanase. T47D (A), U87 (B), and MCF-7 (C) cells were seeded in a 96-well plate (5 × 103 cells/well) with or without thrombin (T) (0.5 unit/mL, 1 unit/mL). After incubation at 37 ºC for 48 hours, the XTT test was performed. A significant increase in cell proliferation was observed in the cells exposed to T compared to control (∗P < .05). All assays were done in triplicates. The result represents mean and range. Subsequently, T47D (D), U87 (E), and MCF-7 (F) cells were seeded in a 96-well plate (5 × 103 cells/well). Fifty μg/mL of the peptide inhibiting heparanase-TF complex (P7) were added to the cells for 1 hour, followed by the addition of T (1 unit/mL). After incubation at 37 ºC for 48 hours, the XTT assay was performed. A significant reduction in cell proliferation was observed when P7 was added to T (∗P < .05). All assays were performed in triplicate. The results are presented as the mean and range.

References

    1. Freeman C., Parish C.R. Human platelet heparanase: purification, characterization and catalytic activity. Biochem J. 1998;330:1341–1350. - PMC - PubMed
    1. Pikas D.S., Li J.P., Vlodavsky I., Lindahl U. Substrate specificity of heparanases from human hepatoma and platelets. J Biol Chem. 1998;273:18770–18777. - PubMed
    1. Parish C.R., Freeman C., Hulett M.D. Heparanase: a key enzyme involved in cell invasion. Biochim Biophys Acta. 2001;1471:M99–M108. - PubMed
    1. Vlodavsky I., Friedmann Y. Molecular properties and involvement of heparanase in cancer metastasis and angiogenesis. J Clin Invest. 2001;108:341–347. - PMC - PubMed
    1. Nadir Y., Brenner B., Zetser A., Ilan N., Shafat I., Zcharia E., Goldshmidt O., Vlodavsky I. Heparanase induces tissue factor expression in vascular endothelial and cancer cells. J Thromb Haemost. 2006;4:2443–2451. - PubMed

LinkOut - more resources