. 2023 Sep 11:14:1151422.
doi: 10.3389/fimmu.2023.1151422. eCollection 2023.

Cystic fibrosis autoantibody signatures associate with Staphylococcus aureus lung infection or cystic fibrosis-related diabetes

Affiliations

Cystic fibrosis autoantibody signatures associate with Staphylococcus aureus lung infection or cystic fibrosis-related diabetes

Ruchi Yadav et al. Front Immunol. .

Abstract

Introduction: While cystic fibrosis (CF) lung disease is characterized by persistent inflammation and infections and chronic inflammatory diseases are often accompanied by autoimmunity, autoimmune reactivity in CF has not been studied in depth.

Methods: In this work we undertook an unbiased approach to explore the systemic autoantibody repertoire in CF using autoantibody microarrays.

Results and discussion: Our results show higher levels of several new autoantibodies in the blood of people with CF (PwCF) compared to control subjects. Some of these are IgA autoantibodies targeting neutrophil components or autoantigens linked to neutrophil-mediated tissue damage in CF. We also found that people with CF with higher systemic IgM autoantibody levels have lower prevalence of S. aureus infection. On the other hand, IgM autoantibody levels in S. aureus-infected PwCF correlate with lung disease severity. Diabetic PwCF have significantly higher levels of IgA autoantibodies in their circulation compared to nondiabetic PwCF and several of their IgM autoantibodies associate with worse lung disease. In contrast, in nondiabetic PwCF blood levels of IgA autoantibodies correlate with lung disease. We have also identified other autoantibodies in CF that associate with P. aeruginosa airway infection. In summary, we have identified several new autoantibodies and associations of autoantibody signatures with specific clinical features in CF.

Keywords: CF-related diabetes; CFRD; Staphylococcus aureus; autoantibody signature; autoimmunity; cystic fibrosis.


Conflict of interest statement

The authors declare that the research was conducted in the absence of any commercial or financial relationships that could be construed as a potential conflict of interest.

Figures

Figure 1
Figure 1
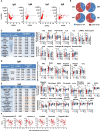
The overall systemic autoantibody landscape in cystic fibrosis. Sera obtained from 34 PwCF, 26 healthy control subjects (HC), 9 RA and 10 SLE patients were subjected to autoantibody microarray analysis. Total autoantibody scores were calculated for each subject, each Ig class and citrullinated or non-citrullinated autoantigens by adding up all the individual fluorescent values of the 117 autoantibodies tested. Each dot represents a separate subject. One-way ANOVA and Kruskal-Wallis test. AU, arbitrary unit; ns, non-significant. *, p<0.05; **, p<0.01; ***, p<0.001.
Figure 2
Figure 2
Specific autoantibodies are elevated in CF. (A) PwCF and HCs were compared for each autoantibody in each Ig class and the p-value of their difference (Y-axis) was plotted against the ratio of their average values in CF over HC cohorts (CF/HC, X-axis). Each dot represents an autoantibody. Vertical dotted lines indicate a ratio of 1 corresponding to no difference between the two cohorts. Autoantibodies with elevated blood levels in CF compared to HCs are on the right side of this line. Horizontal dotted lines indicate p=0.05, the level of significance. P-values are presented on the Y-axis on a log10-based scale in a reverse order. Autoantibodies with significant differences between CF and HC cohorts are above the horizontal line while non-significant differences are shown below. CF and HC values were compared by Mann-Whitney test. (B) The 117 autoantibodies measured for each Ig class were split into two groups: 1) those that are higher in CF (blue), and 2) those that are lower in CF (red), compared to HCs. The average values in the CF cohort were compared to the average values of the HC cohort. (C) IgG autoantibodies are listed in the table that have significantly different levels in PwCF compared to HCs and ranked from higher to lower. The CF/HC ratio was calculated based on dividing the average CF value with the average HC value. The first p-value (fourth column from the left) was calculated by Mann-Whitney test for the difference between CF and HC cohorts. Spearman correlation coefficient (r) was calculated between autoantibody levels and lung function (FEV1%pred) in the CF cohort for the indicated autoantibodies. The significance of the correlation is indicated in the last column on the right side of the table. The raw fluorescence data are presented for each autoantibody among the four patient cohorts. Each dot represents a separatesubject. (D) IgM and (E) IgA autoantibodies with significantly different levels between CF and HC cohorts are presented and analyzed the same way as IgG autoantibodies above. Autoantibodies labelled in orange boxes have significant correlation with the severity of CF lung disease. (F) IgA autoantibodies with significant negative correlation with CF lung function are shown. Spearman correlation. Each dot represents a separate CF subject. *, p<0.05; **, p<0.01. AU, arbitrary unit; CF, cystic fibrosis; HC, healthy controls; Rheumatoid arthritis; SLE, systemic lupus erythematosus.
Figure 3
Figure 3
Association of S. aureus respiratory infection with a unique IgM autoantibody signature in cystic fibrosis. (A) Total IgG, IgM and IgA autoantibody scores were calculated for each subject by summing up the fluorescence values of all 117 autoantibodies and compared between healthy controls (HC, blue), S. aureus-negative (SA- CF, purple) and S. aureus-positive (SA+ CF, red) CF cohorts. One-way ANOVA, Kruskal-Wallis test. (B) The 117 autoantibodies measured for each indicated Ig class were split into four groups based on their average values and the significance of their differences between SA- and SA+ PwCF: 1) significantly lower in SA+ CF (dark blue), 2) non-significantly lower in SA+ CF (light blue), 3) non-significantly higher in SA+ CF (yellow), and 4) significantly higher in SA+ CF (red), compared to SA- PwCF. (C) SA- and SA+ PwCF were compared for each autoantibody in each indicated Ig class and the p-value of their difference (Y-axis) was plotted against the ratio of their average values in SA+ CF over SA- CF cohorts (SA+/SA-, X-axis). Each dot represents an autoantibody. Vertical dotted lines indicate a ratio of 1 corresponding to no difference between the two cohorts. Autoantibodies with elevated blood levels in SA+ CF compared to SA- CF are on the right side of this line. Horizontal dotted lines indicate p=0.05, the level of significance. P-values are presented on the Y-axis on a log10-based scale in a reverse order. Autoantibodies with significant differences between SA+ and SA- CF cohorts are above the horizontal line while non-significant differences are shown below. SA+ and SA- CF values were compared by Mann-Whitney test. (D) IgM autoantibodies are listed in the table that have significantly different levels in SA+ PwCF compared to SA- PwCF and ranked from higher to lower. The SA-/SA+ ratio was calculated based on dividing the average SA- CF value with the average SA+ CF value for each IgM autoantibody. The p-value was calculated by Mann-Whitney test for the difference between SA- and SA+ CF cohorts. *, p<0.05. MLR, multiple linear regression analysis; ns, non-significant; SA, Staphylococcus aureus; CF, cystic fibrosis; HC, healthy control; FEV, forced expiratory volume; AU, arbitrary unit.
Figure 4
Figure 4
The IgM autoantibody score correlates with lung disease in S. aureus-positive PwCF. (A) For each SA+ CF subject the total IgM autoantibody score was calculated (X-axis) and correlated with lung function (FEV1%pred, Y-axis) (Spearman correlation coefficient). (B) For each IgM autoantibody correlation coefficients were calculated with CF lung function (FEV1%pred) and plotted against each other in the SA- (X-axis) and SA+ (Y-axis) CF cohorts. Each dot represents an IgM autoantibody. The top 7 IgM autoantibodies are C) ranked in the table according to their descending Spearman correlation coefficient values with CF lung function (FEV1%pred) in SA+ PwCF and D) their correlation data are shown. **, p<0.01. SA, Staphylococcus aureus; CF, cystic fibrosis; HC, healthy control; FEV1, forced expiratory volume; AU, arbitrary unit.
Figure 5
Figure 5
Cystic fibrosis-related diabetes is associated with an elevated systemic IgA autoantibody profile. (A) Total IgA, IgG and IgM autoantibody scores were calculated for each subject by summing up the fluorescence values of all 117 autoantibodies and compared between healthy controls (HC, blue), diabetic PwCF (CFRD+, red) and nondiabetic PwCF (CFRD-, purple). Each dot represents a human subject. One-way ANOVA, Kruskal-Wallis test. (B) CFRD- and CFRD+ PwCF were compared for each autoantibody in each indicated Ig class and the p-value of their difference (Y-axis) was plotted against the ratio of their average values in CFRD+ CF over CFRD- CF cohorts (CFRD+/CFRD-, X-axis). Each dot represents an autoantibody. Vertical dotted lines indicate a ratio of 1 corresponding to no difference between the two cohorts. Autoantibodies with elevated blood levels in CFRD+ compared to CFRD- are on the right side of this line. Horizontal dotted lines indicate p=0.05, the level of significance. P-values are presented on the Y-axis on a log10-based scale in a reverse order. Autoantibodies with significant differences between CFRD+ and CFRD- CF cohorts are above the horizontal line while non-significant differences are shown below. CFRD+ and CFRD- CF values were compared by Mann-Whitney test. (C) The 117 autoantibodies measured for each indicated Ig class were split into four groups based on their average values and the significance of their differences between CFRD- and CFRD+ PwCF: 1) significantly lower in CFRD+ CF (dark blue), 2) non-significantly lower in CFRD+ CF (light blue), 3) non-significantly higher in CFRD+ CF (yellow), and 4) significantly higher in CFRD+ CF (red), compared to CFRD- PwCF. *, p<0.05. Ns, non-significant; CF, cystic fibrosis; CFRD, CF-related diabetes; HC, healthy control; AU, arbitrary unit.

References

    1. Guo J, Garratt A, Hill A. Worldwide rates of diagnosis and effective treatment for cystic fibrosis. J Cyst Fibros (2022) 21(3):456–62. doi: 10.1016/j.jcf.2022.01.009 - DOI - PubMed
    1. Jia S, Taylor-Cousar JL. Cystic fibrosis modulator therapies. Annu Rev Med (2023) 74:413–26. doi: 10.1146/annurev-med-042921-021447 - DOI - PubMed
    1. Bojanowski CM, Lu S, Kolls JK. Mucosal immunity in cystic fibrosis. J Immunol (2021) 207(12):2901–12. doi: 10.4049/jimmunol.2100424 - DOI - PMC - PubMed
    1. Moss RB. Mucosal humoral immunity in cystic fibrosis - a tangled web of failed proteostasis, infection and adaptive immunity. EBioMedicine (2020) 60:103035. doi: 10.1016/j.ebiom.2020.103035 - DOI - PMC - PubMed
    1. Conese M, Di Gioia S. Pathophysiology of lung disease and wound repair in cystic fibrosis. Pathophysiology (2021) 28(1):155–88. doi: 10.3390/pathophysiology28010011 - DOI - PMC - PubMed

Publication types