. 2023 Nov 1;135(5):1012-1022.
doi: 10.1152/japplphysiol.00267.2023. Epub 2023 Sep 28.

Increased intrapulmonary shunt and alveolar dead space post-COVID-19

Affiliations

Increased intrapulmonary shunt and alveolar dead space post-COVID-19

Catherine E Farrow et al. J Appl Physiol (1985). .

Abstract

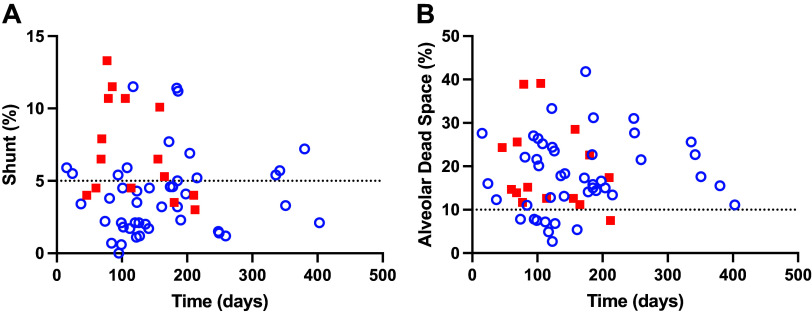
Increased intrapulmonary shunt (QS/Qt) and alveolar dead space (VD/VT) are present in early recovery from 2019 Novel Coronavirus (COVID-19). We hypothesized patients recovering from severe critical acute illness (NIH category 3-5) would have greater and longer lasting increased QS/Qt and VD/VT than patients with mild-moderate acute illness (NIH 1-2). Fifty-nine unvaccinated patients (33 males, aged 52 [38-61] yr, body mass index [BMI] 28.8 [25.3-33.6] kg/m2; median [IQR], 44 previous mild-moderate COVID-19, and 15 severe-critical disease) were studied 15-403 days postacute severe acute respiratory syndrome coronavirus infection. Breathing ambient air, steady-state mean alveolar Pco2, and Po2 were recorded simultaneously with arterial Po2/Pco2 yielding aAPco2, AaPo2, and from these, QS/Qt%, VD/VT%, and relative alveolar ventilation (40 mmHg/[Formula: see text], VArel) were calculated. Median [Formula: see text] was 39.4 [35.6-41.1] mmHg, [Formula: see text] 92.3 [87.1-98.2] mmHg; [Formula: see text] 32.8 [28.6-35.3] mmHg, [Formula: see text] 112.9 [109.4-117.0] mmHg, AaPo2 18.8 [12.6-26.8] mmHg, aAPco2 5.9 [4.3-8.0] mmHg, QS/Qt 4.3 [2.1-5.9] %, and VD/VT16.6 [12.6-24.4]%. Only 14% of patients had normal QS/Qt and VD/VT; 1% increased QS/Qt but normal VD/VT; 49% normal QS/Qt and elevated VD/VT; 36% both abnormal QS/Qt and VD/VT. Previous severe critical COVID-19 predicted increased QS/Qt (2.69 [0.82-4.57]% per category severity [95% CI], P < 0.01), but not VD/VT. Increasing age weakly predicted increased VD/VT (1.6 [0.1-3.2]% per decade, P < 0.04). Time since infection, BMI, and comorbidities were not predictors (all P > 0.11). VArel was increased in most patients. In our population, recovery from COVID-19 was associated with increased QS/Qt in 37% of patients, increased VD/VT in 86%, and increased alveolar ventilation up to ∼13 mo postinfection. NIH severity predicted QS/Qt but not elevated VD/VT. Increased VD/VT suggests pulmonary microvascular pathology persists post-COVID-19 in most patients.NEW & NOTEWORTHY Using novel methodology quantifying intrapulmonary shunt and alveolar dead space in COVID-19 patients up to 403 days after acute illness, 37% had increased intrapulmonary shunt and 86% had elevated alveolar dead space likely due to independent pathology. Elevated shunt was partially related to severe acute illness, and increased alveolar dead space was weakly related to increasing age. Ventilation was increased in the majority of patients regardless of previous disease severity. These results demonstrate persisting gas exchange abnormalities after recovery.

Keywords: alveolar dead space; hyperventilation; intrapulmonary shunt; post-COVID-19; ventilation perfusion mismatch.


Conflict of interest statement

A.M. has received consulting fees for medical education from Livanova, Eli Lilly, Zoll, and Jazz. ResMed provided a philanthropic donation to UCSD. P.D.W. has received consulting fees from SMS Biotechnology and Third pole inc. G. Prisk is an editor of Journal of Applied Physiology and was not involved and did not have access to information regarding the peer-review process or final disposition of this article. An alternate editor oversaw the peer-review and decision-making process for this article. None of the other authors has any conflicts of interest, financial or otherwise, to disclose.

Figures

None
Graphical abstract
Figure 1.
Figure 1.
Alveolar-arterial differences for Po2 (AaPo2) and Pco2 (aAPco2) across the indicated combinations of shunt and dead space, each from 0 to 50%. The grid can be used to estimate both shunt and alveolar dead space for any combination of AaPo2 and aAPco2. Note that the position of each point on the grid is dependent on a number of ancillary variables including pH, Hb, Hb P50, temperature, base excess, V̇e, cardiac output, V̇co2, and V̇o2, with all except cardiac output and Hb P50 automatically available from either the expired gas or arterial blood samples used to measure AaPo2 and aAPco2. Reproduced by editorial request, and modified from Wagner et al. (10). aAPco2, arterial- alveolar partial pressure difference for carbon dioxide; AaPo2, alveolar-arterial partial pressure difference for oxygen; V̇o2, oxygen consumption in L/min; V̇co2, carbon dioxide production in L/min.
Figure 2.
Figure 2.
Individual data for 59 post-COVID-19 patients NIH 1-2 (44 patients with low-medium severity, open blue circles) and NIH 3-5 (15 patients with severe-critical severity, enclosed red squares) for arterial Po2 (A), arterial Pco2 (B), alveolar Po2 (C), and alveolar CO2 (D). **P < 0.005 compared to low-medium severity. Black horizontal line represents median value. COVID-19, 2019 Novel Coronavirus; NIH, National Institutes of Health.
Figure 3.
Figure 3.
Individual data for 59 post-COVID-19 patients NIH 1-2 (44 patients, low-medium severity, open blue symbols) and NIH 3-5 (15 patients, severe-critical severity, closed red squares) showing AaPo2 mmHg (A), aAPco2 mmHg (B), shunt (C), and alveolar dead space (D). **P < 0.008 compared to low-medium severity. Black horizontal line represents median values, dotted lines represent 95% confidence levels for shunt (5%), and alveolar dead space (10%) from healthy subjects (11). aAPco2, arterial- alveolar partial pressure difference for carbon dioxide; AaPo2, alveolar-arterial partial pressure difference for oxygen; COVID-19, 2019 Novel Coronavirus; NIH, National Institutes of Health.
Figure 4.
Figure 4.
Individual data from 7 healthy subjects (closed black triangles; A and C) and for 59 post-COVID-19 patients (B and D) NIH severity 1–2 (44 patients; open blue circles) and NIH severity 3–5 (15 patients; closed red squares) showing: measured AaPo2 mmHg and aAPco2 mmHg (A and B) and calculated shunt and alveolar dead space values (C and D). Dotted lines represent 95% confidence levels for shunt (5%), and alveolar dead space (10%) from healthy subjects (11). Note that the healthy subjects’ data lie within, or close to, the 95% confidence levels, indicating technical adequacy of the AaPo2 and aAPco2 measurements. aAPco2, arterial- alveolar partial pressure difference for carbon dioxide; AaPo2, alveolar-arterial partial pressure difference for oxygen; COVID-19, 2019 Novel Coronavirus; NIH, National Institutes of Health.
Figure 5.
Figure 5.
Individual data for 59 subjects for Bohr-Enghoff dead space [calculated as (PaCO2PECO2PaCO2)× 100] plotted against measured alveolar dead space as described in the text (A) and AaPo2 from the standard alveolar gas equation, where PAO2 = PIO2 PaCO2/R + PaCO2 × FIO2 × (1−R)/R plotted against AaPo2 using measured PAO2 as described in the text (B). Lines of identity are in red, linear regression lines in black. Note that Bohr-Enghoff dead space measurements are much greater than the measured alveolar dead space measurement and AaO2 gradient calculation underestimates the true AaO2 gradient. AaPo2, alveolar-arterial partial pressure difference for oxygen; FIO2, fraction of inspired oxygen; PaCO2, partial pressure of arterial carbon dioxide; PAO2, partial pressure of alveolar oxygen; PIO2, partial pressure of inspired oxygen.
Figure 6.
Figure 6.
Individual data for 59 post-COVID-19 patients for shunt (A) and alveolar dead space (B) plotted against time since acute SARS-CoV-2 infection for post-COVID-19 patients with low-medium severity (44 patients, NIH-1 and 2, open blue circles) and severe-critical severity (15 patients, NIH-3-5, closed red squares). Dotted lines represent 95% confidence levels for shunt (5%), and alveolar dead space (10%) from healthy subjects (11). COVID-19, 2019 Novel Coronavirus; NIH, National Institutes of Health.
Figure 7.
Figure 7.
Individual data for 59 post-COVID patients NIH severity 1–2 (44 patients, open blue circles), and NIH severity 3–5 (15 patients, closed red squares) and methodological controls (7 subjects, black triangles) for relative ventilation plotted against PaO2 (A), intrapulmonary shunt (B), PaCO2 (C), alveolar dead space (D), and PaCO2 plotted against alveolar dead space (E). For comparison in A, historical data from healthy controls for Wagner et al. [closed black circles (19)], Torre-Bueno et al. [open black circles (21)] and Hammond et al. [closed black squares (20)] are also plotted. Vertical line 5% shunt (B), PaCO2= 40 mmHg (C), 10% alveolar dead space (D), PaCO2= 40 mmHg (E). Curved lines in C represents VArel = 40/PaCO2, VArel = 40/(PaCO2 − 5), and VArel = 40/(PaCO2 − 10) if PACO2 = PaCO2, and horizonal line is at VArel= 1.0. Horizontal line in E is at alveolar dead space = 10%. COVID-19, 2019 Novel Coronavirus; NIH, National Institutes of Health; PaCO2, partial pressure of arterial carbon dioxide; PACO2, partial pressure of alveolar carbon dioxide; PaO2, partial pressure of arterial oxygen; VArel, 40/PACO2= relative alveolar ventilation.

References

    1. Zhu N, Zhang D, Wang W, Li X, Yang B, Song J, Zhao X, Huang B, Shi W, Lu R, Niu P, Zhan F, Ma X, Wang D, Xu W, Wu G, Gao GF, Tan W; China Novel Coronavirus Investigating and Research Team. A novel coronavirus from patients with pneumonia in China, 2019. N Engl J Med 382: 727–733, 2020. doi:10.1056/NEJMoa2001017. - DOI - PMC - PubMed
    1. Habashi NM, Camporota L, Gatto LA, Nieman G. Functional pathophysiology of SARS-CoV-2-induced acute lung injury and clinical implications. J Appl Physiol (1985) 130: 877–891, 2021. doi:10.1152/japplphysiol.00742.2020. - DOI - PMC - PubMed
    1. Harbut P, Prisk GK, Lindwall R, Hamzei S, Palmgren J, Farrow CE, Hedenstierna G, Amis TC, Malhotra A, Wagner PD, Kairaitis K. Intrapulmonary shunt and alveolar dead space in a cohort of patients with acute COVID-19 pneumonitis and early recovery. Eur Respir J 61: 2201117, 2023. doi:10.1183/13993003.02287-2022. - DOI - PMC - PubMed
    1. Huang C, Wang Y, Li X, Ren L, Zhao J, Hu Y, Zhang L, Fan G, Xu J, Gu X, Cheng Z, Yu T, Xia J, Wei Y, Wu W, Xie X, Yin W, Li H, Liu M, Xiao Y, Gao H, Guo L, Xie J, Wang G, Jiang R, Gao Z, Jin Q, Wang J, Cao B. Clinical features of patients infected with 2019 novel coronavirus in Wuhan, China. Lancet 395: 497–506, 2020. doi:10.1016/S0140-6736(20)30183-5. - DOI - PMC - PubMed
    1. Tarraso J, Safont B, Carbonell-Asins JA, Fernandez-Fabrellas E, Sancho-Chust JN, Naval E, Amat B, Herrera S, Ros JA, Soler-Cataluña JJ, Rodriguez-Portal JA, Andreu AL, Marín M, Rodriguez-Hermosa JL, Gonzalez-Villaescusa C, Soriano JB, Signes-Costa J; COVID-FIBROTIC study team. Lung function and radiological findings 1 year after COVID-19: a prospective follow-up. Respir Res 23: 242, 2022. doi:10.1186/s12931-022-02166-8. - DOI - PMC - PubMed

Publication types

LinkOut - more resources