. 2023 Dec 1;325(6):F717-F732.
doi: 10.1152/ajprenal.00161.2023. Epub 2023 Sep 28.

Mild dehydration effects on the murine kidney single-nucleus transcriptome and chromatin accessibility

Affiliations

Mild dehydration effects on the murine kidney single-nucleus transcriptome and chromatin accessibility

Nha Van Huynh et al. Am J Physiol Renal Physiol. .

Erratum in

Abstract

Daily, we may experience mild dehydration with a rise in plasma osmolality that triggers the release of vasopressin. Although the effect of dehydration is well characterized in collecting duct principal cells (CDPCs), we hypothesized that mild dehydration (<12 h) results in many kidney cell-specific changes in transcriptomes and chromatin accessibility. Single-nucleus (sn) multiome (RNA-assay for transposase-accessible chromatin) sequencing and bulk RNA sequencing of kidneys from male and female mice that were mildly water deprived or not were compared. Water-deprived mice had a significant increase in plasma osmolality. sn-multiome-seq resulted in 19,837 nuclei that were annotated into 33 clusters. In CDPCs, aquaporin 2 (Aqp2) and aquaporin 3 (Apq3) were greater in dehydrated mice, but there were novel genes like gremlin 2 (Grem2; a cytokine) that were increased compared with ad libitum mice. The transcription factor cAMP-responsive element modulator (Crem) was greater in CDPCs of dehydrated mice, and the Crem DNA motif was more accessible. There were hundreds of sex- and dehydration-specific differentially expressed genes (DEGs) throughout the kidney, especially in the proximal tubules and thin limbs. In male mice, DEGs were enriched in pathways related to lipid metabolism, whereas female DEGs were enriched in organic acid metabolism. Many highly expressed genes had a positive correlation with increased chromatin accessibility, and mild dehydration exerted many transcriptional changes that we detected at the chromatin level. Even with a rise in plasma osmolality, male and female kidneys have distinct transcriptomes suggesting that there may be diverse mechanisms used to remain in fluid balance.NEW & NOTEWORTHY The kidney consists of >30 cell types that work collectively to maintain fluid-electrolyte balance. Kidney single-nucleus transcriptomes and chromatin accessibility profiles from male and female control (ad libitum water and food) or mildly dehydrated mice (ad libitum food, water deprivation) were determined. Mild dehydration caused hundreds of cell- and sex-specific transcriptomic changes, even though the kidney function to conserve water was the same.

Keywords: chromatin; dehydration; kidney; sex differences; transcriptome.


Conflict of interest statement

No conflicts of interest, financial or otherwise, are declared by the authors.

Figures

None
Graphical abstract
Figure 1.
Figure 1.
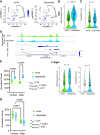
Single kidney nuclei RNA and ATAC sequencing from male and female mice that had free access to water (ad lib) or were water deprived for 9 h (dehydrated). A: unsupervised clustering revealed all the predicted kidney cell types with each cluster containing both ad lib and dehydrated nuclei (inset). B: associations between differentially expressed genes (DEGs) in the cluster analysis and the differentially accessible chromatin (DAC) of genes that were statistically significant within a cluster (adjusted P value < 0.05). The log2 fold change (log2FC dehydrated/ad lib) is plotted for each gene that had a DEG and DAC within the same cluster. Numbers in the quadrants represent count. C: a heat map of the top 50 protein-coding genes with the highest statistically significant peak-to-gene correlations [Spearman’s correlation coefficients (rObs), one-tailed Z test < 0.05] across all nuclei within the ad lib and dehydrated mice. CDPC, collecting duct principal cell; CNT-PC, connecting duct-principal cells; cTAL, cortical thick ascending limb; DCT1, distal convoluted tubule 1; DCT2, distal convoluted tubule 2; dTL, descending thin limb; fdTL, female descending thin limbs; IMCD, inner medullary collecting duct; mdTL, male descending thin limbs.
Figure 2.
Figure 2.
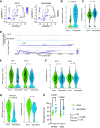
Collecting duct principal cell aquaporin 2 (Aqp2) RNA expression and chromatin accessibility. A: dimplot of Aqp2 RNA expression from the ad lib and dehydrated male and female mice. B: Aqp2 RNA expression. C: cumulative chromatin accessibility of the Aqp2 gene. D: Tn5 integration around Aqp2 in the ad lib and dehydrated mice. Links are predicted significant connections between genomic regions. E and F: the RNA expression and chromatin accessibility of Aqp2 in the connecting tubule (CNT1; E) and inner medullary collecting duct (IMCD; F). P values are Bonferroni adjusted P values. G: whole kidney Aqp2 expression from male and female mice in an ad lib (green) and dehydrated (blue) states. Two-factor ANOVA with Tukey’s post hoc P values are listed.
Figure 3.
Figure 3.
Collecting duct principal cell aquaporin 3 (Aqp3) RNA expression and chromatin accessibility. A: dimplot of Aqp3 RNA expression from the ad lib and dehydrated male and female mice. B: Aqp3 RNA expression. C: cumulative chromatin accessibility of the Aqp3 gene. D: Tn5 integration around Aqp3 in the ad lib and dehydrated mice. Links are predicted significant connections between genomic regions. E: whole kidney Aqp3 expression from male and female mice in an ad lib (green) and dehydrated (blue) states. Two-factor ANOVA with Tukey’s post hoc P values are listed. F: RNA expression and chromatin accessibility of aquaporin 4 (Aqp4) in the collecting duct principal cell. P values are Bonferroni adjusted P values. G: whole kidney Aqp4.
Figure 4.
Figure 4.
Collecting duct principal cell gremlin 2 (Grem2) RNA expression and chromatin accessibility. A: dimplot of Grem2 RNA expression from the ad lib and dehydrated male and female mice. B: Grem2 RNA expression. C: cumulative chromatin accessibility of the Grem2 gene. D: Tn5 integration around Grem2 in the ad lib and dehydrated mice. Links are predicted significant connections between genomic regions. P values are Bonferroni adjusted P values. E: whole kidney Grem2 expression from male and female mice in an ad lib (green) and dehydrated (blue) states. Two-factor ANOVA with Tukey’s post hoc P values are listed.
Figure 5.
Figure 5.
Collecting duct principal cell phosphodiesterase 10a (Pde10a) RNA expression and chromatin accessibility. A: dimplot of Pde10a RNA expression from the ad lib and dehydrated male and female mice. B: Pde10a RNA expression. C: cumulative chromatin accessibility of the Pde10a gene. D: Tn5 integration around Pde10a in the ad lib and dehydrated mice. Links are predicted significant connections between genomic regions. E: Pde10a expression in the distal convoluted tubule (DCT)1 and DCT2. F and G: chromatin accessibility in the DCTs (F) and podocyte (G). Bonferroni-adjusted P values are reported. H: whole kidney Pde10a expression from male and female mice in ad lib (green) and dehydrated (blue) states. Two-factor ANOVA with Tukey’s post hoc P values are listed.
Figure 6.
Figure 6.
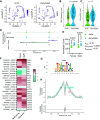
The transcription factor cAMP-responsive element modulator (Crem) is expressed in many kidney cell types but is statistically significantly expressed greater in collecting duct principal cells of dehydrated mice. A: dimplot of Crem RNA expression from the ad lib and dehydrated male and female mice. B and C: Crem RNA expression (B) and cumulative chromatin accessibility of the Crem gene (C). D: Tn5 integration around the Crem gene in the ad lib and dehydrated mice. No statistically significant links were predicted. P values are Bonferroni-adjusted P values. E: whole kidney Crem expression from male and female mice in ad lib (green) and dehydrated (blue) states. Two-factor ANOVA with Tukey’s post hoc P values are listed. F: cluster-specific transcription factor motif activity z-scores and RNA expression log2 fold change (log2FC dehydrated/ad lib) for all transcription factors that agreed within a cluster. G: the DNA motif for CREM. H: Tn5 integration around the Crem motif from the ad lib and dehydrated mice. CDPC, collecting duct principal cell; fdTL, female descending thin limbs; mdTL, male descending thin limbs.
Figure 7.
Figure 7.
A: molecular function of DEGs (dehydrated/ad lib) enriched in molecular functions of male (green) and female (purple) proximal tubules. Solid colors represent enriched in the dehydrated mice, whereas hatched bars represent enriched in the ad lib mice. B: unique DEGs (dehydrated/ad lib) from all clusters of the kidney enriched in biological processes for the male and female mice. Green dots represent biological processes enriched in the dehydrated mice, and red dots represent biological processes enriched in the ad lib mice. −log q is the false discovery rate adjusted P for multiple comparisons. DEGs, differentially expressed genes.

References

    1. McKinley MJ, Mathai ML, McAllen RM, McClear RC, Miselis RR, Pennington GL, Vivas L, Wade JD, Oldfield BJ. Vasopressin secretion: osmotic and hormonal regulation by the lamina terminalis. J Neuroendocrinol 16: 340–347, 2004. doi:10.1111/j.0953-8194.2004.01184.x. - DOI - PubMed
    1. Bisset GW, Chowdrey HS. Control of release of vasopressin by neuroendocrine reflexes. Q J Exp Physiol 73: 811–872, 1988. doi:10.1113/expphysiol.1988.sp003223. - DOI - PubMed
    1. Chen L, Jung HJ, Datta A, Park E, Poll BG, Kikuchi H, Leo KT, Mehta Y, Lewis S, Khundmiri SJ, Khan S, Chou CL, Raghuram V, Yang CR, Knepper MA. Systems biology of the vasopressin V2 receptor: new tools for discovery of molecular actions of a GPCR. Annu Rev Pharmacol Toxicol 62: 595–616, 2022. doi:10.1146/annurev-pharmtox-052120-011012. - DOI - PMC - PubMed
    1. Balzer MS, Rohacs T, Susztak K. How many cell types are in the kidney and what do they do? Annu Rev Physiol 84: 507–531, 2022. doi:10.1146/annurev-physiol-052521-121841. - DOI - PMC - PubMed
    1. Dumas SJ, Meta E, Borri M, Goveia J, Rohlenova K, Conchinha NV, Falkenberg K, Teuwen LA, de Rooij L, Kalucka J, Chen R, Khan S, Taverna F, Lu W, Parys M, De Legher C, Vinckier S, Karakach TK, Schoonjans L, Lin L, Bolund L, Dewerchin M, Eelen G, Rabelink TJ, Li X, Luo Y, Carmeliet P. Single-cell RNA sequencing reveals renal endothelium heterogeneity and metabolic adaptation to water deprivation. J Am Soc Nephrol 31: 118–138, 2020. doi:10.1681/ASN.2019080832. - DOI - PMC - PubMed

Publication types