. 2024 Jan 8;5(1):34-55.
doi: 10.1158/2643-3230.BCD-23-0062.

Transcriptional Heterogeneity Overcomes Super-Enhancer Disrupting Drug Combinations in Multiple Myeloma

Affiliations

Transcriptional Heterogeneity Overcomes Super-Enhancer Disrupting Drug Combinations in Multiple Myeloma

Seth J Welsh et al. Blood Cancer Discov. .

Abstract

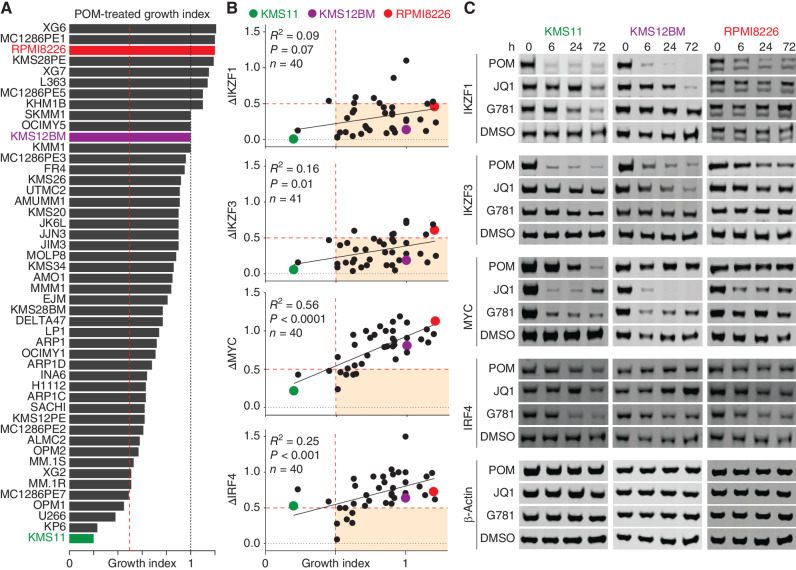
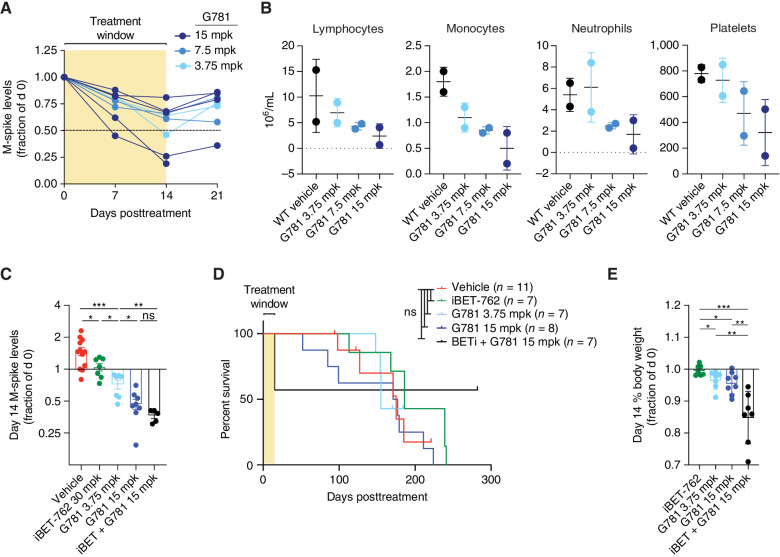
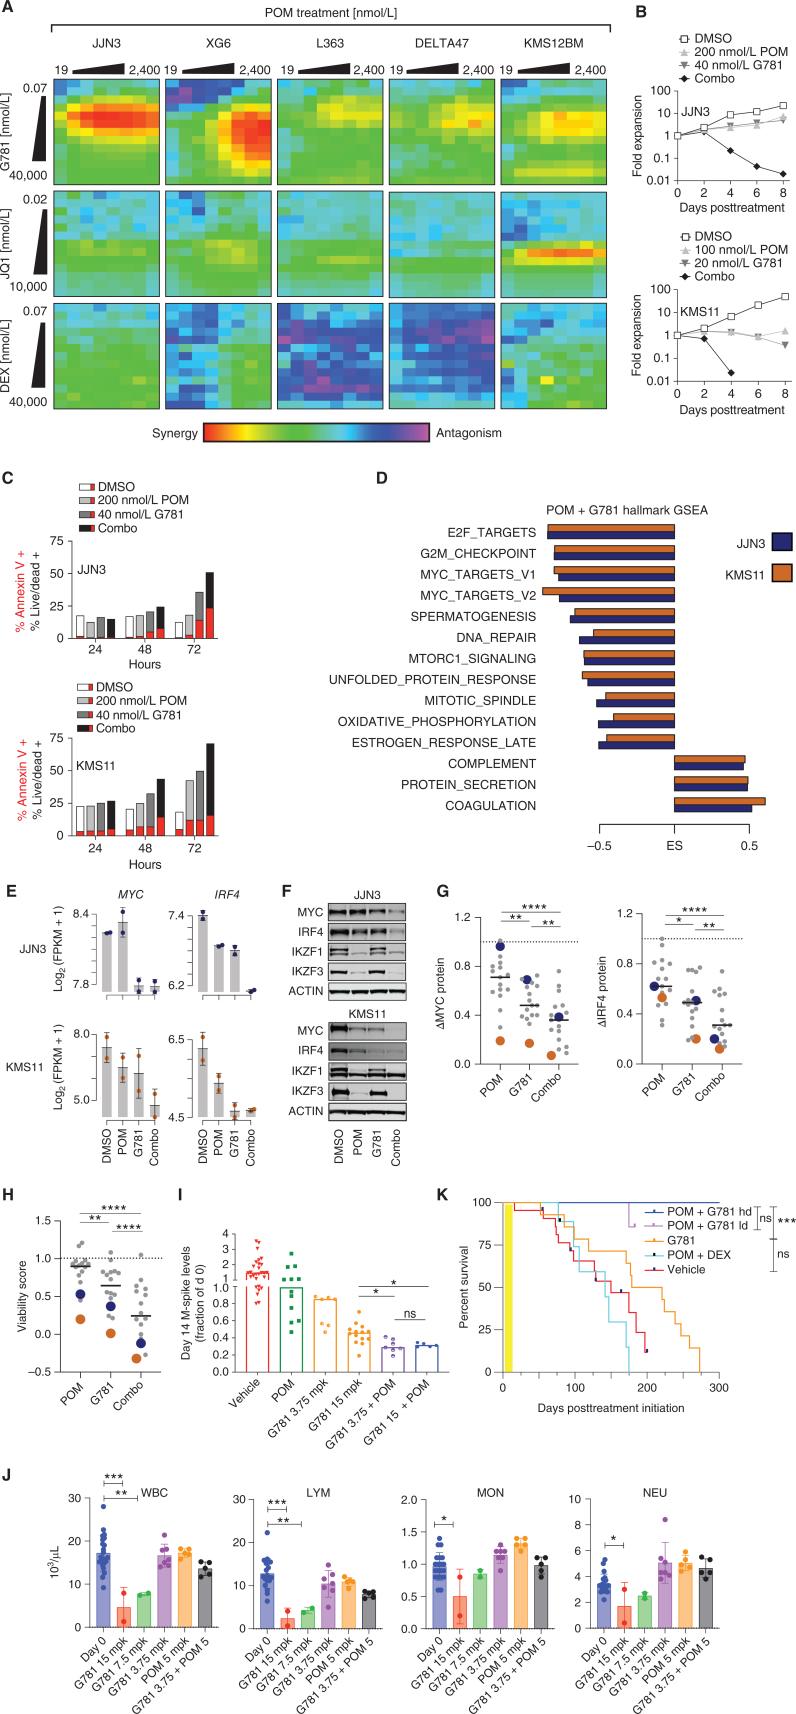
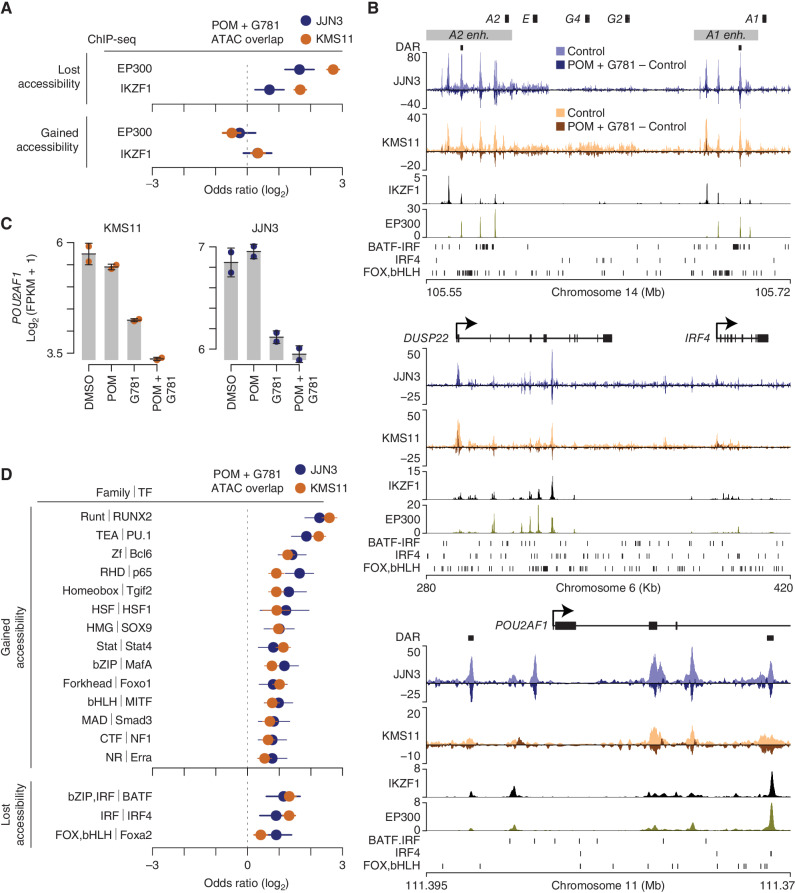
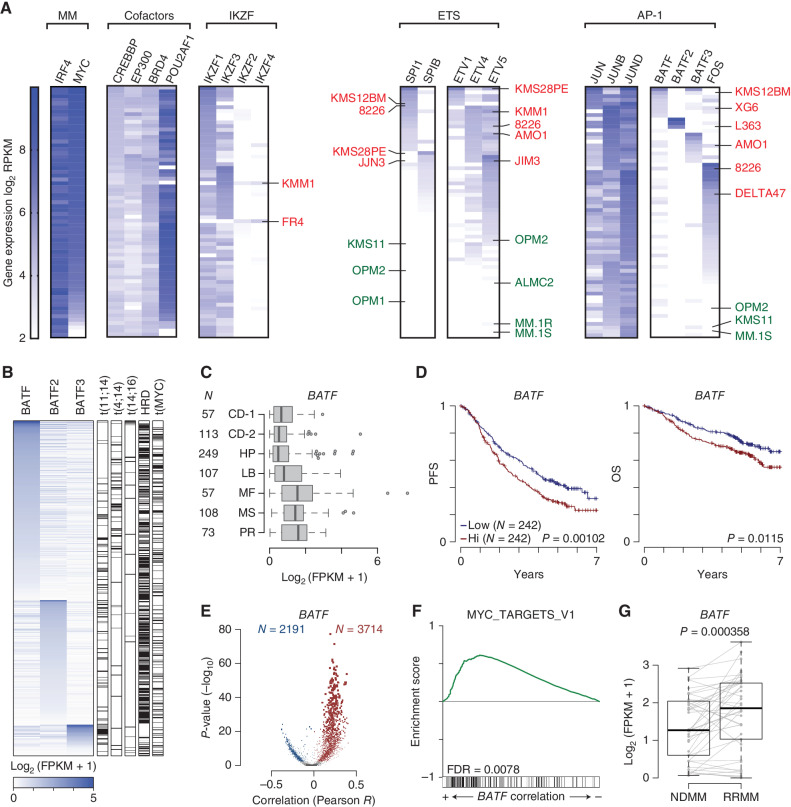
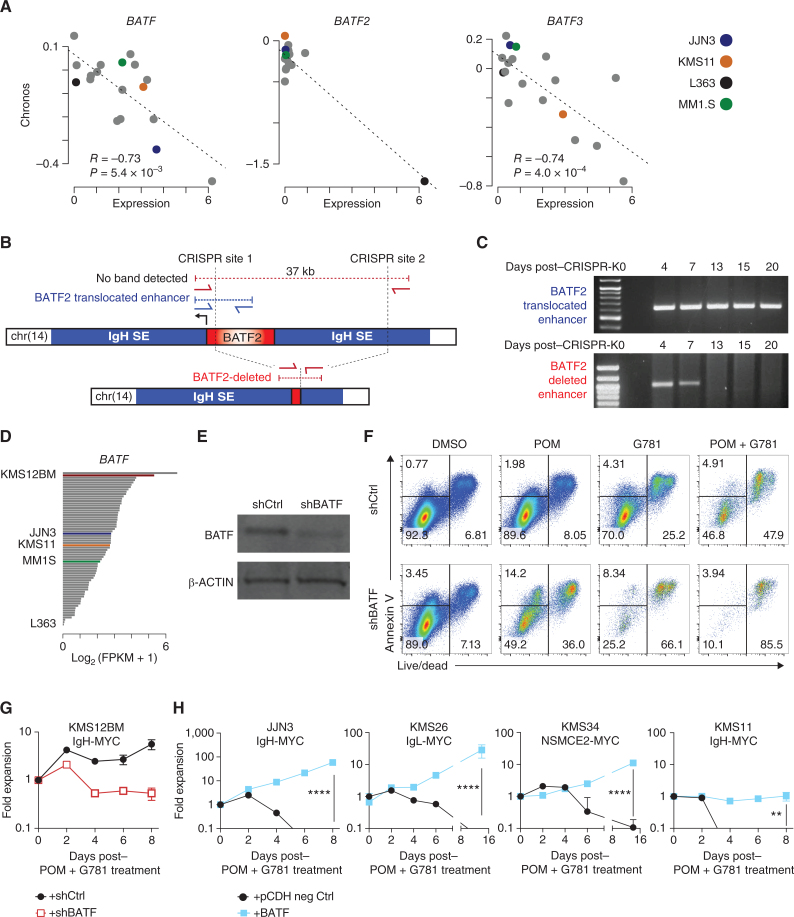
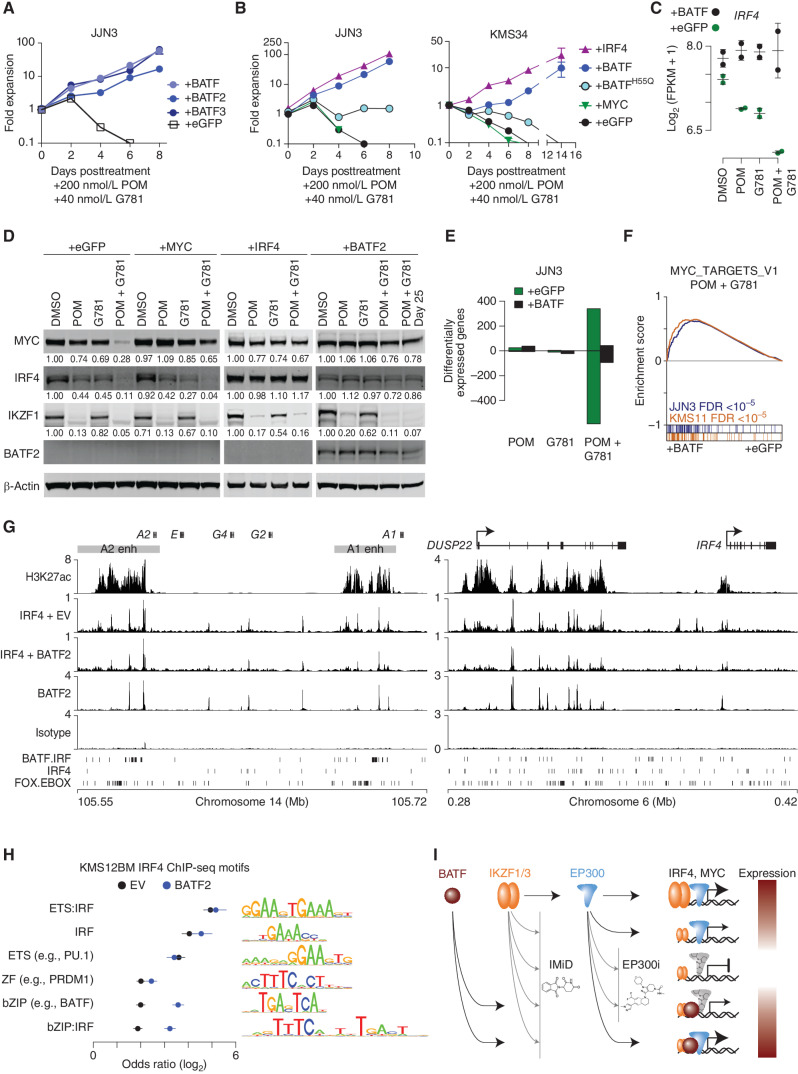
Multiple myeloma (MM) is a malignancy that is often driven by MYC and that is sustained by IRF4, which are upregulated by super-enhancers. IKZF1 and IKZF3 bind to super-enhancers and can be degraded using immunomodulatory imide drugs (IMiD). Successful IMiD responses downregulate MYC and IRF4; however, this fails in IMiD-resistant cells. MYC and IRF4 downregulation can also be achieved in IMiD-resistant tumors using inhibitors of BET and EP300 transcriptional coactivator proteins; however, in vivo these drugs have a narrow therapeutic window. By combining IMiDs with EP300 inhibition, we demonstrate greater downregulation of MYC and IRF4, synergistic killing of myeloma in vitro and in vivo, and an increased therapeutic window. Interestingly, this potent combination failed where MYC and IRF4 expression was maintained by high levels of the AP-1 factor BATF. Our results identify an effective drug combination and a previously unrecognized mechanism of IMiD resistance.

Significance: These results highlight the dependence of MM on IKZF1-bound super-enhancers, which can be effectively targeted by a potent therapeutic combination pairing IMiD-mediated degradation of IKZF1 and IKZF3 with EP300 inhibition. They also identify AP-1 factors as an unrecognized mechanism of IMiD resistance in MM. See related article by Neri, Barwick, et al., p. 56. See related commentary by Yun and Cleveland, p. 5. This article is featured in Selected Articles from This Issue, p. 4.


Figures

Figure 1. IMiDs require MYC and IRF4 downregulation to be effective. A, Ranked bar plot of growth index scores for 48 HMCLs treated for 3 days with 200 nmol/L POM. B, Plots of ≥40 HMCLs (each dot is a cell line) showing changes in protein levels (y axis) with corresponding growth index scores (x axis) 3 days after treatment with 200 nmol/L POM. Changes in protein levels were determined by first normalizing to total protein using REVERT, then calculating differences relative to parental DMSO-treated control as determined by western blot. C, Representative western blots for 3 HMCLs treated with either 200 nmol/L POM (IKZF1/3 degrader), 250 nmol/L JQ1 (BRD4 inhibitor), 40 nmol/L GNE-781 (G781; EP300 inhibitor), or DMSO control. A and B, Vertical dotted red lines indicate a 50% growth index score. B, Horizontal dotted red lines indicate 50% reduction in protein levels compared with DMSO control. Shaded box indicates conditions where protein levels dropped below 50%, whereas growth index scores remained higher than 50%. Pearson correlation (R) and significance of correlation (P) as determined by linear regression are listed. A–C, Cell lines KMS11, KMS12BM, and RPMI8226 are highlighted in color as representative examples.
Figure 1.
IMiDs require MYC and IRF4 downregulation to be effective. A, Ranked bar plot of growth index scores for 48 HMCLs treated for 3 days with 200 nmol/L POM. B, Plots of ≥40 HMCLs (each dot is a cell line) showing changes in protein levels (y axis) with corresponding growth index scores (x axis) 3 days after treatment with 200 nmol/L POM. Changes in protein levels were determined by first normalizing to total protein using REVERT, then calculating differences relative to parental DMSO-treated control as determined by western blot. C, Representative western blots for 3 HMCLs treated with either 200 nmol/L POM (IKZF1/3 degrader), 250 nmol/L JQ1 (BRD4 inhibitor), 40 nmol/L GNE-781 (G781; EP300 inhibitor), or DMSO control. A and B, Vertical dotted red lines indicate a 50% growth index score. B, Horizontal dotted red lines indicate 50% reduction in protein levels compared with DMSO control. Shaded box indicates conditions where protein levels dropped below 50%, whereas growth index scores remained higher than 50%. Pearson correlation (R) and significance of correlation (P) as determined by linear regression are listed. AC, Cell lines KMS11, KMS12BM, and RPMI8226 are highlighted in color as representative examples.
Figure 2. JQ1 and G781 are toxic in vivo. A, Changes in serum M-spike levels (a marker of tumor burden) relative to day 0 in 71–82 week-old de novo Vk*MYC mice treated twice daily for 2 weeks with increasing doses of the EP300 inhibitor G781 (shaded area). B, Day 14 blood cell and platelet counts for the same mice treated in A. C, Day 14 serum M-spike values relative to day 0 for WT mice transplanted with Vk29790 tumor line and treated twice daily for 2 weeks with vehicle, BET inhibitor (iBET-762), EP300 inhibitor (G781), or the combination. D, Survival curves for the same WT mice transplanted and treated in C. E, Day 14 decreases in % body weight relative to day 0 for same mice treated in C and D. For all panels, each dot represents an individual mouse. Survival curve statistics in D were derived from the Mantel–Cox log-ranked χ2 test. All other P values were determined by an unpaired t test: *, P < 0.05; **, P < 0.01; ***, P < 0.001; ****, P < 0.0001. ns, not significant. Error bars display SD.
Figure 2.
JQ1 and G781 are toxic in vivo. A, Changes in serum M-spike levels (a marker of tumor burden) relative to day 0 in 71–82 week-old de novo Vk*MYC mice treated twice daily for 2 weeks with increasing doses of the EP300 inhibitor G781 (shaded area). B, Day 14 blood cell and platelet counts for the same mice treated in A. C, Day 14 serum M-spike values relative to day 0 for WT mice transplanted with Vk29790 tumor line and treated twice daily for 2 weeks with vehicle, BET inhibitor (iBET-762), EP300 inhibitor (G781), or the combination. D, Survival curves for the same WT mice transplanted and treated in C. E, Day 14 decreases in % body weight relative to day 0 for same mice treated in C and D. For all panels, each dot represents an individual mouse. Survival curve statistics in D were derived from the Mantel–Cox log-ranked χ2 test. All other P values were determined by an unpaired t test: *, P < 0.05; **, P < 0.01; ***, P < 0.001; ****, P < 0.0001. ns, not significant. Error bars display SD.
Figure 3. POM + G781 effectively target MYC and IRF4 in vitro, and synergize in vivo. A, Heat maps showing Loewe synergy scores from 6 HMCLs (listed on top) treated for 72 hours with increasing doses of POM (top; x axis) paired with increasing doses of G781 (top row; y axis), JQ1 (middle row; y axis), or DEX (bottom row; y axis). Red and yellow shading indicates drug synergy whereas blue and purple indicates drug antagonism. B, Growth curves for JJN3 (top) and KMS11 (bottom) cell lines treated with DMSO control or low doses of POM, G781, or the combination. Y axis shows the fold expansion of cells normalized to day 0. The x axis shows days posttreatment. C, Bar graphs of cell lines JJN3 (top) and KMS11 (bottom) showing the percent-positive cells (y axis) as measured by flow cytometry. Cells were treated with 200 nmol/L POM, 40 nmol/L G781, or the combination across three different time points (x axis). For each condition, the fraction of cells positive for Annexin V–only is displayed in red, added to the remaining fraction of cells double-positive for both Annexin V and Live/Dead is shown in grayscale. D, Gene set enrichment analysis (GSEA) of RNA sequencing for 200 nmol/L POM and 40 nmol/L G781, 48-hour treated myeloma cells. Enrichment scores (ES) are shown for significant (FDR ≤0.01) Hallmark gene sets enriched in both JJN3 (blue) and KMS11 (orange) ranked from most significant (top) to least significant (bottom). E, RNA expression of MYC (left) and IRF4 (right) for JJN3 (top) and KMS11 (bottom) for treatment conditions listed. F, Western blots showing changes in MYC, IRF4, IKZF1, and IKZF3 protein levels in JJN3 (top) or KMS11 (bottom) following 72-hour treatment with 200 nmol/L POM, 40 nmol/L G781, or the combination. G, Dot plots of HMCLs showing a change in MYC (left) and IRF4 protein levels 72 hours following treatment with 200 nmol/L POM, 40 nmol/L G781, or combination as detected by western blot relative to DMSO controls. JJN3 (blue) and KMS11 (orange) are denoted in blue and orange, respectively. H, Viability scores of HMCLs shown in G following 96 hours of treatment with 200 nmol/L POM, 40 nmol/L G781, or the combination. Scores were generated using CellTiter-Glo assay with values normalized to DMSO. I, Day 14 M-spike values obtained in WT mice transplanted with Vk29790 tumor line and treated for 2 weeks, twice daily, with 50 mpk of POM, 3.75 mpk G781, 15 mpk G781, or a POM + G781 combination. Values are normalized to day 0 M-spikes. J, hCRBN+ mice were treated with increasing doses of G781, low-dose POM, or low-dose POM + low-dose G781 (x axis) for 21 days, after which cell counts for white blood cells (WBC) lymphoid cells (LYM), mononuclear cells (MON), and neutrophils (NEU) were calculated using a Heska Hematology Analyzer. Day 0 cell counts prior to treatment are shown in blue. K, Survival curve of WT mice transplanted with Vk29790 tumor line and treated for 2 weeks (yellow shading), twice daily, with Vehicle, 50 mpk POM + 10 mpk DEX,15 mpk G781, or combination 50 mpk POM + 15 or 3.75 (ld) mpk G781. P values in K derived from the Mantel–Cox log-ranked χ2 test. For all other panels, P values were determined by unpaired t test. *, P < 0.05; **, P < 0.01; ***, P < 0.001; ****, P < 0.0001. Error bars display SD. Each dot in G and H represents a unique cell line. Each dot in I–J represents an individual mouse.
Figure 3.
POM + G781 effectively target MYC and IRF4 in vitro, and synergize in vivo.A, Heat maps showing Loewe synergy scores from 6 HMCLs (listed on top) treated for 72 hours with increasing doses of POM (top; x axis) paired with increasing doses of G781 (top row; y axis), JQ1 (middle row; y axis), or DEX (bottom row; y axis). Red and yellow shading indicates drug synergy whereas blue and purple indicates drug antagonism. B, Growth curves for JJN3 (top) and KMS11 (bottom) cell lines treated with DMSO control or low doses of POM, G781, or the combination. Y axis shows the fold expansion of cells normalized to day 0. The x axis shows days posttreatment. C, Bar graphs of cell lines JJN3 (top) and KMS11 (bottom) showing the percent-positive cells (y axis) as measured by flow cytometry. Cells were treated with 200 nmol/L POM, 40 nmol/L G781, or the combination across three different time points (x axis). For each condition, the fraction of cells positive for Annexin V–only is displayed in red, added to the remaining fraction of cells double-positive for both Annexin V and Live/Dead is shown in grayscale. D, Gene set enrichment analysis (GSEA) of RNA sequencing for 200 nmol/L POM and 40 nmol/L G781, 48-hour treated myeloma cells. Enrichment scores (ES) are shown for significant (FDR ≤0.01) Hallmark gene sets enriched in both JJN3 (blue) and KMS11 (orange) ranked from most significant (top) to least significant (bottom). E, RNA expression of MYC (left) and IRF4 (right) for JJN3 (top) and KMS11 (bottom) for treatment conditions listed. F, Western blots showing changes in MYC, IRF4, IKZF1, and IKZF3 protein levels in JJN3 (top) or KMS11 (bottom) following 72-hour treatment with 200 nmol/L POM, 40 nmol/L G781, or the combination. G, Dot plots of HMCLs showing a change in MYC (left) and IRF4 protein levels 72 hours following treatment with 200 nmol/L POM, 40 nmol/L G781, or combination as detected by western blot relative to DMSO controls. JJN3 (blue) and KMS11 (orange) are denoted in blue and orange, respectively. H, Viability scores of HMCLs shown in G following 96 hours of treatment with 200 nmol/L POM, 40 nmol/L G781, or the combination. Scores were generated using CellTiter-Glo assay with values normalized to DMSO. I, Day 14 M-spike values obtained in WT mice transplanted with Vk29790 tumor line and treated for 2 weeks, twice daily, with 50 mpk of POM, 3.75 mpk G781, 15 mpk G781, or a POM + G781 combination. Values are normalized to day 0 M-spikes. J, hCRBN+ mice were treated with increasing doses of G781, low-dose POM, or low-dose POM + low-dose G781 (x axis) for 21 days, after which cell counts for white blood cells (WBC) lymphoid cells (LYM), mononuclear cells (MON), and neutrophils (NEU) were calculated using a Heska Hematology Analyzer. Day 0 cell counts prior to treatment are shown in blue. K, Survival curve of WT mice transplanted with Vk29790 tumor line and treated for 2 weeks (yellow shading), twice daily, with Vehicle, 50 mpk POM + 10 mpk DEX,15 mpk G781, or combination 50 mpk POM + 15 or 3.75 (ld) mpk G781. P values in K derived from the Mantel–Cox log-ranked χ2 test. For all other panels, P values were determined by unpaired t test. *, P < 0.05; **, P < 0.01; ***, P < 0.001; ****, P < 0.0001. Error bars display SD. Each dot in G and H represents a unique cell line. Each dot in IJ represents an individual mouse.
Figure 4. POM + G781 result in chromatin accessibility loss at MM translocated and lineage enhancers. A, Odds ratio of overlap for EP300 and IKZF1 ChIP-seq peaks (MM1S cells) with regions that lost (top) or gained (bottom) chromatin accessibility after POM (200 nmol/L) and G781 (40 nmol/L; POM + G781) treatment in JJN3 (blue) and KMS11 (orange). Confidence intervals (95%) are shown. B, Genome plot of the IGH 3′ enhancers (top), the DUSP22/IRF4 locus (middle), and POU2AF1 (bottom). Differentially accessible regions (DAR) are denoted by black marks. ATAC-seq for JJN3 (blue) and KMS11 (orange) is shown for control cells (lighter shades) along with changes induced by POM + G781 treatment (darker shades). Negative values indicate a loss in chromatin accessibility. IKZF1 and EP300 ChIP-seq are shown below for MM1S myeloma cells. Transcription-factor (TF) binding motifs enriched in regions that lose chromatin accessibility are shown (bottom, each plot). C, RNA expression of POU2AF1 as determined by RNA-seq in KMS11 (left) and JJN3 (right) for DMSO, POM (200 nmol/L), G781 (40 nmol/L), and combination (combo) treated cells. D, Odds ratio of overlap of transcription-factor binding motifs with regions that gain (top) or lose (bottom) chromatin accessibility in JJN3 (blue) and KMS11 (orange). Only TF families enriched (FDR ≤0.01) in both JJN3 and KMS11 are shown with the highest-ranking TF from each family, labelled. TF are from HOMER software with 95% confidence intervals shown. ATAC-seq data (B) represent one replicate and RNA-seq (C) represent two replicates per cell line per condition.
Figure 4.
POM + G781 result in chromatin accessibility loss at MM translocated and lineage enhancers. A, Odds ratio of overlap for EP300 and IKZF1 ChIP-seq peaks (MM1S cells) with regions that lost (top) or gained (bottom) chromatin accessibility after POM (200 nmol/L) and G781 (40 nmol/L; POM + G781) treatment in JJN3 (blue) and KMS11 (orange). Confidence intervals (95%) are shown. B, Genome plot of the IGH 3′ enhancers (top), the DUSP22/IRF4 locus (middle), and POU2AF1 (bottom). Differentially accessible regions (DAR) are denoted by black marks. ATAC-seq for JJN3 (blue) and KMS11 (orange) is shown for control cells (lighter shades) along with changes induced by POM + G781 treatment (darker shades). Negative values indicate a loss in chromatin accessibility. IKZF1 and EP300 ChIP-seq are shown below for MM1S myeloma cells. Transcription-factor (TF) binding motifs enriched in regions that lose chromatin accessibility are shown (bottom, each plot). C, RNA expression of POU2AF1 as determined by RNA-seq in KMS11 (left) and JJN3 (right) for DMSO, POM (200 nmol/L), G781 (40 nmol/L), and combination (combo) treated cells. D, Odds ratio of overlap of transcription-factor binding motifs with regions that gain (top) or lose (bottom) chromatin accessibility in JJN3 (blue) and KMS11 (orange). Only TF families enriched (FDR ≤0.01) in both JJN3 and KMS11 are shown with the highest-ranking TF from each family, labelled. TF are from HOMER software with 95% confidence intervals shown. ATAC-seq data (B) represent one replicate and RNA-seq (C) represent two replicates per cell line per condition.
Figure 5. Myeloma tumors have unique trans-factor expression plasticity that contributes to poor outcomes in patients. A, Gene-expression data for 66 HMCLs displayed as a heat map using log2 RPKM values (key on left). HMCLs were grouped functionally: MM (multiple myeloma factors, IRF4 and MYC); cofactors; IKZF (zinc finger proteins); ETS factors; and AP-1 factors). Once grouped, the cells were then ranked in seven different ways based on trans-factors of interest (listed diagonally above). Each black box has a unique rank order based on the gene-expression levels for the factors listed. A cell line can only occupy one row per black box. Select IMiD-resistant cell lines are denoted in red, and IMiD-sensitive cell lines in green. B, Expression of BATF, BATF2, and BATF3 in newly diagnosed (NDMM) CoMMpass samples with matching RNA-seq and whole-genome sequencing (N = 586). Primary IGH translocations, hyperdiploidy (HRD), and MYC translocations are annotated (right). C, Box plot of BATF expression in NDMM samples from the CoMMpass study categorized by gene-expression subtype for samples with RNA-seq (N = 764). The number of samples (N) in each subtype is denoted (left); subtypes are from Zhan et al. (55). CD-1, Cyclin D1; CD-2, Cyclin D1 and CD20; HP, hyperdiploid; LB, low bone disease; MF, MAF; MS, MMSET; PR, proliferation. D, Progression-free survival (PFS; left) and overall survival (OS; right) Kaplan–Meier curves of CoMMpass NDMM patients with RNA-seq and outcome data and treated with first-line IMiD-containing therapies (N = 484) stratified by median BATF expression. P values were determined by a Wald test of a Cox-proportional hazard regression treating BATF expression as a quantitative response. E, Volcano plots of gene expression correlated with BATF. The Pearson correlation coefficient of each gene with BATF is shown on the x axis, and the significance −log10(P value) is shown on the y axis. Genes significantly (FDR ≤0.01) correlated with BATF are shown in color (red, positive; blue, negative) with the number of significant genes listed (N). F, GSEA of gene expression correlated with BATF in a cross-sectional analysis of CoMMpass NDMM samples. The enrichment score is shown (top) with overlap with GSEA hallmark gene sets shown on the bottom. G, BATF expression in paired NDMM and relapse refractory (RRMM) samples from 35 CoMMpass patients with matching samples treated with IMiD-containing first-line therapies. P value was determined with a linear regression using a covariate for the patient.
Figure 5.
Myeloma tumors have unique trans-factor expression plasticity that contributes to poor outcomes in patients. A, Gene-expression data for 66 HMCLs displayed as a heat map using log2 RPKM values (key on left). HMCLs were grouped functionally: MM (multiple myeloma factors, IRF4 and MYC); cofactors; IKZF (zinc finger proteins); ETS factors; and AP-1 factors). Once grouped, the cells were then ranked in seven different ways based on trans-factors of interest (listed diagonally above). Each black box has a unique rank order based on the gene-expression levels for the factors listed. A cell line can only occupy one row per black box. Select IMiD-resistant cell lines are denoted in red, and IMiD-sensitive cell lines in green. B, Expression of BATF, BATF2, and BATF3 in newly diagnosed (NDMM) CoMMpass samples with matching RNA-seq and whole-genome sequencing (N = 586). Primary IGH translocations, hyperdiploidy (HRD), and MYC translocations are annotated (right). C, Box plot of BATF expression in NDMM samples from the CoMMpass study categorized by gene-expression subtype for samples with RNA-seq (N = 764). The number of samples (N) in each subtype is denoted (left); subtypes are from Zhan et al. (55). CD-1, Cyclin D1; CD-2, Cyclin D1 and CD20; HP, hyperdiploid; LB, low bone disease; MF, MAF; MS, MMSET; PR, proliferation. D, Progression-free survival (PFS; left) and overall survival (OS; right) Kaplan–Meier curves of CoMMpass NDMM patients with RNA-seq and outcome data and treated with first-line IMiD-containing therapies (N = 484) stratified by median BATF expression. P values were determined by a Wald test of a Cox-proportional hazard regression treating BATF expression as a quantitative response. E, Volcano plots of gene expression correlated with BATF. The Pearson correlation coefficient of each gene with BATF is shown on the x axis, and the significance −log10(P value) is shown on the y axis. Genes significantly (FDR ≤0.01) correlated with BATF are shown in color (red, positive; blue, negative) with the number of significant genes listed (N). F, GSEA of gene expression correlated with BATF in a cross-sectional analysis of CoMMpass NDMM samples. The enrichment score is shown (top) with overlap with GSEA hallmark gene sets shown on the bottom. G,BATF expression in paired NDMM and relapse refractory (RRMM) samples from 35 CoMMpass patients with matching samples treated with IMiD-containing first-line therapies. P value was determined with a linear regression using a covariate for the patient.
Figure 6. BATF proteins promote myeloma viability and drug resistance. A, Scatter plot of expression (x axis) by dependency (Chronos, y axis) for BATF (left), BATF2 (middle), and BATF3 in multiple myeloma cell lines in the DepMap project. Expression data from the Cancer Cell Line Encyclopedia. Pearson correlation (R) and significance of correlation (P) as determined by linear regression are listed. Select cell lines are denoted in color (key, right). B, Diagram of the BATF2 translocation in L363 cells identified by mate-pair sequencing (top), CRISPR-Cas9 targeting sites (vertical dotted lines), and the PCR primers (red and blue arrows) used to distinguish the endogenous translocated region from the successfully deleted BATF2/enhancer region (bottom). C, PCR analysis of genomic DNA from L363 cells electroporated with CRISPR-Cas9 and sgRNAs targeting the BATF2/Enhancer locus (B). The top gel shows the detection of the translocated BATF2/enhancer across all days tested. Bottom panel shows successful deletion of BATF2/enhancer that is lost following 7 days of coculture expansion. D, BATF expression in a panel of 66 HMCLs determined by RNA-seq. Expression is shown in fragments per kilobase per million reads (FPKM) with select cell lines labeled and shown in color. E, Western blot of BATF and β-ACTIN loading control in shRNA knockdown of BATF (shBATF) or a negative control (shCtrl) of BATF in KMS12BM cells. F, Representative flow cytometry plots of KMS12BM cells infected with shRNA empty vector (top) or an shRNA targeting BATF (bottom). Cells were plated at equal densities on day 0, then treated for 3 days with DMSO control, 200 nmol/L POM, 40 nmol/L G781, or the combination. Annexin V is shown on the y axis, Live/Dead viability dye is on the x axis. Equal volumes were analyzed for all conditions and biological triplicates were measured. The percent population of each gate is listed. G, Growth curve of panel F KMS12BM cells infected with shRNA empty vector (black line) or an shRNA targeting BATF (red line) and then treated with combination 200 nmol/L POM plus 40 nmol/L G781. Fold expansion is shown on the y axis (log10 scale). Days posttreatment are shown on the x axis. H, Growth curves of 4 different HMCLs expressing negative (neg) ctrl eGFP (black lines) or exogenous BATF (blue lines) and treated with combination 200 nmol/L POM plus 40 nmol/L G781. Fold expansion is shown on the y axis (log10 scale). Cell line and translocated enhancer driving MYC expression are shown on top. Days posttreatment are shown on the x axis. P values determined by an unpaired t test.
Figure 6.
BATF proteins promote myeloma viability and drug resistance. A, Scatter plot of expression (x axis) by dependency (Chronos, y axis) for BATF (left), BATF2 (middle), and BATF3 in multiple myeloma cell lines in the DepMap project. Expression data from the Cancer Cell Line Encyclopedia. Pearson correlation (R) and significance of correlation (P) as determined by linear regression are listed. Select cell lines are denoted in color (key, right). B, Diagram of the BATF2 translocation in L363 cells identified by mate-pair sequencing (top), CRISPR-Cas9 targeting sites (vertical dotted lines), and the PCR primers (red and blue arrows) used to distinguish the endogenous translocated region from the successfully deleted BATF2/enhancer region (bottom). C, PCR analysis of genomic DNA from L363 cells electroporated with CRISPR-Cas9 and sgRNAs targeting the BATF2/Enhancer locus (B). The top gel shows the detection of the translocated BATF2/enhancer across all days tested. Bottom panel shows successful deletion of BATF2/enhancer that is lost following 7 days of coculture expansion. D,BATF expression in a panel of 66 HMCLs determined by RNA-seq. Expression is shown in fragments per kilobase per million reads (FPKM) with select cell lines labeled and shown in color. E, Western blot of BATF and β-ACTIN loading control in shRNA knockdown of BATF (shBATF) or a negative control (shCtrl) of BATF in KMS12BM cells. F, Representative flow cytometry plots of KMS12BM cells infected with shRNA empty vector (top) or an shRNA targeting BATF (bottom). Cells were plated at equal densities on day 0, then treated for 3 days with DMSO control, 200 nmol/L POM, 40 nmol/L G781, or the combination. Annexin V is shown on the y axis, Live/Dead viability dye is on the x axis. Equal volumes were analyzed for all conditions and biological triplicates were measured. The percent population of each gate is listed. G, Growth curve of panel F KMS12BM cells infected with shRNA empty vector (black line) or an shRNA targeting BATF (red line) and then treated with combination 200 nmol/L POM plus 40 nmol/L G781. Fold expansion is shown on the y axis (log10 scale). Days posttreatment are shown on the x axis. H, Growth curves of 4 different HMCLs expressing negative (neg) ctrl eGFP (black lines) or exogenous BATF (blue lines) and treated with combination 200 nmol/L POM plus 40 nmol/L G781. Fold expansion is shown on the y axis (log10 scale). Cell line and translocated enhancer driving MYC expression are shown on top. Days posttreatment are shown on the x axis. P values determined by an unpaired t test.
Figure 7. BATF maintains IRF4 and MYC expression by regulating myeloma super-enhancers. A, Growth curves showing JJN3 cells expressing eGFP, BATF, BATF2, or BATF3 constructs listed and treated with 200 nmol/L POM plus 40 nmol/L G781. The y axis shows fold expansion relative to day 0 (log10). The x axis shows days posttreatment. B, Growth curves showing JJN3 and KMS34 cells expressing various constructs listed, and treated with 200 nmol/L POM plus 40 nmol/L G781. The y axis shows fold expansion relative to day 0 (log10). The x axis shows days posttreatment. C, IRF4 expression in JJN3 cells treated with 200 nmol/L POM, 40 nmol/L G781, or both (Combo) relative to DMSO controls in cells transduced with a control (eGFP) or BATF-overexpressing construct. D, Day 3 Western blot analysis showing MYC, IRF4, IKZF1, and BATF2 levels in JJN3 cells expressing various constructs (listed at the top), and treated with 200 nmol/L POM, 40 nmol/L G781, or the combination. Actin is shown as a loading control. E, Bar plot of the number of differentially expressed genes (FDR ≤0.01) in JJN3 cells treated with 200 nmol/L POM, 40 nmol/L G781, or both (Combo) relative to DMSO controls in cells transduced with a control (eGFP) or BATF-overexpressing construct. F, GSEA for BATF overexpression (+BATF, left) as compared with control (+eGFP, right) in JJN3 (blue) and KMS11 (orange) cells treated with POM and G781. The positive enrichment score (top) denotes enrichment of the GSEA Hallmark MYC_TARGETS_V1 genes in the BATF versus control. Genes for each cell are ranked and overlap with MYC_TARGETS_V1 genes are shown in color (bottom). G, H3K27Ac and IRF4 ChIP-seq in KMS12BM empty vector (EV) cells as well as IRF4 and BATF2 ChIP-seq in KMS12BM cells overexpressing BATF2 (+BATF2) at the IGH 3′ enhancers (left) and the DUSP22/IRF4 enhancer (right). Isotype control is shown, and BATF-IRF4 composite, IRF4, and FOX-EBOX motifs are shown at the bottom. H, Motif analysis of IRF4-bound regions for KMS12BM “+BATF2” and “EV” cells where the union of the top 5 enriched motifs for each condition was combined, and the odds ratio of each motif is plotted relative to shuffled background regions. Motif logos are shown (right). I, Model of MYC and IRF4 regulation by IKZF1/3, EP300, and BATF in the context of IMiDs and EP300 inhibitors (EP300i). IKZF1/3 and EP300 are found at enhancers of IRF4 and MYC (top row). IMIDs and P300i result in IKZF1/3 depletion and inhibition of P300, respectively, resulting in repression of IRF4 and MYC (rows 2-3) that can be overcome through ectopic expression of BATF, which also binds IRF4 and MYC enhancers. Expression level of IRF4 and MYC is denoted by color (red, high; white, low).
Figure 7.
BATF maintains IRF4 and MYC expression by regulating myeloma super-enhancers. A, Growth curves showing JJN3 cells expressing eGFP, BATF, BATF2, or BATF3 constructs listed and treated with 200 nmol/L POM plus 40 nmol/L G781. The y axis shows fold expansion relative to day 0 (log10). The x axis shows days posttreatment. B, Growth curves showing JJN3 and KMS34 cells expressing various constructs listed, and treated with 200 nmol/L POM plus 40 nmol/L G781. The y axis shows fold expansion relative to day 0 (log10). The x axis shows days posttreatment. C,IRF4 expression in JJN3 cells treated with 200 nmol/L POM, 40 nmol/L G781, or both (Combo) relative to DMSO controls in cells transduced with a control (eGFP) or BATF-overexpressing construct. D, Day 3 Western blot analysis showing MYC, IRF4, IKZF1, and BATF2 levels in JJN3 cells expressing various constructs (listed at the top), and treated with 200 nmol/L POM, 40 nmol/L G781, or the combination. Actin is shown as a loading control. E, Bar plot of the number of differentially expressed genes (FDR ≤0.01) in JJN3 cells treated with 200 nmol/L POM, 40 nmol/L G781, or both (Combo) relative to DMSO controls in cells transduced with a control (eGFP) or BATF-overexpressing construct. F, GSEA for BATF overexpression (+BATF, left) as compared with control (+eGFP, right) in JJN3 (blue) and KMS11 (orange) cells treated with POM and G781. The positive enrichment score (top) denotes enrichment of the GSEA Hallmark MYC_TARGETS_V1 genes in the BATF versus control. Genes for each cell are ranked and overlap with MYC_TARGETS_V1 genes are shown in color (bottom). G, H3K27Ac and IRF4 ChIP-seq in KMS12BM empty vector (EV) cells as well as IRF4 and BATF2 ChIP-seq in KMS12BM cells overexpressing BATF2 (+BATF2) at the IGH 3′ enhancers (left) and the DUSP22/IRF4 enhancer (right). Isotype control is shown, and BATF-IRF4 composite, IRF4, and FOX-EBOX motifs are shown at the bottom. H, Motif analysis of IRF4-bound regions for KMS12BM “+BATF2” and “EV” cells where the union of the top 5 enriched motifs for each condition was combined, and the odds ratio of each motif is plotted relative to shuffled background regions. Motif logos are shown (right). I, Model of MYC and IRF4 regulation by IKZF1/3, EP300, and BATF in the context of IMiDs and EP300 inhibitors (EP300i). IKZF1/3 and EP300 are found at enhancers of IRF4 and MYC (top row). IMIDs and P300i result in IKZF1/3 depletion and inhibition of P300, respectively, resulting in repression of IRF4 and MYC (rows 2-3) that can be overcome through ectopic expression of BATF, which also binds IRF4 and MYC enhancers. Expression level of IRF4 and MYC is denoted by color (red, high; white, low).

Comment in

Similar articles

Cited by

References

    1. Fonseca R, Barlogie B, Bataille R, Bastard C, Bergsagel PL, Chesi M, et al. . Genetics and cytogenetics of multiple myeloma: a workshop report. Cancer Res 2004;64:1546–58. - PubMed
    1. Kuehl WM, Bergsagel PL. Molecular pathogenesis of multiple myeloma and its premalignant precursor. J Clin Invest 2012;122:3456–63. - PMC - PubMed
    1. Chesi M, Bergsagel PL, Shonukan OO, Martelli ML, Brents LA, Chen T, et al. . Frequent dysregulation of the c-maf proto-oncogene at 16q23 by translocation to an Ig locus in multiple myeloma. Blood 1998;91:4457–63. - PubMed
    1. Chesi M, Nardini E, Brents LA, Schrock E, Ried T, Kuehl WM, et al. . Frequent translocation t(4;14)(p16.3;q32.3) in multiple myeloma is associated with increased expression and activating mutations of fibroblast growth factor receptor 3. Nat Genet 1997;16:260–4. - PMC - PubMed
    1. Bergsagel PL, Chesi M, Nardini E, Brents LA, Kirby SL, Kuehl WM. Promiscuous translocations into immunoglobulin heavy chain switch regions in multiple myeloma. Proc Natl Acad Sci U S A 1996;93:13931–6. - PMC - PubMed

Publication types

MeSH terms