mAb therapy controls CNS-resident lyssavirus infection via a CD4 T cell-dependent mechanism
- PMID: 37767784
- PMCID: PMC10565638
- DOI: 10.15252/emmm.202216394
mAb therapy controls CNS-resident lyssavirus infection via a CD4 T cell-dependent mechanism
Abstract
Infections with rabies virus (RABV) and related lyssaviruses are uniformly fatal once virus accesses the central nervous system (CNS) and causes disease signs. Current immunotherapies are thus focused on the early, pre-symptomatic stage of disease, with the goal of peripheral neutralization of virus to prevent CNS infection. Here, we evaluated the therapeutic efficacy of F11, an anti-lyssavirus human monoclonal antibody (mAb), on established lyssavirus infections. We show that a single dose of F11 limits viral load in the brain and reverses disease signs following infection with a lethal dose of lyssavirus, even when administered after initiation of robust virus replication in the CNS. Importantly, we found that F11-dependent neutralization is not sufficient to protect animals from mortality, and a CD4 T cell-dependent adaptive immune response is required for successful control of infection. F11 significantly changes the spectrum of leukocyte populations in the brain, and the FcRγ-binding function of F11 contributes to therapeutic efficacy. Thus, mAb therapy can drive potent neutralization-independent T cell-mediated effects, even against an established CNS infection by a lethal neurotropic virus.
Keywords: Australian bat lyssavirus; Fc function; adaptive immunity; monoclonal antibody; rabies.
© 2023 Commonwealth of Australia and The Authors. Published under the terms of the CC BY 4.0 license. This article has been contributed to by U.S. Government employees and their work is in the public domain in the USA.
Conflict of interest statement
The authors declare that they have no conflict of interest.
Figures

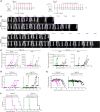
Mice were infected with 2 × 10⁵ FFU of ABLV‐luc on day 0 and mAb F11 (10 mg/kg) was administered on day 3, 5, or 7 (n = 6 mice/group).
Bioluminescence imaging of mice on days 3, 10, 24, and 38 post‐infection. See Fig EV1D for full series.
Viral burden was quantified as mean luminescence intensity in spines (top row) and brains (bottom row) of mice. Insets are same data with reduced y‐axis scale, to show detail.
Cumulative disease scores were determined by clinical presentation following ABLV‐luc challenge.
Percent starting body weight as an indicator of disease.
Kaplan–Meier survival plot. ABLV‐luc Untreated vs. ABLV‐luc F11 day 3, P = NS; ABLV‐luc Untreated vs. ABLV‐luc F11 day 5, P = 0.0003; ABLV‐luc Untreated vs. ABLV‐luc F11 day 7, P = 0.0036. Log‐rank test with Tukey–Kramer correction for multiple comparisons.

Ten‐fold serial dilutions of F11 were incubated with 8 × 10⁴ FFU of ABLV‐luc, added to mouse N2a cells, and cells were stained with anti‐rabies G to detect virions. Bar, 20 μm.
Left graph is standard curve of absorbance vs. concentration of F11 diluted in normal mouse serum, measured by ELISA. Right graph is average concentration of F11 in serum of mice over time. Mice were injected on day 0 with 10 mg/kg F11. Sera were collected from 4 mice per time point at 1, 7, 14, 21, 28 and 56 days post injection. Concentration was calculated based on standard curve, and F11 in vivo half‐life was calculated via non‐linear regression using one‐phase exponential decay with a least squares fit. Error bars are SD.
Coronal sections of brain stem from ABLV‐luc‐infected mice (day 11 post‐infection) were stained to confirm the presence of virus. Bar, top set 50 μm, bottom set 10 μm.
Bioluminescence imaging of mice infected with 2 × 10⁵ FFU of ABLV‐luc and treated with F11 on day 3, 5, or 7 post‐infection.

- A
Ten‐fold serial dilutions of F11 were incubated with 1 × 10⁵ FFU of CVS‐11, added to mouse N2A cells, and cells were stained with anti‐rabies G to detect virions. Bar, 20 μm.
- B
Mice were infected with 2 × 10⁵ FFU of CVS‐11 on day 0 and mAb F11 (10 mg/kg) was administered on day 5 or 7 (n = 3 Uninfected, Untreated mice; n = 5 CVS‐11, Untreated; n = 6 each: CVS‐11, F11 day 5 and CVS‐11, F11 day 7).
- C, D
(C) Cumulative disease scores, and (D) Percent starting body weight, over time post‐infection. Insets are means, error bars are SEM. CVS‐11, Untreated vs. CVS‐11, F11 day 5, P < 0.0001, CVS‐11, Untreated vs. CVS‐11, F11 day 7, P = 0.033. Mixed model with first‐order autoregressive correlation structure. *P = 0.039, on post‐infection day 11 (F11 day 5 treatment group) after Tukey–Kramer adjustment for multiple comparisons.
- E
Kaplan–Meier survival plot. CVS‐11, Untreated vs. CVS‐11, F11 day 5, P = NS; CVS‐11, Untreated vs. CVS‐11, F11 day 7, P = NS. Logrank test with Tukey–Kramer correction for multiple comparisons.
- F
Coronal sections of cerebellum from CVS‐11‐infected mice (day 8 post‐infection) were stained to confirm the presence of virus. Bar, 200 μm.

NSG mice (n = 3 Uninfected, Untreated; n = 6 ABLV‐luc, Untreated; n = 6 ABLV‐luc, F11 day 5) were infected with 2 × 10⁵ FFU of ABLV‐luc on day 0 and mAb F11 (10 mg/kg) was administered on day 5.
Bioluminescence imaging of mice following infection.
Viral burden was quantified as mean luminescence intensity in the spines and brains.
Disease score over time post‐infection.
Percent starting body weight.
Kaplan–Meier survival plot. ABLV‐luc, Untreated vs. ABLV‐luc, F11 day 5, P = 0.005. Logrank test.

NOD‐SCID and Rag 1KO mice were infected with 2 × 10⁵ FFU of ABLV‐luc on day 0 and mAb F11 (10 mg/kg) was administered on day 5 (n = 6 mice/group).
Bioluminescence imaging of mice was conducted on the indicated days post‐infection.
Viral burden was quantified as mean luminescence intensity in spines and brains of mice.
Cumulative disease scores were determined by clinical presentation following. ABLV‐luc challenge.
Percent starting body weight over time as an indicator of disease.
Kaplan–Meier survival plot. NOD‐SCID ABLV‐luc, Untreated vs. NOD‐SCID ABLV‐luc, F11, P = 0.025. Rag1 KO ABLV‐luc, Untreated vs. Rag1 KO ABLV‐luc, F11, P = 0.022. Logrank test.

- A
Isotype control and CD8 T cell‐depleted C57BL/6J mice were infected with 2 × 10⁵ FFU of ABLV‐luc on day 0 and mAb F11 (10 mg/kg) was administered on day 5 (n = 6 mice/group, n = 3 Uninfected, Untreated mice/group).
- B
Kaplan–Meier survival plot. Isotype, ABLV‐luc, Untreated vs. isotype, ABLV‐luc, F11, P = 0.0006; anti‐CD8α, ABLV‐luc, Untreated vs. anti‐CD8α, ABLV‐luc, F11, P = 0.0197; isotype, ABLV‐luc, Untreated vs. anti‐CD8α, ABLV‐luc, Untreated = NS. Logrank test with Tukey–Kramer correction for multiple comparisons.
- C
Percent starting body weight over time post‐infection. over time post‐infection.
- D
Bioluminescence imaging of mice on days −5, 5, 7, 10, 12, 17, 24, and 31 post‐rechallenge.
- E, F
Viral burden was quantified as mean luminescence intensity (MLI) in the spines (E) and brains (F) of rechallenged mice.
- G–I
Percent starting body weight (G), cumulative disease scores (H), and Kaplan–Meier survival plot (I) of rechallenged mice.

- A
Bioluminescence imaging of isotype control and CD8 T cell‐depleted mice infected with 2 × 10⁵ FFU of ABLV‐luc and treated with mAb F11 on day 5 (n = 6 mice/group, n = 3 Uninfected, Untreated mice/group).
- B, C
Viral burden was quantified as mean luminescence intensity (MLI) in the spines (B) and brains (C) of infected mice. Insets are same data with a reduced y‐axis scale; note that inset y‐axis values are not multiplied by 103.
- D
Bioluminescence imaging of CD8 T cell‐depleted mice maintaining low levels of virus within the brain (same data as (A), but with reduced intensity scale to enable visualization of low intensity luminescence).
- E
Cumulative disease scores were determined by clinical presentation following ABLV‐luc challenge.

C57BL/6J and MHCII− mice were infected with 2 × 10⁵ FFU of ABLV‐luc on day 0 and mAb F11 (10 mg/kg) was administered on day 5 (n = 6 mice/group, except n = 3 Uninfected, Untreated mice).
Kaplan–Meier survival plot. WT, ABLV‐luc Untreated vs. WT, ABLV‐luc F11, P = 0.0004; MHCII−, ABLV‐luc Untreated vs. MHCII−, ABLV‐luc, F11, P = NS; WT, ABLV‐luc, F11 vs. MHCII−, ABLV‐luc, F11, P = NS; WT, ABLV‐luc Untreated vs. MHCII−, ABLV‐luc, Untreated, P = NS. Logrank test with Tukey–Kramer correction for multiple comparisons.
Percent starting body weight over time post‐infection.

- A
Bioluminescence imaging of C57BL/6J and MHCII‐mice infected with 2 × 10⁵ FFU of ABLV‐luc and treated with mAb F11 on day 5 (n = 6 mice/group, except n = 3 Uninfected, Untreated mice).
- B, C
Viral burden was quantified as mean luminescence intensity (MLI) in the spines (B) and brains (C) of infected mice. Insets are same data with reduced y‐axis scale.
- D
Cumulative disease scores were determined by clinical presentation following ABLV‐luc challenge.

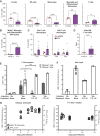
B6 albino mice were infected with 2 × 10⁵ FFU of ABLV‐luc on day 0 and treated with m102.4 (n = 5) or F11 (n = 6) (both at 10 mg/kg) on day 5 post‐infection. Brains were harvested at day 14 except for one brain from an F11‐treated animal harvested on day 15 post‐infection. Animals were injected with a labeled anti‐CD45 antibody just prior to euthanasia to enable exclusion of circulating leukocytes in downstream analyses. Leukocytes were purified from each brain followed by staining, fixation, and flow cytometry analysis, as detailed in Materials and Methods. Graphs show mean percentages of each population. Unpaired t‐test results of m102.4 vs. F11 groups as follows: B cells, **P = 0.0038; NK cells, ****P < 0.0001; monocytes, ***P = 0.0010; microglia/differentiated monocytes, **P = 0.0029. Mann–Whitney test: T cells, *P = 0.0303.
Mean percentages of MHCII+ microglia/differentiated monocytes. Unpaired t‐test, ****P < 0.0001.
Mean percentages of Tcm and Tem populations in CD4 T cells (left) and CD8 T cells (right). All means in (A–C) represent percent of live cells not labeled with the CD45 exclusionary marker.
Ratio of CD4 T cells to CD8 T cells in each group. Mann–Whitney test: T cells, **P = 0.0087.
B6 albino mice were uninfected or infected with 2 × 10⁵ FFU of ABLV‐luc on day 0. Some mice were treated on day 3 or day 7 post‐infection with mAb F11 (10 mg/kg). Brains were harvested at the peak of acute infection in untreated animals (day 13–15), except for the day 3 F11‐treated animal, which was euthanized on day 22, due to reaching euthanasia criteria. Sections of the hindbrain were stained to detect CD3 and CD4, and total numbers of CD4‐pos T cells and CD4‐neg T cells were quantified for each animal (see Materials and Methods). Numbers of CD4‐pos T cells in infected, untreated vs. infected, F11 treated day 7, P = NS. Numbers of CD4‐neg T cells in infected, untreated vs. infected, F11 treated day 7, *P = 0.0135. Unpaired t test with Welch's correction.
qRT‐PCR was used to quantify ABLV‐N mRNAs in brains of the same animals in (E), as a proxy of viral load. ABLV‐N mRNAs were quantified as absolute numbers of transcripts per μg of brain RNA.
qRT‐PCR was used to quantify ABLV‐N (left y‐axis) and IFNγ (right y‐axis) mRNAs in brains of individual animals euthanized at the indicated times post‐ABLV infection. ABLV‐N mRNAs were quantified as in (F), and IFNγ mRNAs were quantified by the ΔΔCT method, expressed as fold‐increase relative to uninfected control animals. Animals were ABLV‐infected and untreated (left) or F11‐treated, day 7 (right).

- A–C
Flow cytometry gating strategy for identification of brain leukocyte populations in mice that were (A) uninfected, (B) ABLV‐luc infected, treated with m102.4 on day 5 and euthanized on day 14 post‐infection, or (C) ABLV‐luc infected, treated with F11 on day 5 and euthanized on day 14 post‐infection.
- D
Animals were treated with m102.4 (n = 5) or F11 (n = 6), and cells were prepared from brains as described in Fig 6A and Materials and Methods. Mean percentages of NK T cells (left) and γδ T cells (right), P = NS for each population by unpaired t‐test and Mann–Whitney test, respectively. Error bars are SEM.
- E
Animals were treated with m102.4 (n = 5) or F11 (n = 6), and cells were prepared from brains as described in Fig 6A and Materials and Methods. Mean percentages of MHCII+ monocytes, P = NS by unpaired t‐test. Error bars are SEM.
- F
Hindbrains from mice of the indicated treatment groups were fixed and sectioned for histology, followed by staining with DAPI, anti‐CD3 and anti‐CD4. Examples of typical staining patterns are shown. *indicates cells positive for CD3 and CD4 (CD4‐pos), ^indicated cells positive for CD3 only (CD4‐neg). Bar, 50 μm.

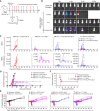
B6 albino mice were infected with 2 × 10⁵ FFU of ABLV‐luc on day 0. On day 5 post‐infection, mice received 10 mg/kg m102.4, F11, or F11(LALA‐PG) (n = 3 mice/group for uninfected; n = 6 mice/group for all others).
Bioluminescence imaging of mice on days 5, 11, 15 and 20 post‐infection, using an IVIS Spectrum CT (Perkin‐Elmer). See Appendix Fig S3 for full series.
Viral burden was quantified as average radiance in spines (top row) and brains (bottom row) of mice. Insets are same data with reduced y‐axis scale, to show detail.
Cumulative disease scores were determined by clinical presentation following ABLV‐luc challenge. The one F11‐treated animal with a persistent disease score of 5 had partial paralysis in the inoculated limb.
Percent starting body weight as an indicator of disease.
Kaplan–Meier survival plot, Logrank test: ABLV‐luc, F11 vs. ABLV‐luc, F11(LALA‐PG), P = 0.0179.
References
-
- Akilesh S, Christianson GJ, Roopenian DC, Shaw AS (2007) Neonatal FcR expression in bone marrow‐derived cells functions to protect serum IgG from catabolism. J Immunol 179: 4580–4588 - PubMed
-
- Albertini AA, Ruigrok RW, Blondel D (2011) Rabies virus transcription and replication. Adv Virus Res 79: 1–22 - PubMed
-
- Allworth A, Murray K, Morgan J (1996) A human case of encephalitis due to a lyssavirus recently identified in fruit bats. Commun Dis Intell 20: 504
Publication types
MeSH terms
Substances
Grants and funding
LinkOut - more resources
Full Text Sources
Medical
Molecular Biology Databases
Research Materials
Miscellaneous

