

CT-based volumetric measures obtained through deep learning: Association with biomarkers of neurodegeneration
- PMID: 37767905
- PMCID: PMC10916947
- DOI: 10.1002/alz.13445
CT-based volumetric measures obtained through deep learning: Association with biomarkers of neurodegeneration
Abstract
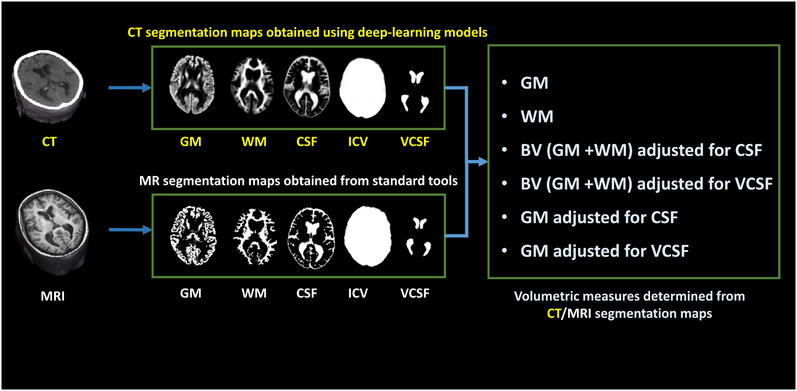
Introduction: Cranial computed tomography (CT) is an affordable and widely available imaging modality that is used to assess structural abnormalities, but not to quantify neurodegeneration. Previously we developed a deep-learning-based model that produced accurate and robust cranial CT tissue classification.
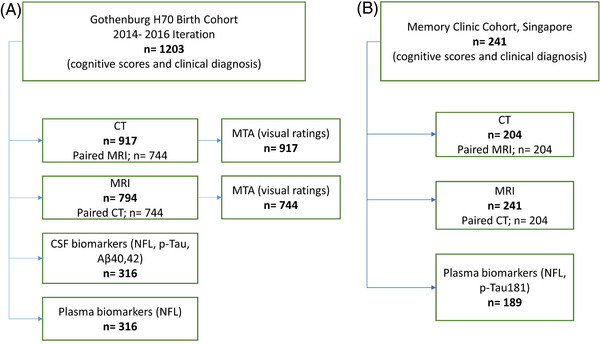
Materials and methods: We analyzed 917 CT and 744 magnetic resonance (MR) scans from the Gothenburg H70 Birth Cohort, and 204 CT and 241 MR scans from participants of the Memory Clinic Cohort, Singapore. We tested associations between six CT-based volumetric measures (CTVMs) and existing clinical diagnoses, fluid and imaging biomarkers, and measures of cognition.
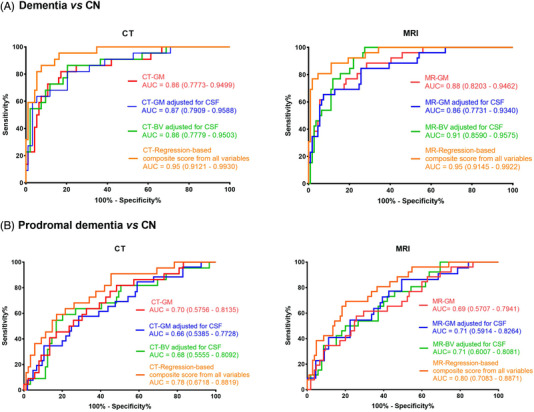
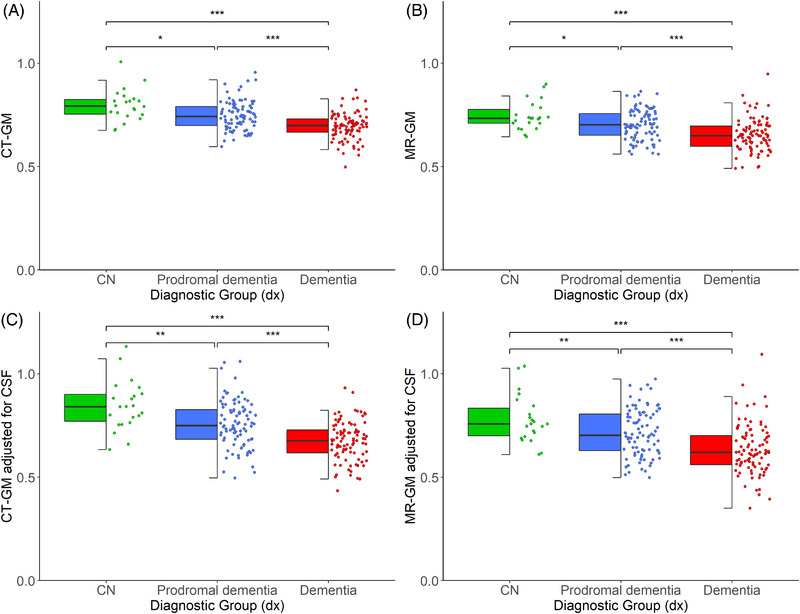
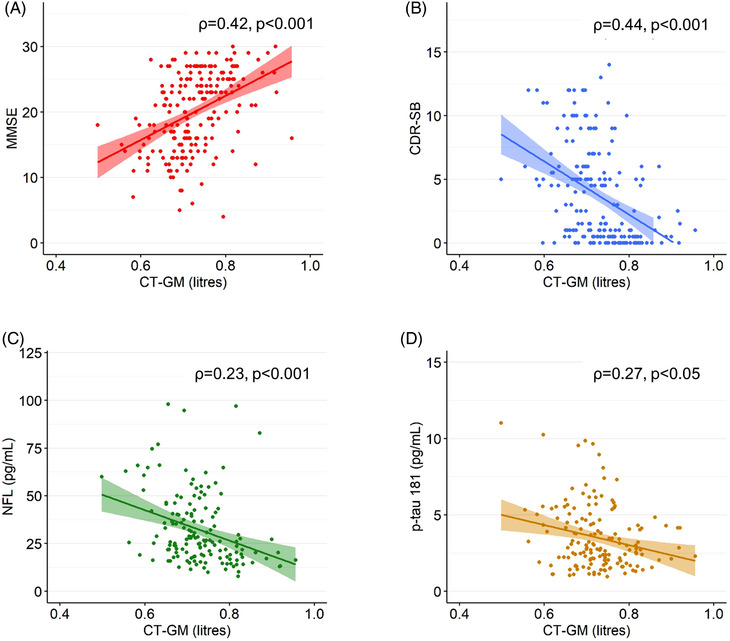
Results: CTVMs differentiated cognitively healthy individuals from dementia and prodromal dementia patients with high accuracy levels comparable to MR-based measures. CTVMs were significantly associated with measures of cognition and biochemical markers of neurodegeneration.
Discussion: These findings suggest the potential future use of CT-based volumetric measures as an informative first-line examination tool for neurodegenerative disease diagnostics after further validation.
Highlights: Computed tomography (CT)-based volumetric measures can distinguish between patients with neurodegenerative disease and healthy controls, as well as between patients with prodromal dementia and controls. CT-based volumetric measures associate well with relevant cognitive, biochemical, and neuroimaging markers of neurodegenerative diseases. Model performance, in terms of brain tissue classification, was consistent across two cohorts of diverse nature. Intermodality agreement between our automated CT-based and established magnetic resonance (MR)-based image segmentations was stronger than the agreement between visual CT and MR imaging assessment.
Keywords: CSF biomarkers; CT; brain segmentation; cognition; deep learning; dementia; plasma biomarkers.
© 2023 The Authors. Alzheimer's & Dementia published by Wiley Periodicals LLC on behalf of Alzheimer's Association.
Conflict of interest statement
H.Z. has served at scientific advisory boards and/or as a consultant for Abbvie, Acumen, Alector, Alzinova, ALZPath, Annexon, Apellis, Artery Therapeutics, AZTherapies, CogRx, Denali, Eisai, Nervgen, Novo Nordisk, Passage Bio, Pinteon Therapeutics, Prothena, Red Abbey Labs, reMYND, Roche, Samumed, Siemens Healthineers, Triplet Therapeutics, and Wave; has given lectures in symposia sponsored by Cellectricon, Fujirebio, Alzecure, Biogen, and Roche; and is a co‐founder of Brain Biomarker Solutions in Gothenburg AB (BBS), which is a part of the GU Ventures Incubator Program (outside submitted work). K.B. served as a consultant at advisory boards and data monitoring committees for Abcam, Axon, Biogen, JOMDD/Shimadzu, Julius Clinical, Lilly, MagQu, Novartis, Prothena, Roche Diagnostics, and Siemens Healthineers, and is also the co‐founder of Brain Biomarker Solutions in Gothenburg AB (BBS), which is a part of the GU Ventures Incubator Program. S.K. has served at scientific advisory boards and/or as a consultant for Geras Solutions and Biogen (outside submitted work). M.S. has served on advisory boards for and receives funding from Roche Diagnostics and Novo Nordisk (outside scope of submitted work). The other authors have no conflicts of interest pertinent to this manuscript. Author disclosures are available in the Supporting Information.
Figures
Similar articles
-
Assessing CT-based Volumetric Analysis via Transfer Learning with MRI and Manual Labels for Idiopathic Normal Pressure Hydrocephalus.medRxiv [Preprint]. 2024 Jun 24:2024.06.23.24309144. doi: 10.1101/2024.06.23.24309144. medRxiv. 2024. PMID: 38978640 Free PMC article. Preprint.
-
Deep learning from MRI-derived labels enables automatic brain tissue classification on human brain CT.Neuroimage. 2021 Dec 1;244:118606. doi: 10.1016/j.neuroimage.2021.118606. Epub 2021 Sep 25. Neuroimage. 2021. PMID: 34571160
-
Longitudinal Associations of Blood Phosphorylated Tau181 and Neurofilament Light Chain With Neurodegeneration in Alzheimer Disease.JAMA Neurol. 2021 Apr 1;78(4):396-406. doi: 10.1001/jamaneurol.2020.4986. JAMA Neurol. 2021. PMID: 33427873 Free PMC article.
-
Neuroimaging in Alzheimer disease: an evidence-based review.Neuroimaging Clin N Am. 2003 May;13(2):197-209. doi: 10.1016/s1052-5149(03)00025-x. Neuroimaging Clin N Am. 2003. PMID: 13677801 Review.
-
Neuroimaging and early diagnosis of Alzheimer disease: a look to the future.Radiology. 2003 Feb;226(2):315-36. doi: 10.1148/radiol.2262011600. Radiology. 2003. PMID: 12563122 Review.
Cited by
-
Pilot implementation of the revised criteria for staging of Alzheimer's disease by the Alzheimer's Association Workgroup in a tertiary memory clinic.Alzheimers Dement. 2024 Nov;20(11):7831-7846. doi: 10.1002/alz.14245. Epub 2024 Sep 17. Alzheimers Dement. 2024. PMID: 39287564 Free PMC article.
-
The diagnostic accuracy of CTseg segmentation software for dementia in a New Zealand memory service.J Alzheimers Dis Rep. 2025 May 21;9:25424823251332448. doi: 10.1177/25424823251332448. eCollection 2025 Jan-Dec. J Alzheimers Dis Rep. 2025. PMID: 40406677 Free PMC article.
-
Assessing CT-based Volumetric Analysis via Transfer Learning with MRI and Manual Labels for Idiopathic Normal Pressure Hydrocephalus.medRxiv [Preprint]. 2024 Jun 24:2024.06.23.24309144. doi: 10.1101/2024.06.23.24309144. medRxiv. 2024. PMID: 38978640 Free PMC article. Preprint.
-
Retinal thickness predicts the risk of cognitive decline over five years.Alzheimers Res Ther. 2024 Dec 23;16(1):273. doi: 10.1186/s13195-024-01627-0. Alzheimers Res Ther. 2024. PMID: 39716304 Free PMC article.
-
Mapping Knowledge Landscapes and Emerging Trends in AI for Dementia Biomarkers: Bibliometric and Visualization Analysis.J Med Internet Res. 2024 Aug 8;26:e57830. doi: 10.2196/57830. J Med Internet Res. 2024. PMID: 39116438 Free PMC article.
References
Publication types
MeSH terms
Substances
Grants and funding
LinkOut - more resources
Full Text Sources
Medical
