. 2023 Dec 12;13(12):2652-2673.
doi: 10.1158/2159-8290.CD-22-1467.

Oncogenic KRAS Drives Lipofibrogenesis to Promote Angiogenesis and Colon Cancer Progression

Affiliations

Oncogenic KRAS Drives Lipofibrogenesis to Promote Angiogenesis and Colon Cancer Progression

Wen-Hao Hsu et al. Cancer Discov. .

Abstract

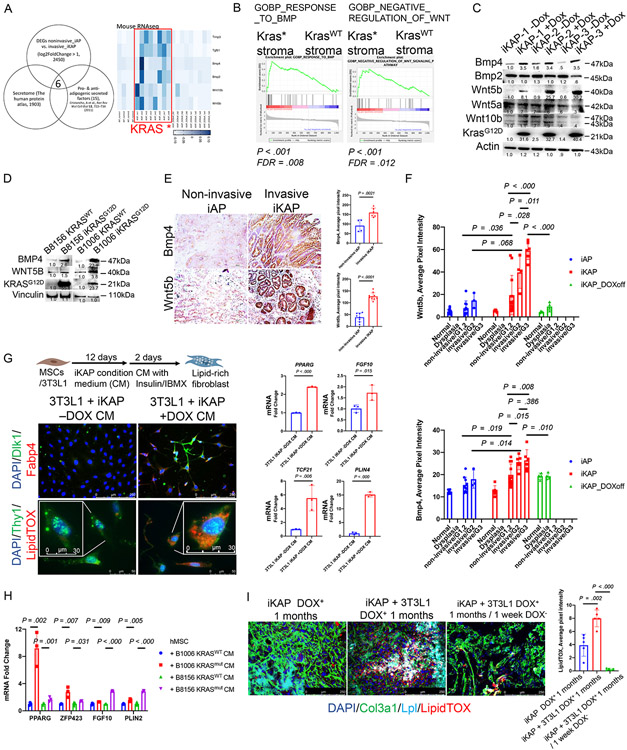
Oncogenic KRAS (KRAS*) contributes to many cancer hallmarks. In colorectal cancer, KRAS* suppresses antitumor immunity to promote tumor invasion and metastasis. Here, we uncovered that KRAS* transforms the phenotype of carcinoma-associated fibroblasts (CAF) into lipid-laden CAFs, promoting angiogenesis and tumor progression. Mechanistically, KRAS* activates the transcription factor CP2 (TFCP2) that upregulates the expression of the proadipogenic factors BMP4 and WNT5B, triggering the transformation of CAFs into lipid-rich CAFs. These lipid-rich CAFs, in turn, produce VEGFA to spur angiogenesis. In KRAS*-driven colorectal cancer mouse models, genetic or pharmacologic neutralization of TFCP2 reduced lipid-rich CAFs, lessened tumor angiogenesis, and improved overall survival. Correspondingly, in human colorectal cancer, lipid-rich CAF and TFCP2 signatures correlate with worse prognosis. This work unveils a new role for KRAS* in transforming CAFs, driving tumor angiogenesis and disease progression, providing an actionable therapeutic intervention for KRAS*-driven colorectal cancer.

Significance: This study identified a molecular mechanism contributing to KRAS*-driven colorectal cancer progression via fibroblast transformation in the tumor microenvironment to produce VEGFA driving tumor angiogenesis. In preclinical models, targeting the KRAS*-TFCP2-VEGFA axis impaired tumor progression, revealing a potential novel therapeutic option for patients with KRAS*-driven colorectal cancer. This article is featured in Selected Articles from This Issue, p. 2489.


Conflict of interest statement

Conflict Of Interest: RAD holds equity as a founder and former advisor and/or director of Tvardi Therapeutics, Asylia Therapeutics, Stellanova Therapeutics and Sporos Bioventures. The work of this study does not relate to these entities.

Figures

Figure 1.
Figure 1.. Lipid–rich CAFs are enriched in Kras* colorectal cancer stroma.
(A) GSEA transcriptomic profiling of iKAP vs. iAP tumors and invasive (Inv) vs. noninvasive (NonInv) tumors shows enriched hallmark pathways. N ≥ 4. Please see Methods “RNA sequencing and analysis” for details of sample collection and characterization of KRAS wild type, KRAS mutation, invasive and non–invasive tumors. Red arrows indicate the adipogenesis pathway. NES, normalized enrichment score. (B) Immunohistochemical staining of lipid droplets (oil red) and immunofluorescence staining of lipid droplets (LipidTOX), CD326 and αSMA in colorectal cancer (CRC) tumors from invasive iKAP and non-invasive iAP genetically engineered mouse (GEM) models. Please see Methods for details of sample collection of invasive iKAP and non–invasive iAP tumors. Red arrows indicate lipid droplets. Scale bar, 100 μm and 250 μm; N = 6 biological replicates. (C) The quantification of LipidTOX staining intensity in non-invasive iAP and invasive iKAP tumors (upper panel). N = 5 biological replicates. The percentages of CD326/CD45/CD31/CD140a+/LipidTOX+ cells in non–invasive iAP and invasive iKAP tumors determined using flow cytometry analysis (lower panel). N = 5 biological replicates. Data represent mean ± SD. Student's t test. (D) Immunohistochemical analysis of lipid droplets, non-myofibroblast (PDFGRα) and adipocyte (LPL) genes in CRC tumors from invasive iKAP and non–invasive iAP GEM models. Scale bar, 50 μm; N = 3 biological replicates. (E) Immunofluorescence staining of lipid droplets, αSMA, and PDGFRα in moderate grade (G2) and high grade (G3) invasive iKAP and iAP tumors (grade scored by GI pathologist; blinded) (left panel). White rectangles indicate the enlarged area presented in the lower images. Red arrows indicate the co-staining of PDGFRα and lipid droplet. Scale bar, 250 μm. Quantification of LipidTOX at different tumor status (right panel). N ≥ 3 biological replicates. Data represent mean ± SD. Student's t test. (F) Adipocyte and pre-adipocyte genes’ module score plots of invasive iKAP, non-invasive iAP, and non-invasive iKAP_DOXoff tumor stroma subgroups as determined using the Seurat's AddModuleScore function. Please see Methods “Single cell RNA sequencing and analysis of mouse and human CRC” for details of obtaining module score plots. The percentage of fibroblasts that express classical markers and regulators of pre-/mature adipocytes in tumor stroma (lower right panel). N = 3 biological replicates. Data represent mean ± SD. Student's t test. (G) CAF marker gene expression levels in CD326/CD45/CD31/PDGFRα+/LipidTOX+–sorted cells and CD326/CD45/CD31/PDGFRα+/LipidTOX –sorted/cultured myofibroblasts. See Methods for lipid–rich fibroblasts and lipid–sparse fibroblasts (myofibroblasts) collection. N = 3 biological replicates. Data represent mean ± SD. Student's t test. (H) Proportion of αSMA lipid–rich CAF subgroups (the combination of 4 αSMA CAF subgroups, the combination of inflammatory and PI16+ CAF subgroups, and αSMA+ myofibroblasts) in invasive iKAP, non-invasive iAP, and non-invasive iKAP_DOXoff tumor stroma cells. N = 3 biological replicates. Data represent mean ± SD. Student's t test.
Figure 2.
Figure 2.. Kras* upregulates proadipogenic cytokines and drives lipofibrogenesis.
(A) Venn diagram of the putative secretome that is regulated by KRAS* and modulates adipogenesis (left panel). Heatmap representation of the pro- and anti-adipogenic cytokine candidate gene expression in iAP, iKAP, and iKAP_DOXoff colorectal cancer (CRC) in the bulk RNA sequencing data set. Blue and white indicate high and low expression, respectively. The red rectangle represents the iKAP group with high expression of pro- and anti-adipogenic cytokine genes. (B) GSEA enrichment plots showing the negative regulation of Wnt and the response to Bmp4 signaling in an scRNAseq data set from iKAP and iKAP_DOXoff CRC tumor stroma. FDR, false discovery rate; GOBP, Gene Ontology Biological Process; WT, wild type. (C) Immunoblots of Bmp and Wnt family proteins in the cell lysates of iKAP cell lines with or without DOX supplementation to express Kras*. (D) Immunoblots of BMP4 and WNT5B in the cell lysates of 2 PDXOs (B8156 and B1006) with or without DOX supplementation to induce KRASG12D expression. (E) Immunohistochemical staining (left panel) and quantification (right panel) of Wnt5b and Bmp4 in non-invasive iAP and invasive iKAP tumors. Scale bar, 100 μm; n ≥ 4 biological replicates. Data represent mean ± SD. Student's t test. (F) Quantification of Wnt5b and Bmp4 expression levels in high–, moderate– and low–grade invasive and non–invasive iKAP and iAP tumors (grade scored by GI pathologist; blinded). N ≥ 3 biological replicates. Data represent mean ± SD. Student's t test. (G) Schematic diagram of CM co-cultured experiments (upper panel) to demonstrate the impact of iKAP CM on lipid-rich fibroblast differentiation. (See Methods for cell culture details.) Immunofluorescence staining of lipid droplets, THY1, and DLK1 (lower panel) and quantification of lipid–rich CAF genes using quantitative reverse transcription polymerase chain reaction (RT–qPCR; right panel) in iKAP conditioned medium (CM)–educated 3T3L1 cells. Scale bar, 250 μm, 50 μm, and 30 μm; n = 3 biological replicates. IBMX, 3–isobutyl–1–methylxanthine; MSCs, mesenchymal stem cells. Data represent mean ± SD. Student's t test. (H) RT–qPCR quantification of lipid–rich CAF genes in PDXO Kras* CM–educated hMSCs. N = 3 biological replicates. Data represent mean ± SD. Student's t test. (I) Immunofluorescence analysis of lipid droplets, Col3a1, and Lpl in subcutaneous iKAP tumors and tumors generated by co–injecting iKAP cell lines and 3T3L1 into nude mice. Scale bar, 250 μm. Quantification of LipidTOX intensity (right panel). N = 5 biological replicates. Data represent mean ± SD. Student's t test.
Figure 3.
Figure 3.. Lipid–rich CAFs drive tumor progression.
(A) Schematic diagram of orthotopic co–injection experiments in mice. See Methods “Flow cytometry and sorting” for details. (B) Immunofluorescence staining of lipid droplets and PDGFRα in Lipid+ CAFs (CD326/CD45/CD31, PDGFRα+/LipidTOX+ sorted cells) and Lipid- CAFs (PDGFRα/LipidTOX sorted and cultured cells). N = 6 biological replicates. CAFs, cancer–associated fibroblasts. (C) Tumors generated by orthotopic co–injection in cecum of lipid–rich CAFs or lipid–sparse CAFs (myofibroblasts) with iKAP cell line (left panel) at 4 weeks. Quantification of tumor size (right panel). N = 5 biological replicates. Data represent mean ± SD. Student's t test. (D) Orthotopic co-injection of lipid–rich CAFs and the iKAP cell line decreases overall survival in mice. N ≥ 5 biological replicates. Log–rank (Mantel–Cox) test. (E) Immunofluorescence staining of lipid droplets, αSMA, and CD326 in tumors shown in Fig. 3C (left panel). Quantification of LipidTOX and αSMA (right panel). N ≥ 5 biological replicates. Data represent mean ± SD. Student's t test. (F) Survival of colorectal cancer patients with high vs. low gene set variation analysis scores for lipid–rich CAF gene signatures (data from The Cancer Genome Atlas– Colon adenocarcinoma). See Supplementary Table S2 for Lipid–rich CAF gene signatures. The median lipid-rich CAF GSVA score was used as cut-off to define high and low groups. Log–rank (Mantel–Cox) test.
Figure 4.
Figure 4.. KRAS* regulates pro–adipogenesis cytokines through TFCP2.
(A) Venn diagram of the putative transcription factors (TFs) that bind to the consensus motifs on promoters of pro–adipogenic cytokines as well as candidates from GSEA of TF signatures enriched in KRAS* tumors (left panel). The gene lists of these 3 datasets are provided in Supplementary Table S3. The TF signatures enriched in KRAS* tumors in a genetically engineered mouse (GEM) model (middle panel). Enrichment plot of TFCP2 and SRY gene signatures in iKAP tumors (right panel). CP2, TFCP2; FDR, false discovery rate. (B) Immunoblots of pro–adipogenic cytokines BMP4 and WNT5B, and TFCP2 in TFCP2–knockout and rescued iKAP cell lines. (C) Chromatin immunoprecipitation–quantitative polymerase chain reaction (ChIP–qPCR) analysis of WNT5B and BMP4 promoter sequences on the TFCP2 binding elements. N = 3 biological replicates. Data represent mean ± SD. Student's t test. (D) Cell type correlations in high TFCP2–regulated gene signature (GSEA, C3 TFT) gene set variation analysis (GSVA) scores of TCGA–COAD patient cohort. NES, normalized enrichment score. (E) Immunofluorescence staining of lipid droplets, LPL, and COL3a1 in TFCP2–knockout and rescued tumors. Scale bar, 100 μm; n = 5 biological replicates. (F) Percentages of CD326/CD45/CD31/CD140a+/LipidTOX+ –sorted cells in TFCP2–knockout and rescued tumors from Fig. 4E. N = 3 biological replicates. Data represent mean ± SD. Student's t test. (G) Tumors generated by xenograft implantation of TFCP2–knockout and rescued iKAP cell lines into nude mice in 1 month (left panel). Quantification of tumor burdens (right panel). N = 3 biological replicates. Data represent mean ± SD. Student's t test. (H) TCGA–COAD tumor stages and survival in high vs. low GSVA scores of TFCP2–regulated gene signatures. The median TFCP2 GSVA score was used as cut-off to define high and low groups. Chi-square test for tumor stages and Log–rank (Mantel–Cox) test for survival analyses. (I) RT–qPCR validation of pro–adipogenic cytokine genes in FQI1–treated iKAP cell lines in vitro. N = 3 biological replicates. Data represent mean ± SD. Student's t test. (J) Immunofluorescence staining of lipid droplets and Col3a1 (left panel) and percentages of CD326/CD45/CD31/CD140a+/LipidTOX+ –sorted cells in FQI1–treated iKAP tumors (right panel). Scale bar, 250 μm; N = 3 biological replicates. Data represent mean ± SD. Student's t test. (K) Kaplan–Meier survival curves of iKAP mice treated with FQI1 or vehicle. TAM, tamoxifen. Log–rank (Mantel–Cox) test.
Figure 5.
Figure 5.. Lipid–rich CAFs secrete VEGFA to promote tumor angiogenesis.
(A) Transcriptomic profiling of high vs. low gene set variation analysis (GSVA) scores of lipid–rich CAF gene signatures in mouse bulk RNA sequencing dataset. Upper panel shows the enriched hallmark pathways and lower panel shows the correlated cell types in KRAS* tumors as determined by GSEA. FDR, false discovery rate. (B) Heatmap representation the expression of the endothelial cell gene set in high vs. low lipid–rich CAF GSVA scores in mouse bulk tumor RNA sequencing dataset (left panel). Expression of the endothelial cell gene set in non-invasive iAP vs invasive iKAP bulk tumor RNA sequencing dataset (right panel). Blue and white indicate high and low expression, respectively. (C) Adipokine array of cell lysates from Kras*(+DOX)– and Kraswt(−DOX)– conditioned medium (CM)–educated embryonic fibroblasts (3T3L1). (D) Adipokine candidate gene expression in the stroma of iKAP, iAP, and iKAP_DOX–off tumors using scRNA–seq. The average expression color scale was from 1 to −1. The dot size represents the proportion of expressing cells in each group. N = 3 biological replicates. (E) RT–qPCR validation of targeted adipokines, VEGFA, PTX3 and HGF, in DLD1KRASG12D CM–educated hMSCs. N = 3 biological replicates. Data represent mean ± SD. Student's t test. (F) Immunohistochemical staining of VEGFA and CD31 in iAP and iKAP tumors. Representative images (left) and quantification (upper right). Scale bar, 100 μm; N ≥ 3 biological replicates. Flow analysis of CD326/CD45/CD31+ endothelial cells in iAP and iKAP tumors (lower right). N = 3 biological replicates. Data represent mean ± SD. Student's t test. (G) The tube or capillary–like shapes of the HUVEC co-cultured with CM of DLD1KRASG12D CM–educated hMSCs. See Methods “Angiogenesis assay” for details. Representative images (left) and quantification (right). Scale bar, 100 μm; N = 3 biological replicates. Data represent mean ± SD. Student's t test. (H) Immunohistochemical staining of VEGFA and CD31 in TFCP2–knockout and rescued iKAP tumors. N ≥ 3 biological replicates. Data represent mean ± SD. Student's t test. (I) Immunohistochemical staining of VEGFA and CD31 in FQI1–treated iKAP tumors. Representative images (left) and quantification (upper right). Scale bar, 50 μm; N = 3 biological replicates. Flow analysis of CD326/CD45/CD31+ endothelial cells in FQI1–treated iKAP tumors (lower right). N = 3 biological replicates. (J) Kaplan–Meier survival curves of high vs. low VEGFA expression (left) and high vs. low VEGFA expression plus TFCP2 GSVA score (right) in TCGA-COAD data from cBioPortal. VEGF high and low were defined using 50% cut-off of the RNA expression levels. VEGF/TFCP2 GSVA score ≥ 4th quantile was defined as high group and ≤ 1st quantile as low group. Log–rank (Mantel–Cox) test. (K) Kaplan–Meier survival curves of iKAP mice treated with FQI1 and/or Vegfa monoclonal antibody treatment (single and combination). Log–rank (Mantel–Cox) test.

References

    1. Li J, Ma X, Chakravarti D, Shalapour S, and DePinho RA (2021). Genetic And Biological Hallmarks Of Colorectal Cancer. Genes Dev 35, 787–820. 10.1101/gad.348226.120. - DOI - PMC - PubMed
    1. Siegel RL, Miller KD, Fuchs HE, and Jemal A (2022). Cancer Statistics, 2022. CA Cancer J Clin 72, 7–33. 10.3322/caac.21708. - DOI - PubMed
    1. Manfredi S, Lepage C, Hatem C, Coatmeur O, Faivre J, and Bouvier AM (2006). Epidemiology And Management Of Liver Metastases From Colorectal Cancer. Ann Surg 244, 254–259. 10.1097/01.sla.0000217629.94941.cf. - DOI - PMC - PubMed
    1. Wood LD, Parsons DW, Jones S, Lin J, Sjoblom T, Leary RJ, et al. (2007). The Genomic Landscapes Of Human Breast And Colorectal Cancers. Science 318, 1108–1113. 10.1126/science.1145720. - DOI - PubMed
    1. Li HT, Lu YY, An YX, Wang X, and Zhao QC (2011). Kras, Braf And Pik3ca Mutations In Human Colorectal Cancer: Relationship With Metastatic Colorectal Cancer. Oncol Rep 25, 1691–1697. 10.3892/or.2011.1217. - DOI - PubMed

Publication types