. 2023 Sep 28;80(10):307.
doi: 10.1007/s00018-023-04955-w.

N4-acetylcytidine of Nop2 mRNA is required for the transition of morula-to-blastocyst

Affiliations

N4-acetylcytidine of Nop2 mRNA is required for the transition of morula-to-blastocyst

Mengyun Wang et al. Cell Mol Life Sci. .

Abstract

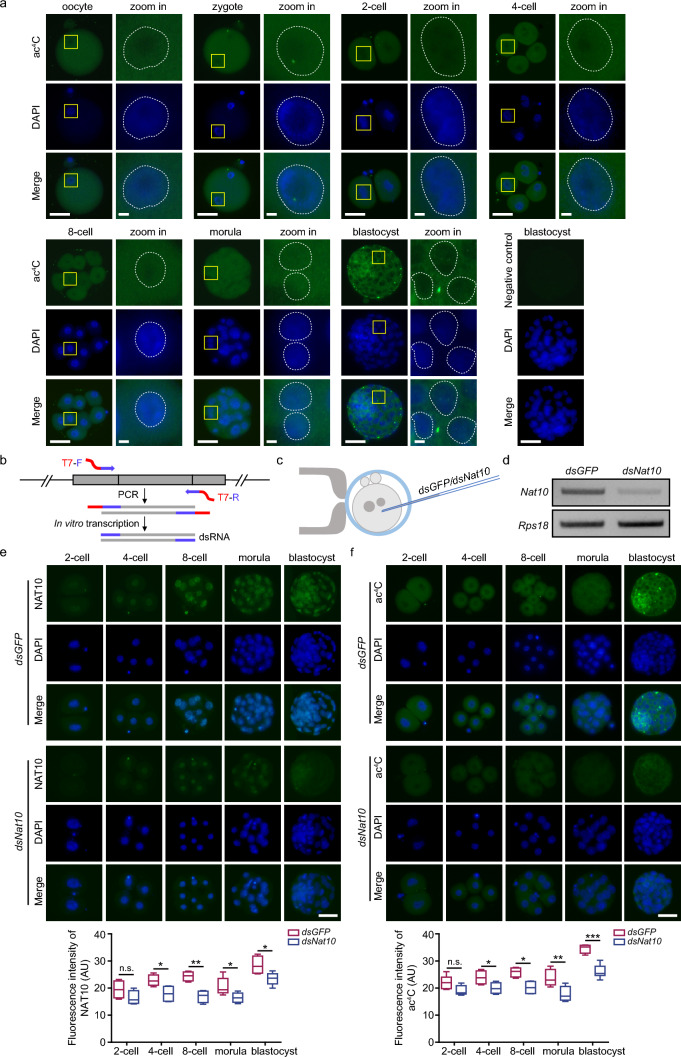
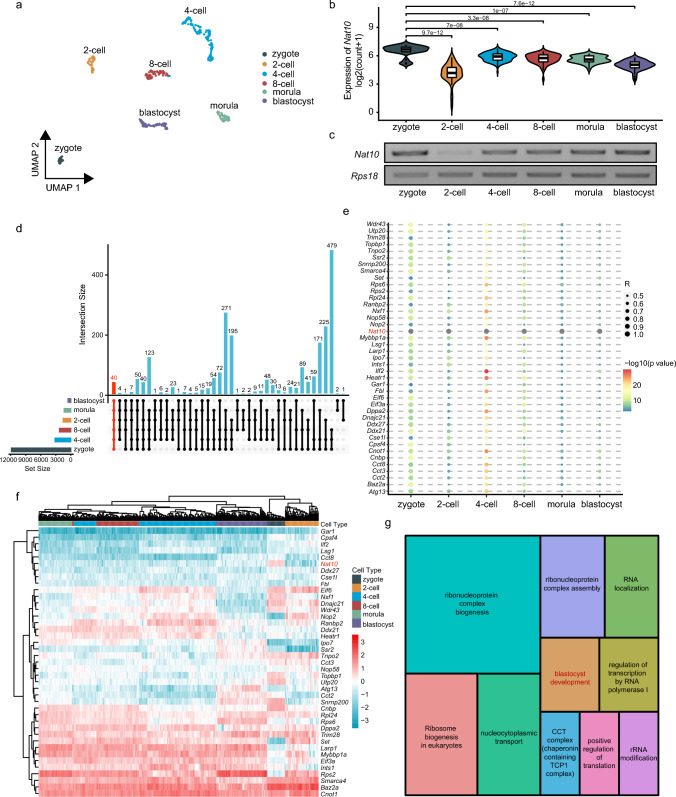
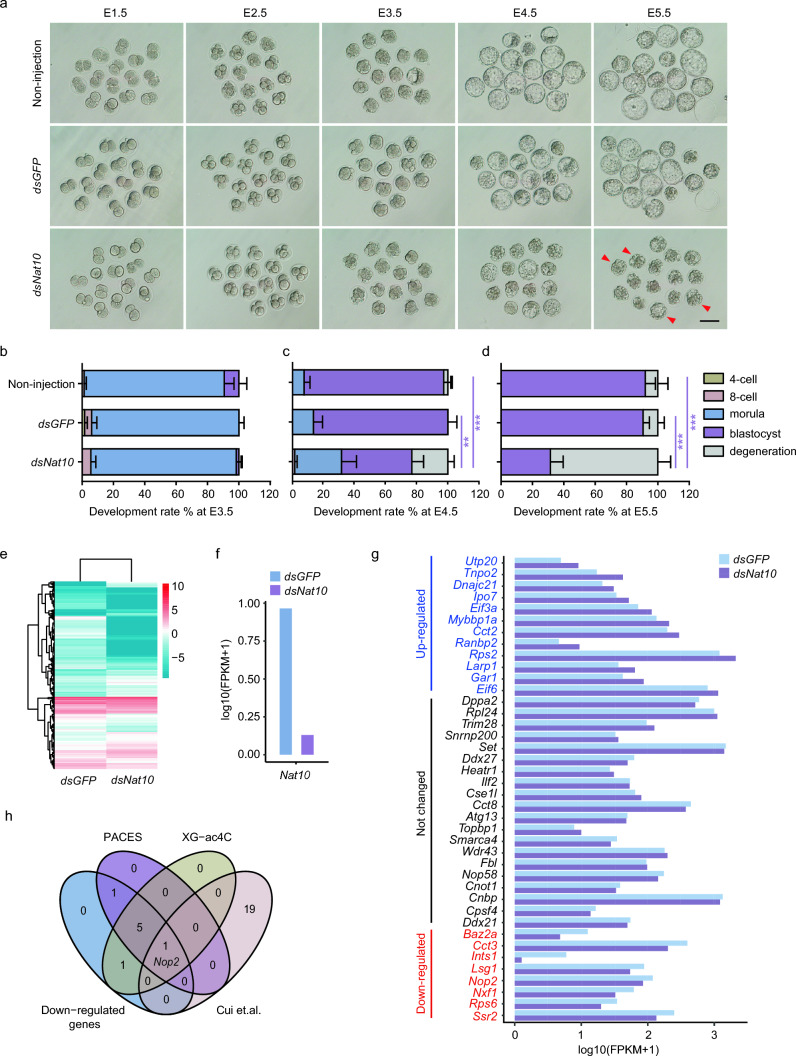
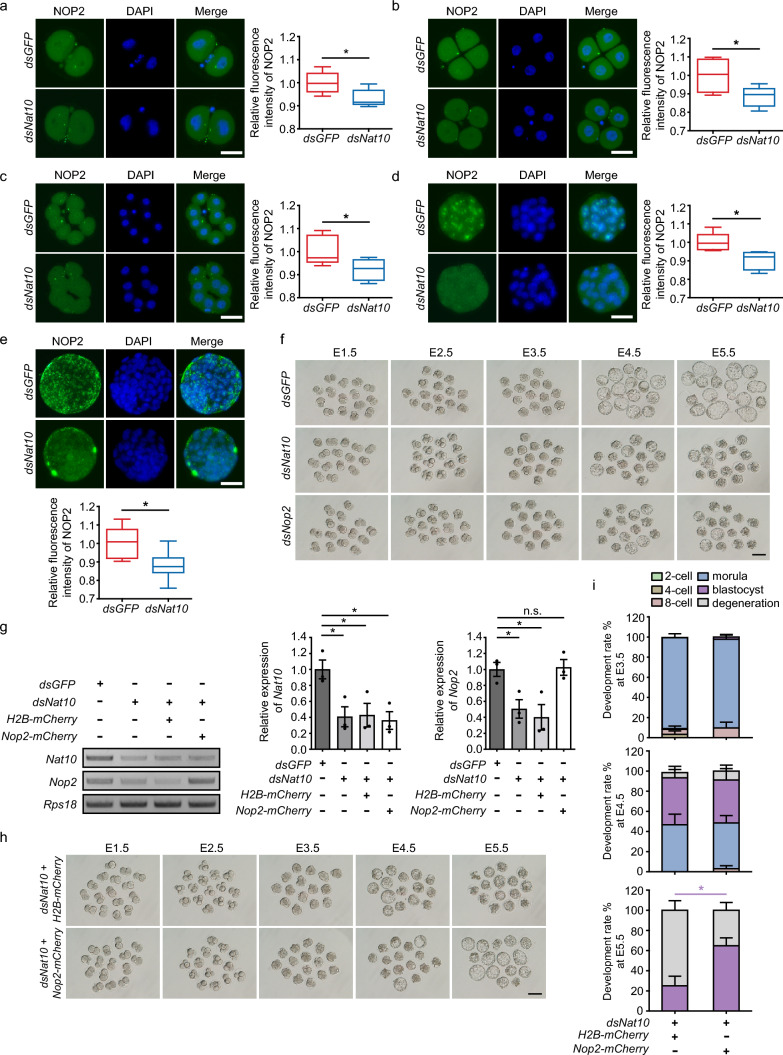
N-acetyltransferase 10 (NAT10)-mediated N4-acetylcytidine (ac4C) modification is crucial for mRNA stability and translation efficiency, yet the underlying function in mammalian preimplantation embryos remains unclear. Here, we characterized the ac4C modification landscape in mouse early embryos and found that the majority of embryos deficient in ac4C writer-NAT10 failed to develop into normal blastocysts. Through single-cell sequencing, RNA-seq, acetylated RNA immunoprecipitation combined with PCR (acRIP-PCR), and embryonic phenotype monitoring, Nop2 was screened as a target gene of Nat10. Mechanistically, Nat10 knockdown decreases the ac4C modification on Nop2 mRNA and reduces RNA and protein abundance by affecting the mRNA stability of Nop2. Then, depletion of NOP2 may inhibit the translation of transcription factor TEAD4, resulting in defective expression of the downstream lineage-specific gene Cdx2, and ultimately preventing blastomeres from undergoing the trophectoderm (TE) fate. However, exogenous Nop2 mRNA partially reverses this abnormal development. In conclusion, our findings demonstrate that defective ac4C modification of Nop2 mRNA hinders the morula-to-blastocyst transition by influencing the first cell fate decision in mice.

Keywords: Blastocyst formation; Development; Mouse; Preimplantation embryos; RNA modification.


Conflict of interest statement

The authors declare that they have no competing interests.

Figures

Fig. 1
Fig. 1
Distribution of NAT10-mediated ac4C modification in mouse preimplantation embryos. a Immunofluorescence staining of ac4C (green) and DAPI (blue) in mouse oocytes (n = 7) and preimplantation embryos (n = 8, 13, 17, 17, 15, 22 for zygote, 2-cell, 4-cell, 8-cell, morula, and blastocyst stages from three biological replicates). The yellow frames indicate the area to zoom in, and the white dotted lines indicate the boundary between the nucleus and the cytoplasm. PBS containing 0.1% Triton X-100 was used as a negative control. Scale bar, 50 μm (whole embryo) and 5 μm (zoom in). b Schematic diagram of dsRNA preparation. Gray rectangles, purple thick lines, and red thick lines indicate exons, gene-specific primers, and T7 promoter sequences, respectively. c Schematic diagram of cytoplasmic microinjection in zygote. The final injection concentration of dsGFP or dsNat10 is 2.5 μg/μL. d RT-PCR verification of dsNat10 knockdown efficiency in morulae. dsGFP as the negative control. e, f Immunofluorescence analysis of NAT10 (e) or ac4C (f) in Nat10-depleted preimplantation embryos (n = 15 for each group from three biological replicates). The fluorescence intensity (mean) was calculated by the ratio of Integrated Density to Area. Scale bar, 50 μm. Boxplots showing the fluorescence intensity of NAT10 (e) or ac4C (f) in dsRNA-injected preimplantation embryos, respectively. The middle lines indicate the median, and the boxes indicate the 25th/75th percentiles. *P < 0.05; **P < 0.01; ***P < 0.001; n.s. no significance (two-sided Student′s t-test). AU arbitrary units
Fig. 2
Fig. 2
Nat10 is involved in blastocyst formation in mice. a UMAP projection of single-cell RNA sequencing for mouse preimplantation embryos. Each dot corresponds to one blastomere and is colored according to developmental stage. b Violin plot showing the differential expression of Nat10 from the zygote to blastocyst stages. c RT-PCR analysis of Nat10 in different developmental stages of preimplantation embryos. d Upset plot showing the distribution of genes correlated with Nat10 expression, 40 of which intersect at six developmental periods. e Bubble plot indicating the genes strongly correlated with Nat10. The size and color of each bubble correspond to correlations and -log10 (P value), respectively. f Hierarchical clustering of the genes correlated with Nat10. g Treemap of condensed gene ontology (GO) terms for Nat10-correlated genes. The size of each box indicates the number of significant terms associated with the GO category
Fig. 3
Fig. 3
Nat10 depletion arrests morula-to-blastocyst transition. a Representative images of preimplantation embryos in the non-injection, dsGFP-, and dsNat10-injected groups (five biological replicates). Red arrowheads denote degenerating blastocysts. Scale bar, 100 μm. b–d Statistics of development rate among the three groups. There was no difference in embryo development at E3.5 (b), but the blastocyst formation rate of Nat10-depleted embryos was significantly reduced at E4.5 (c) and E5.5 (d). Error bars indicate the SEM in five biological replicates. **p < 0.01; ***p < 0.001 (one-way ANOVA). e Heatmap showing the DEGs between dsGFP- and dsNat10-injected morulae. f The expression of Nat10 in RNA-Seq data. g Bar plot presenting the expression changes of 40 genes correlated with Nat10 expression in Nat10-depleted morulae. h Four-way Venn diagram for screening the potential target genes of Nat10. Down-regulated genes, the 8 genes in (g); PACES, the number of potential ac4C modification genes predicted by PACES software (among 8 down-regulated genes); XG-ac4C, the number of potential ac4C modification genes predicted by XG-ac4C software (among 8 down-regulated genes); Cui et al., 20 genes that are necessary for mouse blastocyst formation [22]
Fig. 4
Fig. 4
Nop2 is a target gene of Nat10 in mouse preimplantation embryos. a Potential sites for ac4C modification in mouse Nop2 mRNA, which were named Nop2-1 and Nop2-2 in sequence from 5' to 3'. Gray and black rectangles indicate the CDS and UTRs of Nop2, respectively. The colored bold vertical lines represent the primers of acRIP-PCR. b RT-PCR analyses of Nat10 and Nop2 in F9 cells transfected with siRNA. The RT-PCR data were normalized to the expression of Rps18. c Schematic presentation of the pMIR-Report luciferase reporters containing wild type and mutant CDS of Nop2 mRNA. WT, wide‐type; Mut, mutation. d Wild-type or mutant ac4C sites were cloned into a pMIR-Report vector and transfected into siRNA-treated F9 cells to perform dual-luciferase reporter assays. Firefly luciferase activity was measured and normalized to that of Renilla luciferase activity. ef The mRNA stability and expression of Nop2 were detected by qRT-PCR in F9 cells (e) or morulae (f) treated with 5 μg/mL ActD. g Flow chart of acRIP-PCR. h Detection of ac4C modification sites on Nop2 mRNA in wild-type F9 cells and mouse morulae. i-j NAT10-mediated ac4C modification in Nop2 mRNA in F9 cells (i) and mouse morulae (j) was confirmed by acRIP-PCR. The enrichment of ac4C in each RIP group was normalized according to the results of the input group. For b, df, i,and j, error bars indicate the SEM in three biological replicates. *P < 0.05; **P < 0.01; ***P < 0.001; n.s. no significance (two-sided Student’s t-test)
Fig. 5
Fig. 5
Nop2 partially reverses morula arrest caused by Nat10 depletion. a–e Immunofluorescence analysis of NOP2 in 2-cell (a), 4-cell (b), 8-cell (c), morulae (d), and blastocysts (e) derived from zygotes injected with dsRNA (n = 15 for each group from three biological replicates). Scale bar, 50 μm. Boxplot charts showing the effect of Nat10 depletion on the expression of NOP2 protein in preimplantation embryos. The mean fluorescence intensity in dsNat10-injected embryos was measured and normalized to the mean fluorescence intensity in dsGFP-injected embryos. The middle lines indicate the median, and the boxes indicate the 25th/75th percentiles. *P < 0.05. f Representative images of preimplantation embryos injected with dsGFP, dsNat10, or dsNop2 from E1.5 to E5.5 (three biological replicates). Similar to Nat10 knockdown, most Nop2-depleted embryos are arrested at the morula stage. Scale bar, 100 μm. g RT-PCR results confirmed that exogenous Nop2 RNA increased Nop2 mRNA in Nat10-depleted morulae. The relative expression was normalized to the expression of Rps18. h Representative images of rescue with exogenous Nop2 RNA for abnormal development caused by Nat10 depletion. Scale bar, 100 μm. i Statistics of development rate. There were no differences in the developmental potential of embryos between the groups at E3.5 or E4.5; but at E5.5, the blastocyst formation rate of Nat10-depleted embryos was significantly increased after Nop2 RNA co-injection. For g and i, error bars indicate the SEM in three biological replicates. P values were determined by one-way ANOVA (g) or two-sided Student′s t-test (i). *p < 0.05; n.s. no significance
Fig. 6
Fig. 6
Nop2 depletion mediated by NAT10 knockdown affects the first cell fate decision. a, b Immunofluorescence analysis of CDX2 (a) and TEAD4 (b) in morulae and blastocysts derived from zygotes injected with dsGFP, dsNop2, or dsNat10 (n = 15 for morula, n = 20 for blastocyst). Scale bar, 50 μm. c The numbers of total, TE, and ICM cells in blastocysts derived from zygotes injected with dsRNA (n = 20 for each group). d Schematic overview. RNA mixture (dsGFP and H2B-mCherry, dsNop2 and H2B-mCherry, or dsNat10 and H2B-mCherry) was injected randomly into single blastomeres of 2-cell embryos, and the distribution of mCherry- and CDX2-positive blastomeres was analyzed at the morula and the blastocyst stages. e Immunofluorescence analysis of CDX2 (green) and mCherry (red) in morulae (top, n = 15) and blastocysts (bottom, n = 20) prepared according to schematic (d). Scale bar, 50 μm. White arrowheads denote blastomeres with reduced expression of CDX2 after injection with dsNat10 or dsNop2. White dotted lines indicate ICM. f The numbers of total, TE, and ICM cells in blastocysts (n = 20) prepared according to schematic (d). g Percentage of cells derived from blastomeres that were not injected or injected with RNA mixture (dsGFP and H2B-mCherry, dsNop2 and H2B-mCherry, or dsNat10 and H2B-mCherry) in the TE (top) and ICM (bottom) cells. Nat10 or Nop2 depletion significantly reduced the contribution of blastomeres to TE, but hardly affected the contribution to ICM. For (a, b, and e), boxplots showing the relative fluorescence intensity of CDX2 (a, e) and TEAD4 (b) from three biological replicates, and the mean fluorescence intensity was measured and normalized to the mean fluorescence intensity in dsGFP-injected embryos (a, b) or non-injection blastomeres (e). The middle lines indicate the median, and the boxes indicate the 25th/75th percentiles. For c, f, and g, error bars represent the SEM in three biological replicates. P values were determined by one-way ANOVA (a-c, f, g) or two-sided Student′s t-test (e). *P < 0.05; **P < 0.01; ***P < 0.001; n.s. no significance
Fig. 7
Fig. 7
Exogenous Nop2 increases the contribution of Nat10-depleted blastomeres to TE. a Schematic overview. The cytoplasm of zygotes was first injected with dsNat10, then H2B- or Nop2-mCherry was injected into either blastomere after embryos developed to the 2-cell stage. The distribution of mCherry- and CDX2-positive blastomeres was analyzed at the morula and the blastocyst stages. b, c Immunofluorescence analysis of CDX2 (green) and mCherry (red) in morulae (b, n = 15) and blastocyst (c, n = 20) prepared according to schematic (a). Scale bar, 50 μm. White arrowheads show that Nop2 RNA increased the expression of Cdx2 in Nat10-depleted blastomeres (b, c). White dotted lines indicate ICM (c). d The numbers of total, TE, and ICM cells in blastocysts derived from embryos subjected to two microinjections (n = 20). e Percentage of cells derived from blastomeres that were not injected or injected with H2B-/Nop2-mCherry in the TE (left) and ICM (right) cells. Exogenous Nop2 significantly increased the contribution of Nat10-depleted blastomeres to TE, but hardly affected the contribution to ICM. f RT-PCR analysis of Nat10, Nop2, Tead4, Yap1, Cdx2, and Gata3 expression in morulae derived from zygotes injected with dsGFP, dsNat10, dsNop2, or dsNat10 + Nop2-mCherry. Bar charts showing the relative expression of genes, which were normalized to the expression of Rps18. g Immunofluorescence analysis of TEAD4 (green) in morulae and blastocysts derived from zygotes injected with the mixture of dsNat10 and H2B-mCherry or dsNat10 and Nop2-mCherry (n = 15 for each group). Exogenous Nop2 increased the TEAD4 protein abundance in Nat10-depleted embryos, especially at the morula stage. Scale bar, 50 μm. For b, c, and g, boxplots showing the relative fluorescence intensity of CDX2 (b, c) and TEAD4 (g) in blastomeres from three biological replicates. The mean fluorescence intensity was measured and normalized to the mean fluorescence intensity in non-injection blastomeres (b, c) or dsNat10 + H2B-mCherry embryos (g). The middle lines indicate the median, and the boxes indicate the 25th/75th percentiles. For d-f, error bars represented the SEM in three biological replicates. P values were determined by one-way ANOVA (f) or two-sided Student′s t-test (b-e, g). *P < 0.05; **P < 0.01; ***P < 0.001; n.s. no significance

Similar articles

Cited by

References

    1. Watson AJ, Natale DR, Barcroft LC. Molecular regulation of blastocyst formation. Anim Reprod Sci. 2004;82–83:583–592. doi: 10.1016/j.anireprosci.2004.04.004. - DOI - PubMed
    1. Fleming TP, Pickering SJ. Maturation and polarization of the endocytotic system in outside blastomeres during mouse preimplantation development. J Embryol Exp Morphol. 1985;89:175–208. - PubMed
    1. Johnson MH, McConnell JM. Lineage allocation and cell polarity during mouse embryogenesis. Semin Cell Dev Biol. 2004;15:583–597. doi: 10.1016/j.semcdb.2004.04.002. - DOI - PubMed
    1. Johnson MH, Ziomek CA. Cell interactions influence the fate of mouse blastomeres undergoing the transition from the 16- to the 32-cell stage. Dev Biol. 1983;95:211–218. doi: 10.1016/0012-1606(83)90019-2. - DOI - PubMed
    1. Dahl JA, Jung I, Aanes H, et al. Broad histone h3k4me3 domains in mouse oocytes modulate maternal-to-zygotic transition. Nature. 2016;537:548–552. doi: 10.1038/nature19360. - DOI - PMC - PubMed

MeSH terms