. 2023 Oct;20(6):1859-1874.
doi: 10.1007/s13311-023-01443-8. Epub 2023 Sep 28.

Recombinant Erythropoietin Induces Oligodendrocyte Progenitor Cell Proliferation After Traumatic Brain Injury and Delayed Hypoxemia

Affiliations

Recombinant Erythropoietin Induces Oligodendrocyte Progenitor Cell Proliferation After Traumatic Brain Injury and Delayed Hypoxemia

Kirill Shumilov et al. Neurotherapeutics. 2023 Oct.

Abstract

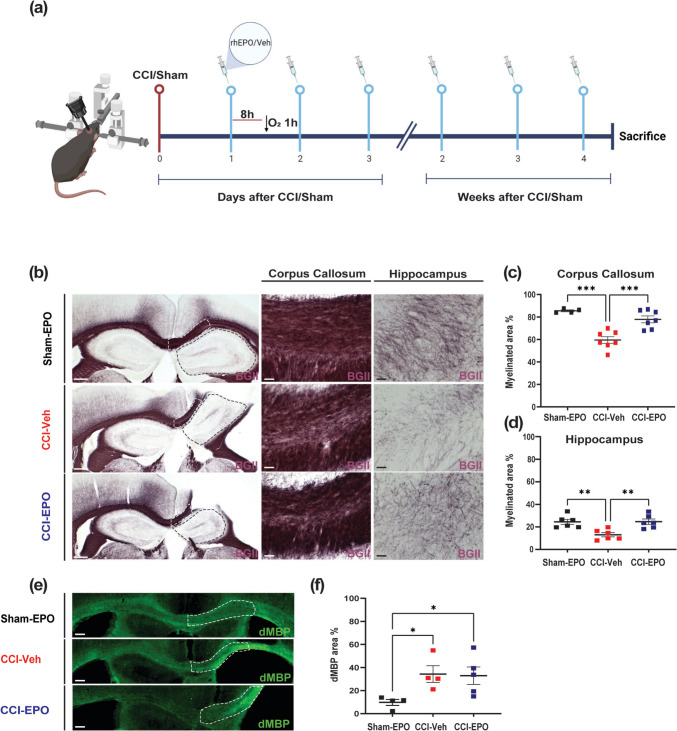
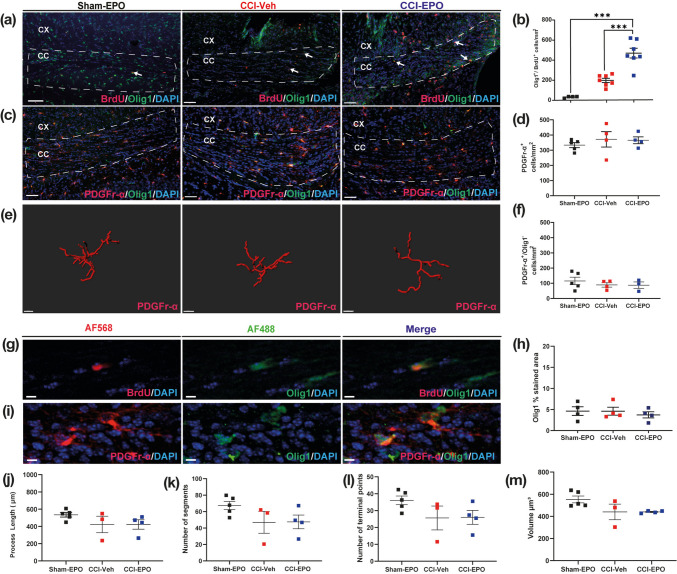
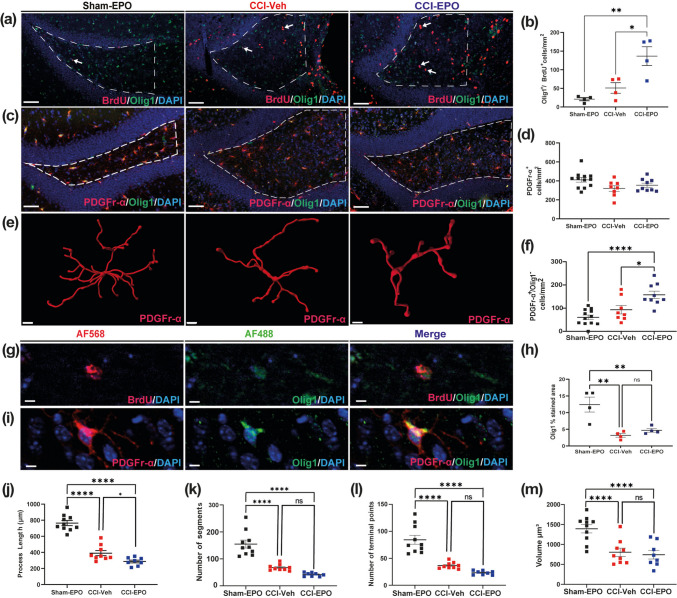
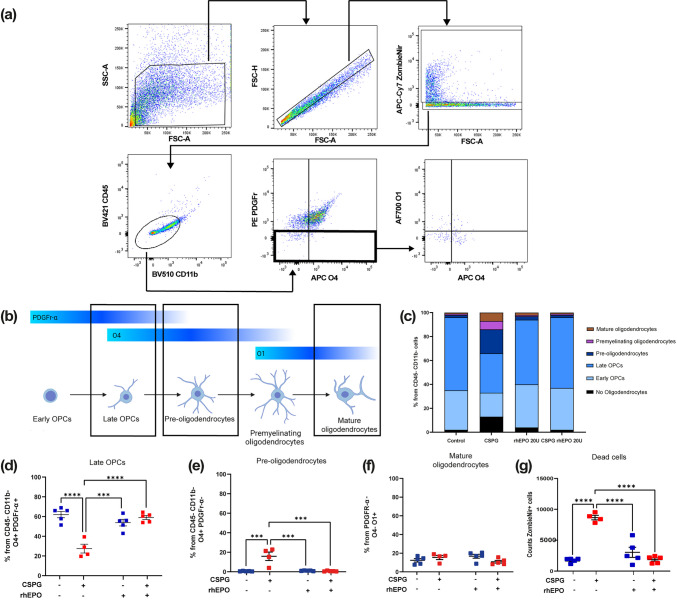
Traumatic brain injury (TBI) can result in axonal loss and demyelination, leading to persistent damage in the white matter. Demyelinated axons are vulnerable to pathologies related to an abnormal myelin structure that expose neurons to further damage. Oligodendrocyte progenitor cells (OPCs) mediate remyelination after recruitment to the injury site. Often this process is inefficient due to inadequate OPC proliferation. To date, no effective treatments are currently available to stimulate OPC proliferation in TBI. Recombinant human erythropoietin (rhEPO) is a pleiotropic neuroprotective cytokine, and its receptor is present in all stages of oligodendroglial lineage cell differentiation. Therefore, we hypothesized that rhEPO administration would enhance remyelination after TBI through the modulation of OPC response. Utilizing a murine model of controlled cortical impact and a primary OPC culture in vitro model, we characterized the impact of rhEPO on remyelination and proliferation of oligodendrocyte lineage cells. Myelin black gold II staining of the peri-contusional corpus callosum revealed an increase in myelinated area in association with an increase in BrdU-positive oligodendrocytes in injured mice treated with rhEPO. Furthermore, morphological analysis of OPCs showed a decrease in process length in rhEPO-treated animals. RhEPO treatment increased OPC proliferation after in vitro CSPG exposure. Erythropoietin receptor (EPOr) gene knockdown using siRNA prevented rhEPO-induced OPC proliferation, demonstrating that the rhEPO effect on OPC response is EPOr activation dependent. Together, our findings demonstrate that rhEPO administration may promote myelination by increasing oligodendrocyte lineage cell proliferation after TBI.

Keywords: Erythropoietin; Myelination; Oligodendrocyte progenitor cells; Traumatic brain injury; White matter injury.


Conflict of interest statement

The authors have no conflict of interests.

Figures

Fig. 1
Fig. 1
RhEPO administration reduces myelin loss after TBI and delayed hypoxemia. a Experimental design: rhEPO injections were performed at days 1, 2, and 3 followed by a weekly injection for a month after TBI; hypoxia was induced 8 h after the first rhEPO administration. b Representative images of the CC (white dashed line) and hippocampus (black dashed line) areas stained with BGII. c Quantification of percentage of the myelinated area of CC F(2,15) = 19.92 ***p < 0.005. d Quantification of percentage of the myelinated area of the hippocampus F(2,15) = 9.294 **p = 0.024. e Representative images of the CC and hippocampus areas stained with dMBP. f Quantification of percentage of the dMBP-stained area of the CC F(2,10) = 4.265 *p = 0.0458. Mean values are plotted ± SEM. One-way ANOVA followed by Tukey multiple comparison post hoc test was used to determine statistical differences; n = 4–7 mice per group. Scale bar = 200 µm and 50 µm in the inserts. Abbreviations: CCI: controlled cortical impact; BGII: myelin black gold II; rhEPO: recombinant human erythropoietin, Veh: vehicle. dMBP: degraded myelin basic protein
Fig. 2
Fig. 2
RhEPO stimulates oligodendrocyte lineage cell proliferation after TBI in the CC. a Representative fluorescent images of Olig1+/BrdU+ cells (white arrows) in the pericontusional CC. b Quantification of Olig1+ and BrdU+ cell density F(2,15) = 34.65 p < 0.005. c Representative fluorescent images of PDGFr-α and Olig1 in the CC. d Quantification of PDGFr-α+ cell density. e Representative three-dimensional reconstruction images of OPCs. f Quantification of PDGFr-α+ Olig1 cell density. g Representative high-magnification images of Olig1 and BrdU images. h Quantification of the Olig1 percent area of staining. i Representative high-magnification images of Olig1 and PDGFr-α. Quantification of OPC morphology j process length, k number of segments, l number of terminal points, and m volume. One-way ANOVA followed by Tukey multiple comparison post hoc test were used to determine statistical significance. ***p < 0.0005, n = 3–7 mice per group. Scale bar = 200 µm in a and c: scale bar = 10 µm in e. Abbreviations: CCI: controlled cortical impact; BrdU: 5-bromo-2′-deoxyuridine, EPO: erythropoietin, Veh: vehicle
Fig. 3
Fig. 3
RhEPO increases early OPC populations after TBI in the DG. a Representative fluorescent images of Olig1+/BrdU+ cells (white arrows) in DG. b Quantification of Olig1+ and BrdU+ cell density F(2, 9) = 12.53, p = 0.0025. c Representative fluorescent images of PDGFr-α and Olig1 in DG. d Quantification of PDGFr-α+ cell density. e Representative three-dimensional reconstruction images of OPCs. f Quantification of PDGFr-α+ Olig1 cell density F(2, 26) = 13.08, p < 0.0001. g Representative high-magnification images of Olig1 and BrdU images. h Quantification of the Olig1 percent area of staining F(2, 9) = 13.40, p = 0.002. i Representative high-magnification images of Olig1 and PDGFr-α. Quantification of OPC morphology j process length, F(2, 24) = 77.90, p < 0.0001, k number of segments, F(2, 24) = 33.05, p < 0.0001, l number of terminal points, F(2, 24) = 35.32, p < 0.0001, m volume, F(2, 24) = 12.15, p = 0.0002. Mean values are plotted ± SD; one-way ANOVA followed by Tukey multiple comparison post hoc test was used to determine statistical significance, ****p < 0.0001; *p < 0.05, n = 4–12 mice per group. Scale bar = 200 µm in a and c: scale bar = 10 µm in e. Abbreviations: CCI: controlled cortical impact, EPO: erythropoietin, Veh: vehicle
Fig. 4
Fig. 4
CSPG-induced OPC injury is rescued by rhEPO treatment in vitro. a Experimental design. b Representative fluorescent image of PDGFr-α and EPOr cells. c Representative fluorescent images of PDGFr-α- and Olig1-positive cells. d Quantification of Olig1+ cell density, F(1, 34) = 14.88, p < 0.0005. e Quantification of PDGFr-α+ cell density F(1, 36) = 12.89, p < 0.001. f Quantification of BrdU+ cell density, F(1, 34) = 7.205, p < 0.011. g Representative fluorescent images of BrdU-positive cells. h Mander’s coefficient of BrdU and DAPI, F(1, 34) = 7.173, p < 0.0112. i Quantification of DAPI density F(1, 34) = 10.96, p < 0.0022. Mean values are plotted ± SEM; two-way ANOVA followed by Tukey multiple comparison post hoc test was used to determine statistical significance. *p < 0.05; **p < 0.005; ***p < 0.0005; ****p < 0.0001, n = 10 wells per group. Abbreviations: CSPG: chondroitin sulfate proteoglycan, EPO: erythropoietin, FOV: field of view, PFA: paraformaldehyde
Fig. 5
Fig. 5
RhEPO rescues oligodendrocyte precursor cells after CSPG exposure. a Gating strategy. b Schematic representation of oligodendrocyte differentiation. c Representation of the % from CD45CD11b mature oligodendrocytes, premyelinating oligodendrocytes, pre-oligodendrocytes, late OPCs, and early OPCs. d Quantification of the % from CD45CD11b late OPCs (PDGFr-α+O4+), F(1, 15) = 36.97, p < 0.0001. e Quantification of the % from CD45CD11b pre-oligodendrocytes (PDGFr-αO4+), F(1, 15) = 19.54, p < 0.0005. f Quantification of the % from PDGFr-α mature oligodendrocytes (O4O1+), F(1, 15) = 5.656, p < 0.0311. g Quantification of the ZombieNir cells F(1, 15) = 68.22, p < 0.0001. Mean values are plotted ± SEM; two-way ANOVA followed by Tukey multiple comparison post hoc test was used to determine statistical differences, ****p < 0.0001; ***p < 0.0005, n = 5 wells per group. Abbreviations: CSPG: chondroitin sulfate proteoglycan, EPO: erythropoietin, OPCs: oligodendrocyte progenitor cells
Fig. 6
Fig. 6
EPOr knockdown reverses rhEPO rescue after CSPG exposure. a Representative fluorescent images of BrdU+, Olig1+, and EPOr+ cells. b Quantification of Olig1+ cell density. c Quantification of BrdU+ cell density. d Quantification of EPOr percent of the stained area p < 0.0001. e Experimental design. f Representative images of BrdU+ and Olig1+ cells. g Quantification of Olig1 + cell density, F(1, 16) = 5.603, p < 0.0309. h Quantification of BrdU+ cell density, F(1, 16) = 12.23, p < 0.003. i Mander’s coefficient of BrdU and DAPI, F(1, 16) = 30.30, p < 0.0001. Mean values are plotted ± SEM; two-way ANOVA followed by Tukey multiple comparison post hoc test was used to determine statistical significance. *p < 0.05; **p < 0.005; ***p < 0.0005; ****p < 0.0001, n = 4–5 wells per group. Scale bar = 5 µm. Abbreviations: CSPG: chondroitin sulfate proteoglycan, EPO: erythropoietin, EPOr: erythropoietin receptor, FOV: field of view, PFA: paraformaldehyde

Similar articles

Cited by

References

    1. Roozenbeek B, Maas AI, Menon DK. Changing patterns in the epidemiology of traumatic brain injury. Nat Rev Neurol. 2013;9(4):231–236. doi: 10.1038/nrneurol.2013.22. - DOI - PubMed
    1. Filley CM, Kelly JP. White matter and cognition in traumatic brain injury. J Alzheimers Dis. 2018;65(2):345–362. doi: 10.3233/JAD-180287. - DOI - PubMed
    1. Marklund N, Bellander BM, Godbolt AK, Levin H, McCrory P, Thelin EP. Treatments and rehabilitation in the acute and chronic state of traumatic brain injury. J Intern Med. 2019;285(6):608–623. doi: 10.1111/joim.12900. - DOI - PMC - PubMed
    1. James SL, Theadom A, Ellenbogen RG, Bannick MS, Mountjoy-Venning WC, Lucchesi LR, et al. Global, regional, and national burden of traumatic brain injury and spinal cord injury, 1990–2016: a systematic analysis for the Global Burden of Disease Study 2016. Lancet Neurol. 2019;18(1):56–87. doi: 10.1016/S1474-4422(18)30415-0. - DOI - PMC - PubMed
    1. Lipton ML, Gellella E, Lo C, Gold T, Ardekani BA, Shifteh K, et al. Multifocal white matter ultrastructural abnormalities in mild traumatic brain injury with cognitive disability: a voxel-wise analysis of diffusion tensor imaging. J Neurotrauma. 2008;25(11):1335–1342. doi: 10.1089/neu.2008.0547. - DOI - PubMed

Publication types