. 2023 Sep 28;18(9):e0291742.
doi: 10.1371/journal.pone.0291742. eCollection 2023.

Quantitative detection and reduction of potentially pathogenic bacterial groups of Aeromonas, Arcobacter, Klebsiella pneumoniae species complex, and Mycobacterium in wastewater treatment facilities

Affiliations

Quantitative detection and reduction of potentially pathogenic bacterial groups of Aeromonas, Arcobacter, Klebsiella pneumoniae species complex, and Mycobacterium in wastewater treatment facilities

Masataka Aoki et al. PLoS One. .

Abstract

Water quality parameters influence the abundance of pathogenic bacteria. The genera Aeromonas, Arcobacter, Klebsiella, and Mycobacterium are among the representative pathogenic bacteria identified in wastewater. However, information on the correlations between water quality and the abundance of these bacteria, as well as their reduction rate in existing wastewater treatment facilities (WTFs), is lacking. Hence, this study aimed to determine the abundance and reduction rates of these bacterial groups in WTFs. Sixty-eight samples (34 influent and 34 non-disinfected, treated, effluent samples) were collected from nine WTFs in Japan and Thailand. 16S rRNA gene amplicon sequencing analysis revealed the presence of Aeromonas, Arcobacter, and Mycobacterium in all influent wastewater and treated effluent samples. Quantitative real-time polymerase chain reaction (qPCR) was used to quantify the abundance of Aeromonas, Arcobacter, Klebsiella pneumoniae species complex (KpSC), and Mycobacterium. The geometric mean abundances of Aeromonas, Arcobacter, KpSC, and Mycobacterium in the influent wastewater were 1.2 × 10⁴-2.4 × 10⁵, 1.0 × 10⁵-4.5 × 10⁶, 3.6 × 10²-4.3 × 10⁴, and 6.9 × 10³-5.5 × 10⁴ cells mL-1, respectively, and their average log reduction values were 0.77-2.57, 1.00-3.06, 1.35-3.11, and -0.67-1.57, respectively. Spearman's rank correlation coefficients indicated significant positive or negative correlations between the abundances of the potentially pathogenic bacterial groups and Escherichia coli as well as water quality parameters, namely, chemical/biochemical oxygen demand, total nitrogen, nitrate-nitrogen, nitrite-nitrogen, ammonium-nitrogen, suspended solids, volatile suspended solids, and oxidation-reduction potential. This study provides valuable information on the development and appropriate management of WTFs to produce safe, hygienic water.


Conflict of interest statement

The authors have declared that no competing interests exist.

Figures

Fig 1
Fig 1. Relative 16S rRNA gene abundances of the genera Aeromonas, Arcobacter, Klebsiella, and Mycobacterium in the representative influent wastewater (inf.) and treated effluent (eff.) samples from the nine analyzed wastewater treatment facilities (A–I).
ND, not detected.
Fig 2
Fig 2. Relative abundances of dominant Aeromonas, Arcobacter, Pseudarcobacter, and Mycobacterium operational taxonomic units (OTUs) in the representative influent wastewater influent (inf.) and treated effluent (eff.) samples from the nine analyzed wastewater treatment facilities (A–I).
ND, not detected.
Fig 3
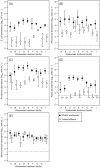
Fig 3. Geometric mean abundances of (A) Escherichia coli, (B) Aeromonas, (C) Arcobacter, (D) Klebsiella pneumoniae species complex (KpSC), and (E) Mycobacterium in the influent wastewater and treated effluent of the nine analyzed wastewater treatment facilities (A–I).
Error bars indicate the maximum and minimum abundances. Horizontal dashed lines indicate the limit of quantification (LoQ) for each quantitative real-time polymerase chain reaction assay. *, KpSC abundances below the LoQ are indicated by the value of LoQ/2.
Fig 4
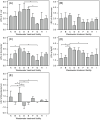
Fig 4. Average log reduction values (LRVs) of (A) Escherichia coli, (B) Aeromonas, (C) Arcobacter, (D) Klebsiella pneumoniae species complex (KpSC), and (E) Mycobacterium in the nine analyzed wastewater treatment facilities (A–I).
Error bars indicate the standard deviation. *, p < 0.01 according to Student’s t-test with the Benjamini–Hochberg correction.
Fig 5
Fig 5. Spearman’s rank correlation coefficients between the abundances of Escherichia coli and potentially pathogenic bacterial groups and water quality parameters.
Spearman’s rank correlation coefficients are shown only for p < 0.01 with the Benjamini–Hochberg correction. CODCr: chemical oxygen demand concentration determined by the potassium dichromate method (mg L−1), BOD: biochemical oxygen demand concentration (mg L−1), TN: total nitrogen concentration (mg L−1), NH4+-N: ammonium-nitrogen concentration (mg L−1), NO2-N: nitrite-nitrogen concentration (mg L−1), NO3-N: nitrate-nitrogen concentration (mg L−1), SS: suspended solids concentration (mg L−1), VSS: volatile suspended solids concentration (mg L−1), ORP: oxidation-reduction potential (mV), DO: dissolved oxygen concentration (mg L−1), Temp: water temperature (°C), E. coli: Escherichia coli abundance (log10 colony-forming units mL−1), Aeromonas: Aeromonas abundance (log10 cells mL−1), Arcobacter: Arcobacter abundance (log10 cells mL−1), KpSC: Klebsiella pneumoniae species complex abundance (log10 cells mL−1), and Mycobacterium: Mycobacterium abundance (log10 cells mL−1).
Fig 6
Fig 6. Correlations between the abundances of Escherichia coli (log10 colony-forming units [CFU] mL1) and (A) Aeromonas, (B) Arcobacter, (C) Klebsiella pneumoniae species complex (KpSC), or (D) Mycobacterium (log10 cells mL1) in the wastewater treatment facilities.

References

    1. Hube S, Wu B. Mitigation of emerging pollutants and pathogens in decentralized wastewater treatment processes: A review. Sci. Total Environ. 2021;779:146545. doi: 10.1016/j.scitotenv.2021.146545 - DOI - PubMed
    1. Levine AD, Asano T. Recovering sustainable water from wastewater. Environ. Sci. Technol. 2004;38(11):201A–208A. doi: 10.1021/es040504n - DOI - PubMed
    1. Jones ER, van Vliet MTH, Qadir M, Bierkens MFP. Country-level and gridded estimates of wastewater production, collection, treatment and reuse. Earth Syst. Sci. Data 2021;13(2):237–254. doi: 10.5194/essd-13-237-2021 - DOI
    1. Naidoo S, Olaniran AO. Treated wastewater effluent as a source of microbial pollution of surface water resources. Int. J. Environ. Res. Public Health 2014;11(1):249–270. doi: 10.3390/ijerph110100249 - DOI - PMC - PubMed
    1. Sun Y-X, Wu Q-Y, Hu H-Y, Tian J. Effect of ammonia on the formation of THMs and HAAs in secondary effluent chlorination. Chemosphere 2009(5);76:631–637. doi: 10.1016/j.chemosphere.2009.04.041 - DOI - PubMed

Publication types

LinkOut - more resources