

Impact of anthropometry training and feasibility of 3D imaging on anthropometry data quality among children under five years in a postmortem setting
- PMID: 37768936
- PMCID: PMC10538800
- DOI: 10.1371/journal.pone.0292046
Impact of anthropometry training and feasibility of 3D imaging on anthropometry data quality among children under five years in a postmortem setting
Abstract
Background: The Child Health and Mortality Prevention Surveillance Network (CHAMPS) identifies causes of under-5 mortality in high mortality countries.
Objective: To address challenges in postmortem nutritional assessment, we evaluated the impact of anthropometry training and the feasibility of 3D imaging on data quality within the CHAMPS Kenya site.
Design: Staff were trained using World Health Organization (WHO)-recommended manual anthropometry equipment and novel 3D imaging methods to collect postmortem measurements. Following training, 76 deceased children were measured in duplicate and were compared to measurements of 75 pre-training deceased children. Outcomes included measures of data quality (standard deviations of anthropometric indices and digit preference scores (DPS)), precision (absolute and relative technical errors of measurement, TEMs or rTEMs), and accuracy (Bland-Altman plots). WHO growth standards were used to produce anthropometric indices. Post-training surveys and in-depth interviews collected qualitative feedback on measurer experience with performing manual anthropometry and ease of using 3D imaging software.
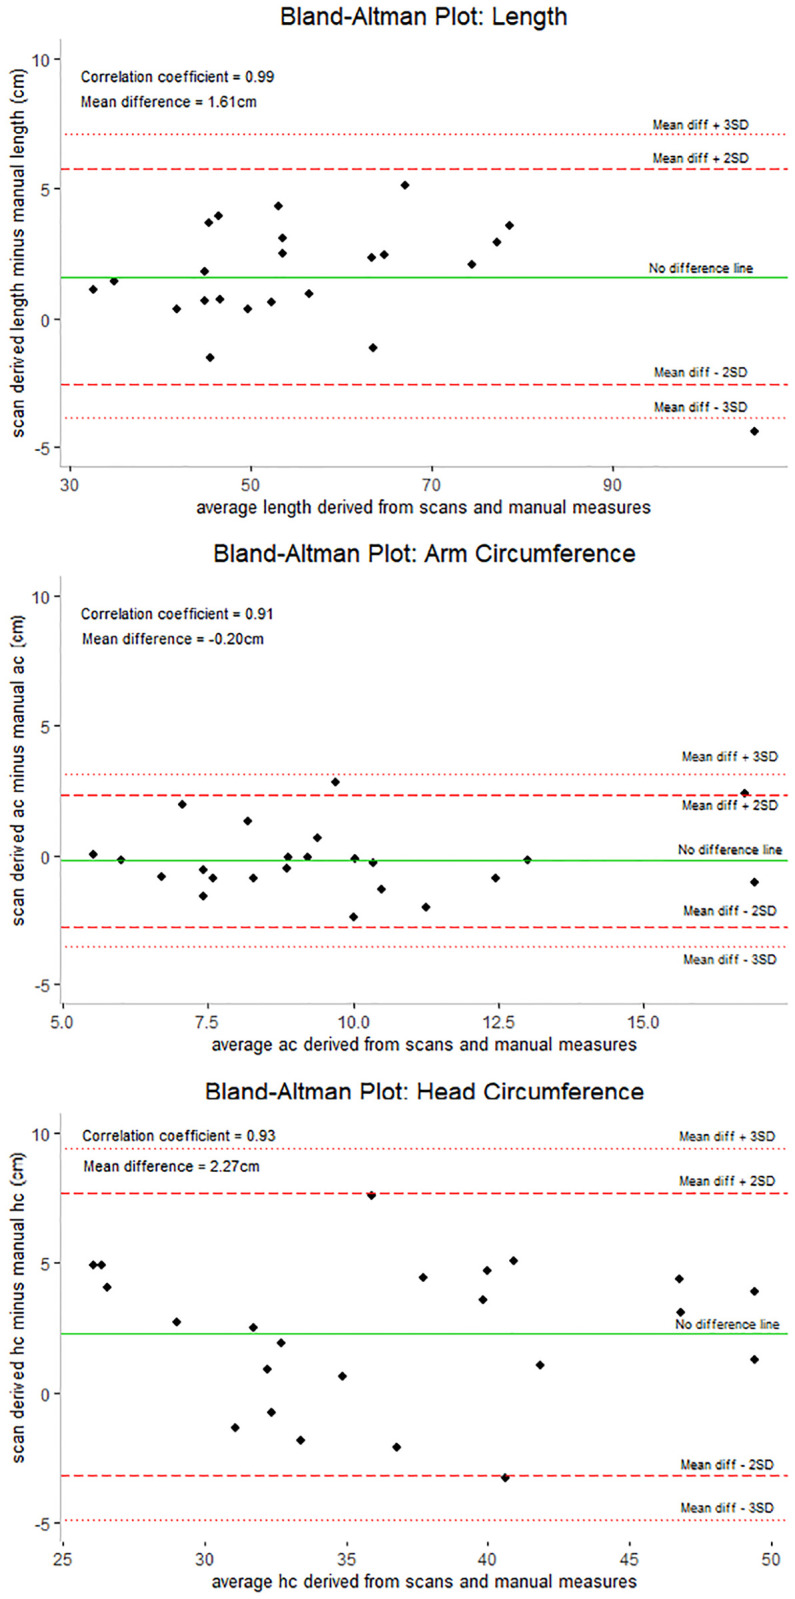
Results: Manual anthropometry data quality improved after training, as indicated by DPS. Standard deviations of anthropometric indices exceeded limits for high data quality when using the WHO growth standards. Reliability of measurements post-training was high as indicated by rTEMs below 1.5%. 3D imaging was highly correlated with manual measurements; however, on average 3D scans overestimated length and head circumference by 1.61 cm and 2.27 cm, respectively. Site staff preferred manual anthropometry to 3D imaging, as the imaging technology required adequate lighting and additional considerations when performing the measurements.
Conclusions: Manual anthropometry was feasible and reliable postmortem in the presence of rigor mortis. 3D imaging may be an accurate alternative to manual anthropometry, but technology adjustments are needed to ensure accuracy and usability.
Copyright: This is an open access article, free of all copyright, and may be freely reproduced, distributed, transmitted, modified, built upon, or otherwise used by anyone for any lawful purpose. The work is made available under the Creative Commons CC0 public domain dedication.
Conflict of interest statement
I have read the journal’s policy and the authors of this manuscript have the following competing interests: Eugene Alexander holds an ownership position in Body Surface Translations and therefore has a financial interest in the success of the 3D testing device described in this study. Data were blinded and not shared with Mr. Alexander until completion of draft manuscript. This does not alter our adherence to PLOS ONE policies on sharing data and materials. Additional disclosure: The findings and conclusions in this report are those of the authors and do not necessarily represent the official position of the Centers for Disease Control and Prevention.
Figures
References
-
- Children: improving survival and well-being. 2020; https://www.who.int/news-room/fact-sheets/detail/children-reducing-morta....
LinkOut - more resources
Full Text Sources
