. 2023 Sep 29;381(6665):1480-1487.
doi: 10.1126/science.adh9925. Epub 2023 Sep 28.

Fibroblasts in heart scar tissue directly regulate cardiac excitability and arrhythmogenesis

Affiliations

Fibroblasts in heart scar tissue directly regulate cardiac excitability and arrhythmogenesis

Yijie Wang et al. Science. .

Abstract

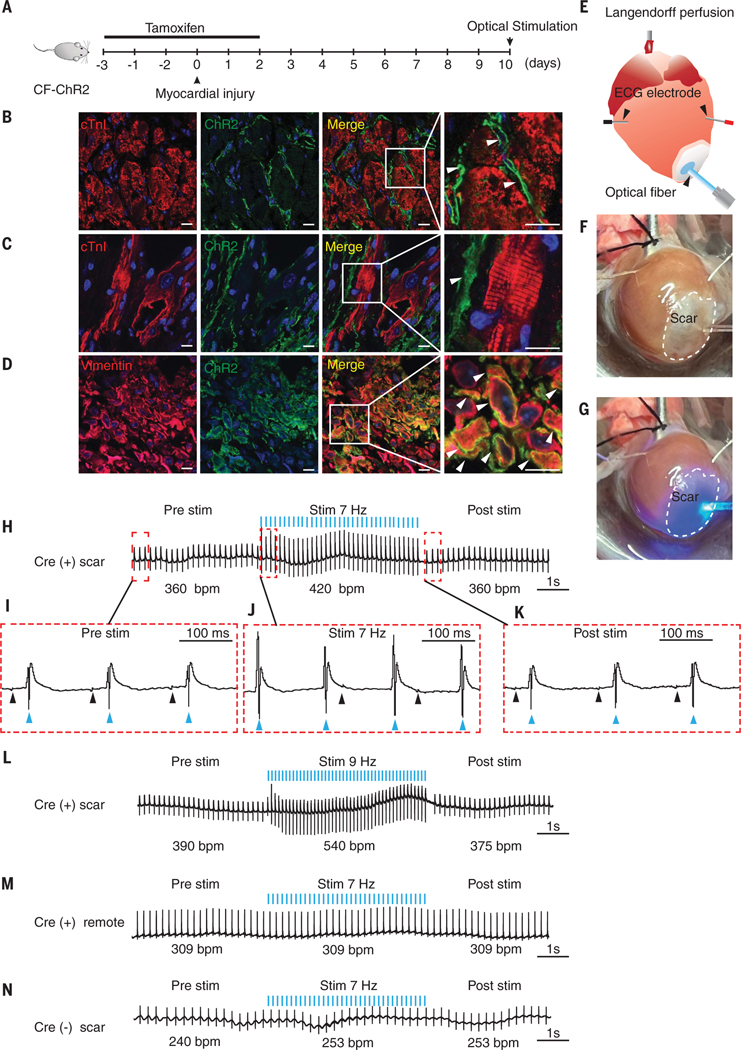
After heart injury, dead heart muscle is replaced by scar tissue. Fibroblasts can electrically couple with myocytes, and changes in fibroblast membrane potential can lead to myocyte excitability, which suggests that fibroblast-myocyte coupling in scar tissue may be responsible for arrhythmogenesis. However, the physiologic relevance of electrical coupling of myocytes and fibroblasts and its impact on cardiac excitability in vivo have never been demonstrated. We genetically engineered a mouse that expresses the optogenetic cationic channel ChR2 (H134R) exclusively in cardiac fibroblasts. After myocardial infarction, optical stimulation of scar tissue elicited organ-wide cardiac excitation and induced arrhythmias in these animals. Complementing computational modeling with experimental approaches, we showed that gap junctional and ephaptic coupling, in a synergistic yet functionally redundant manner, excited myocytes coupled to fibroblasts.


Conflict of interest statement

Competing interests: All authors declare that they have no competing interests.

Figures

Fig. 1.
Fig. 1.. Optical stimulation of scar tissue of CF-ChR2 animal drives organ-wide cardiac excitation.
(A) Schematic of experiment outlining administration of tamoxifen to induce Cre-mediated recombination and harvesting of heart at 10 days after MI. (B and C) Immunofluorescent staining of heart of CF-ChR2 animal harvested at 10 days after MI that demonstrates cardiomyocyte (red, Troponin I) and ChR2-expressing cells (green, eYFP) in uninjured myocardium remote to scar tissue (B) and scar tissue (C). Merged image and magnified inset demonstrating spatial relationship of fibroblasts (arrows) to myocytes. Scale bar, 20 μm. (D) Immunostaining for vimentin (red) and ChR2 (green) that demonstrates colocalization of ChR2 in vimentin-expressing cells (merged image and magnified inset [arrows, yellow]). (E to G) (E) Schematic of optical stimulation of scar tissue of the per- fused heart before (F) and at the onset of (G) optical stimulation with blue light. (H) Cardiac electrical recording before, during, and after optical stimulation of scar tissue at 7 Hz (blue lines indicate pulses of optical stimulation, bpm: recorded cardiac electrical activity in beats per minute). (I to K) Magnified atrial (black arrows) and ventricular electrograms (blue arrows) from recordings before (I), during (J), and after (K) optical stimulation. Note the dissociation of atrial and ventricular rhythm during stimulation with atrial activation not preceding ventricular activation. (L) Cardiac electrical recording after optical stimulation of scar at 9 Hz. (M and N) Cardiac electric recording after stimulation of myocardium remote to scar tissue in CF-ChR2 animal (M) or scar in Cre (−) animal (N). Representative tracings shown; n = 20 Cre (+) scar, n =6 Cre (−) scar, and n = 10 Cre (+) remote.
Fig. 2.
Fig. 2.. Depolarization of fibroblasts in scar tissue drives cardiac excitation in vivo and induces arrhythmogenesis.
(A) Schematic of experiment that demonstrates anesthetized CF-ChR2 animal subjected to open thoracotomy with optical stimulation of scar tissue and simultaneous surface ECG recording by using limb leads. (B) ECG recording before, during, and after optical stimulation of scar tissue at 7 Hz (blue bars represent optical stimulation pulses). (C to E) Magnified recordings demonstrating atrial (P waves, black arrows) and ventricular activity (QRS complexes, blue arrows) from recordings before (C), during (D), and after (E) stimulation. Note that atrial (P-P) rate and ventricular (R-R) rates are different in (D), which confirms the dissociation of atrial and ventricular rhythm during optical stimulation followed by resumption of sinus rhythm poststimulation. (F and G) Surface ECG recording after optical stimulation of myocardium remote to scar tissue (F) or scar in Cre (−) animal (G). (H to J) LV pressure recording before and after optical stimulation in live CF-ChR2 animal. (H) Technical schematic showing introduction of pressure catheter through the carotid into the LV. (I) Surface ECG demonstrating electrical activity before, during, and after optical stimulation. (J) Simultaneous recording of LV pressures (note that increased cardiac electrical activity is associated with increased frequency of synchronous beats that generate LV pressure). (K to O) Arrhythmogenesis noted in a subset of animal hearts after optical stimulation of scar tissue. (K) Electrical recording from intact perfused heart before, during, and after optical stimulation, which demonstrates ventricular bigeminy (paired beats) that was sustained for 1 min in the absence of any further perturbations. (L) Surface ECG from live animal subjected to optical stimulation of scar that demonstrates high-grade AV block. Note the loss of 1:1 conduction between atrial (P wave, black arrows) and ventricular (QRS complex, blue arrows) activity. (M to O) Heart of CF-ChR2 animal harvested 3 months after MI and subjected to optical stimulation demonstrates ventricular asystole after cessation of optical stimulation (M), and magnified view of ventricular rhythm before (N) and after (O) stimulation demonstrates absence of any ventricular rhythm poststimulation (representative tracings, n = 15 per group).
Fig. 3.
Fig. 3.. Connexin 43 is not required for fibroblast-myocyte coupling in vivo.
(A) Dot plot from single-nuclear RNA-seq that shows gene expression of various connexins and pannexins across cardiac cell population in the heart harvested 7 days after MI. EC, endothelial cell. (B) Comparison of expression of connexins/pannexins in CFs and myocytes shown as a percentage of cells expressing the gene of interest. (C) Schematic of generation of the Cx43CKO-CF-ChR2 animal with administration of tamoxifen to induce Cre-mediated recombination. (D) Quantitative polymerase chain reaction (qPCR) that demonstrates Cx43 expression in CFs from Cx43CKO-CF-ChR2 animals compared with CFs from CF-ChR2 control animals (data are represented as mean ± SD, **P < 0.01, n = 3). (E to H) Intact perfused hearts of Cx43CKO-CF-ChR2 animals harvested 10 days after MI were subjected to optical stimulation of scar tissue. (E) Electrical recording of heart before, during, and after optical stimulation at 7 Hz (blue bars represent optical stimulation pulses; representative tracings, n = 8). (F to H) Magnified electrograms demonstrate atrial (black arrows) and ventricular activity (blue arrows) before (F), during (G), and after (H) stimulation. Note dissociation of atrial and ventricular activity during optical stimulation. (I) Cardiac electrical recording after optical stimulation of scar at 9 Hz. (J to M) Surface ECG of live Cx43CKO-CF-ChR2 animal subjected to optical stimulation of scar at 10 days after MI. (J) ECG recording before, during, and after stimulation at 7 Hz. (K to M) Atrial (P wave, black arrows) and ventricular (QRS complexes, blue arrows) activity before (K), during (L), and after (M) stimulation. Note dissociation of atrial and ventricular activity during stim followed by resumption of normal sinus rhythm after stimulation (representative tracings, n = 9 per group).
Fig. 4.
Fig. 4.. Connexin-dependent GJ coupling is dispensable for fibroblast-myocyte electrical coupling.
(A) Western blot demonstrating expression of Cx43 in wild-type (WT) CFs, CF-ChR2 (Cx43fl/fl) CFs, and after transfection of Cx43fl/fl CFs with Cre plasmid to generate Cx43KO CFs. (B) Schematic of optical stimulation of CF-ChR2 cocultured with NRVMs loaded with x-Rhod-AM dye to record calcium transients. (C to E) Recording of calcium transients in cardiomyocytes after optical stimulation of CF-ChR2 (C), Cx43KO-CF-ChR2 (D), and Cx40/43/45/Panx1KO-CF-ChR2 (E) fibroblasts (blue bars represent optical stimulation pulses). Representative tracings, n = 5 per group. (F to K) Modeling of GJ (F) and non-GJ (ephaptic) (G) coupling, with simulation demonstrating successful depolarization of fibroblasts (Vfibro) and myocytes (Vmyo) with either GJ (H) or non-GJ (I) coupling. Blue bars indicate pulses of optical stimulation applied to fibroblasts. (H and I, insets) Differences in membrane depolarization of fibroblast and myocyte with GJ and non-GJ coupling. (J) Simulation showing myocyte excitation with variation in GJ and ephaptic coupling (vcl). Ten fibroblasts were connected to the myocyte for this simulation. The red box represents low GJ conductance but strong ephaptic coupling, and the blue box represents strong GJ conductance with weak ephaptic coupling. The purple box indicates where ephaptic and GJ coupling synergize to excite myocytes. (K) Simulation showing myocyte excitation with variation in Na+ channel conductance of CFs and the number of CFs coupled to the myocyte solely through ephaptic coupling. In (J) and (K), colored circles represent successful myocyte excitation, and dots represent unsuccessful myocyte excitation. Color of the circles represents delay (time interval) to myocyte excitation tint (milliseconds).

Comment in

References

    1. Christia P. et al., J. Histochem. Cytochem. 61, 555–570 (2013). - PMC - PubMed
    1. Frangogiannis NG, J. Clin. Invest. 127, 1600–1612 (2017). - PMC - PubMed
    1. Mahoney VM, Mezzano V, Morley GE, Prog. Biophys. Mol. Biol. 120, 128–133 (2016). - PMC - PubMed
    1. Nguyen TP, Qu Z, Weiss JN, J. Mol. Cell. Cardiol. 70, 83–91 (2014). - PMC - PubMed
    1. Nguyen TP, Xie Y, Garfinkel A, Qu Z, Weiss JN, Cardiovasc. Res. 93, 242–251 (2012). - PMC - PubMed