. 2023 Sep 28:12:RP89214.
doi: 10.7554/eLife.89214.

Multiomics analyses reveal dynamic bioenergetic pathways and functional remodeling of the heart during intermittent fasting

Affiliations

Multiomics analyses reveal dynamic bioenergetic pathways and functional remodeling of the heart during intermittent fasting

Thiruma V Arumugam et al. Elife. .

Abstract

Intermittent fasting (IF) has been shown to reduce cardiovascular risk factors in both animals and humans, and can protect the heart against ischemic injury in models of myocardial infarction. However, the underlying molecular mechanisms behind these effects remain unclear. To shed light on the molecular and cellular adaptations of the heart to IF, we conducted comprehensive system-wide analyses of the proteome, phosphoproteome, and transcriptome, followed by functional analysis. Using advanced mass spectrometry, we profiled the proteome and phosphoproteome of heart tissues obtained from mice that were maintained on daily 12- or 16 hr fasting, every-other-day fasting, or ad libitum control feeding regimens for 6 months. We also performed RNA sequencing to evaluate whether the observed molecular responses to IF occur at the transcriptional or post-transcriptional levels. Our analyses revealed that IF significantly affected pathways that regulate cyclic GMP signaling, lipid and amino acid metabolism, cell adhesion, cell death, and inflammation. Furthermore, we found that the impact of IF on different metabolic processes varied depending on the length of the fasting regimen. Short IF regimens showed a higher correlation of pathway alteration, while longer IF regimens had an inverse correlation of metabolic processes such as fatty acid oxidation and immune processes. Additionally, functional echocardiographic analyses demonstrated that IF enhances stress-induced cardiac performance. Our systematic multi-omics study provides a molecular framework for understanding how IF impacts the heart's function and its vulnerability to injury and disease.

Keywords: RNA sequencing; heart; intermittent fasting; medicine; metabolism; mouse; phosphoproteomics; proteomics; regenerative medicine; stem cells.


Conflict of interest statement

TA, AA, EL, SS, LP, VR, YC, YC, JK, JK, HS, DH, CR, DF, DM, GN, SB, KM, MG, GD, CS, BK, RS, MM, DJ, JG No competing interests declared

Figures

Figure 1.
Figure 1.. Impact of intermittent fasting on the heart proteome.
(a) Hierarchical clustering of proteins significantly differentially expressed in each IF group and AL group (one-way ANOVA with Dunnett’s test). The color scale denotes z-score normalized protein abundances. Red denotes higher protein abundance, and blue lower protein abundance. Gene ontology-based biological processes and pathways significantly enriched in representative protein clusters across the different groups. Selected enzymes specifically modulated within each cluster are highlighted. (b) IF-modulated kinases involved in metabolic pathways and signaling pathways. (c) Enrichment analysis of modulated processes and pathways in the different IF groups in comparison to the AL group (1-D annotation enrichment using Wilcoxon-Mann-Whitney test). Each dot represents a functional process or pathway. A positive enrichment score denotes higher protein abundance, and a negative enrichment score denotes lower protein abundance. n=4–5 mice in each experimental group.
Figure 1—figure supplement 1.
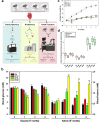
Figure 1—figure supplement 1.. Experimental design and details of the study cohort.
(a) Schema showing the experimental design of the current study. At the 6-month time point, mice were euthanized, and hearts were removed and processed for transcriptomic and proteomic analyses. Another set of mice were used for echocardiography experiments (n=10 mice/group) (b) Fasting blood glucose and ketone levels at the indicated time points. Values are the mean ± SEM (n=20 mice/group). *p<0.05, **p<0.01, ***p<0.001 compared to the AL group value (one-way ANOVA with Tukey’s post hoc test). (c) Average monthly body weights (g) of AL and IF mice during the experiments (6 months) (one-way ANOVA with Tukey’s post hoc test). (d) Overall compositional calorie intake by the mice in terms of protein, fat and carbohydrates per body weight (kcal/g).
Figure 1—figure supplement 2.
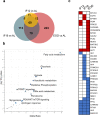
Figure 1—figure supplement 2.. IF-responsive proteins distribution across different fasting regimens.
(a) The overlap among the significantly differentially expressed proteins in each IF group compared to AL (one-way ANOVA with Dunnett’s post hoc test). (b) Volcano plot of terms from the MSigDB_Hallmark_2020 gene set for the enrichment of enzymes modulated with IF. The larger and darker-colored the point, the more significantly enriched the input gene set is for the term. (c) Comparison of kinase modulation across different IF regimens based on significance. Red indicates increased abundance, and blue indicates decreased abundance.
Figure 2.
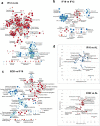
Figure 2.. Differential effects of IF regimen functional processes.
(a) Functional transition network that shows functional remodeling of heart proteome in response to IF12 (a), IF16 (b), and EOD (c) GSEA for biological processes and pathways performed for each IF regimen comparison is shown as an enrichment map. Functions significantly enriched (p<0.01, nominal p-value from empirical phenotype-based permutation test in GSEA) among the upregulated and downregulated proteins for each comparison are indicated by red and blue nodes, respectively. The size of the nodes indicates the number of proteins within the node and edges link nodes that share common proteins. (d) Functional processes and pathways altered by changes in transcriptome and proteome abundances through different IF regimens (Benjamini-Hochberg FDR <0.05, 2-D annotation enrichment using MANOVA test). Each dot on the plot represents a modulation in pathway or process. The scores indicate abundance changes of transcriptome or proteome levels over AL. Upregulation and downregulation of components are denoted by positive and negative scores, respectively. n=4–5 mice in each experimental group.
Figure 2—figure supplement 1.
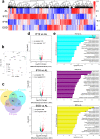
Figure 2—figure supplement 1.. Transcriptomics-based analysis.
(a) Hierarchical clustering of differentially expressed mRNAs in the three IF groups compared to the AL group. Upregulated genes are indicated in red and down-regulated genes are shown in blue. The color scale represents the log10 (average FPKM + 1) value. (b) Principal components analysis of RNA sequencing samples from AL, IF12, IF16, and EOD groups. (c) Venn diagram showing the distribution of differentially expressed mRNAs from IF12, IF16, and EOD groups compared to the AL group. (d) Volcano plots of differentially expressed mRNAs in IF12, IF16, and EOD groups compared to the AL group. The threshold of differential expression was set at p<0.05. Each dot represents an individual gene (blue: no significant difference; red: upregulated gene; green: down-regulated gene). Volcano plot of statistical significance (-log10 q-value) against enrichment (log2 fold change) of differentially expressed genes. (e) Significantly enriched GO terms in each category of the biological process for each IF group compared to the AL group. (n=5 mice/group). FPKM, fragments per kilobase of transcript per million mapped reads.
Figure 2—figure supplement 2.
Figure 2—figure supplement 2.. Comparison of IF-induced transcriptome and proteome rewiring.
(a) Comparison of proteome and transcriptome abundances in AL and different IF groups. Protein levels are represented by average log-transformed normalized abundances, and transcriptome levels are represented using average log-transformed FPKM within each group (b) Functional processes and pathways altered by changes in transcriptome and proteome abundances at IF12 (Benjamini-Hochberg FDR <0.05, 2-D annotation enrichment using MANOVA test). Each dot on the plot represents a modulation in a pathway or process. The scores are indicative of abundance changes of transcriptome or proteome levels over AL. Upregulation and downregulation of components are denoted by positive and negative scores, respectively. (c) EOD induced fold changes in mRNA (x-axis) and protein abundances of enzymes (y-axis) in comparison to AL.
Figure 2—figure supplement 3.
Figure 2—figure supplement 3.. Analysis of the core clock components genes.
Differentially expressed mRNAs for clock genes in the three IF groups compared to the AL group (heat map). Most of the clock gene transcripts displayed differential expression profile compared to the AL control group irrespective of the different fasting regimens (Wald test as implemented in DESeq). IF12 and IF16 groups showed similar trend and did not particularly differ from the EOD fasting group. Red border denotes increased expression, and blue border denotes decreased expression compared to AL.
Figure 3.
Figure 3.. Network mapping of IF-responsive proteins.
(a) Proteins with significantly altered abundance in response to IF are overlaid on consensus protein-protein interaction network constructed using all IF-responsive proteins. The proteins that sequentially show differential modulation are indicated with different colors as yellow (IF12), blue (IF16), and red (EOD). (b) The top densely connected functional protein clusters are shown (one-sided Mann-Whitney U test as implemented in Cluster ONE). The color of each node indicates the IF regimen for which the protein was differentially expressed. Yellow, blue, and red indicate IF12, IF16, and EOD regimens, respectively. The heat maps show proteome changes for the proteins in the respective clusters. Red denotes increased expression, and blue denotes decreased expression. (c) Transcription factors significantly enriched across the different IF groups. n=4–5 mice in each experimental group.
Figure 3—figure supplement 1.
Figure 3—figure supplement 1.. Network mapping of IF-responsive proteins across different regimens.
Proteins that showed significantly altered protein abundance in response to (a) IF12 (yellow), (b) IF16 (blue), and (c) EOD (red) regimen are overlaid on the consensus protein-protein interaction network constructed using all IF-responsive proteins.
Figure 3—figure supplement 2.
Figure 3—figure supplement 2.. Functional clusters enriched in IF-modulated network.
Close-knit protein clusters spanning different functional processes from the IF-responsive protein network are shown. The color of each node indicates the IF regimen at which the protein was differentially expressed. Yellow, blue, and red indicate IF12, IF16, and EOD regimens, respectively.
Figure 3—figure supplement 3.
Figure 3—figure supplement 3.. Association perturbations across different IF regimens.
(a) Proteins with altered functional network associations (colored nodes) against a background protein association network assembled from positive and negative co-regulation analysis of all quantified proteins (p≤0.05, hypergeometric test). Only those protein co-regulations that were significant (Benjamini-Hochberg adjusted p≤0.01, correlation test) were included in the background protein association network. The functional involvement of perturbed proteins across different IF regimens is shown below. (b) Proteins showing regimen-specific association perturbations in selected biological processes.
Figure 3—figure supplement 4.
Figure 3—figure supplement 4.. A mitochondrial association network.
(a) Increased representation of mitochondrial proteins among all association perturbed proteins (radar plot). Numbers represent significant of enrichment (negative log10 adjusted p value). (b) Association network of mitochondrial proteins impacted by IF in the heart. The perturbed proteins specific to each IF or AL regimen are indicated by yellow (AL), green (IF12), blue (IF16), and pink (EOD) nodes. Perturbations inferred from positive associations are indicated as red edges, and those from negative associations are shown as blue edges. All gray nodes denote proteins sharing association perturbation with the indicated mitochondrial proteins. Colored borders around the nodes are representative of pathways or processes.
Figure 4.
Figure 4.. Phosphoproteome landscape of IF-induced changes in heart.
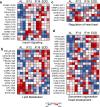
(a) Phosphorylation sites showing significant changes in the hearts of mice in the IF12, IF16, and EOD. Phosphorylation changes observed on structural sarcomere organization proteins are highlighted. (b) Hierarchical clustering of differentially altered phosphopeptides showing increased (red) and decreased (blue) phosphosite abundance. Kinase motifs enriched (p<0.05) in representative clusters are shown (Fisher’s exact test for enrichment). (c) Pathways significantly enriched (p-value ≤0.05) among the differentially altered phosphoproteins across the three IF regimens are visualized as a heatmap (Fisher’s exact test for enrichment). The color scale represents negative log10-transformed p values. (d) Temporal alteration of specific IF-responsive phosphorylation sites in AMPK and cGMP-PKG signaling. n=3 mice in each experimental group.
Figure 4—figure supplement 1.
Figure 4—figure supplement 1.. Site-specific alteration of IF-responsive phosphoproteins.
Temporal alteration of specific IF-responsive phosphorylation sites in insulin signaling (a), lipid metabolism (b), regulation of heartbeat (c), and heart structural remodeling/development (d). Red indicates increased phosphosite abundance, and blue denotes decreased phosphosite abundance. The overall trend among the diet groups based on the phosphoproteome landscape is indicated as brown triangles.
Figure 5.
Figure 5.. Immunoblot validation of the selected proteins in IF-modulated pathways.
(a) Immunoblots that show the effects of IF16 on the expression of selected proteins p-AMPKα/AMPKα, PKG-1, MYPT1, PPARγ, p-GSKαβ/GSKαβ, AKT, p-IRS1/IRS-1 and Insulin receptor β compared to AL group. Data are represented as mean ± S.E.M. n=6 mice in each experimental group. *p<0.05 compared with young sham; **p<0.01 compared with AL group.
Figure 6.
Figure 6.. Echocardiographic analyses of IF on cardiac stress adaptation.
(a) Dobutamine stress tests for ability of the heart to adapt to stress under IF. Heart rate and ejection fraction following administration of dobutamine were measured. Values are the mean ± SD; n=10 each; *p<0.05 (Unpaired t-test). Representative images of long axis M-Mode raw data before and after dobutamine-induced stress are shown in the right panel. (b) Contractility in hearts of IF16 mice compared with AL mice as illustrated by global longitudinal strain (GLS) (upper panel) and radial strain (lower panel). Values are the mean ± SD (n=10 in each experimental group; **p<0.01, ***p<0.001) before and after dobutamine (one-way ANOVA with Tukey’s multiple comparisons test). Representative images of myocardial movement (upper panel) and radial strain (lower panel) before and after dobutamine-induced stress.
Figure 6—figure supplement 1.
Figure 6—figure supplement 1.. Echocardiographic analyses.
(a) Reduced mitral E/A ratio (left panel) and increased deceleration time (right panel) in hearts of IF16 compared to AL mice suggest that IF enhances diastolic function. Values are the mean ± SD; n=10 each; *p<0.05, ***p<0.001. Representative images of mitral pulse waves are shown in the middle panel (Unpaired t-test). (b) Comparison of heart weight:body weight ratio between AL and IF16 groups. Values are the mean ± SEM; ****p<0.0001; n=36–40 each.

Update of

  • doi: 10.1101/2021.03.04.433999
  • doi: 10.7554/eLife.89214.1

References

    1. Ahmet I, Wan R, Mattson MP, Lakatta EG, Talan M. Cardioprotection by intermittent fasting in rats. Circulation. 2005;112:3115–3121. doi: 10.1161/CIRCULATIONAHA.105.563817. - DOI - PubMed
    1. Ahmet I, Tae HJ, de Cabo R, Lakatta EG, Talan MI. Effects of calorie restriction on cardioprotection and cardiovascular health. Journal of Molecular and Cellular Cardiology. 2011;51:263–271. doi: 10.1016/j.yjmcc.2011.04.015. - DOI - PMC - PubMed
    1. Arumugam TV, Phillips TM, Cheng A, Morrell CH, Mattson MP, Wan R. Age and energy intake interact to modify cell stress pathways and stroke outcome. Annals of Neurology. 2010;67:41–52. doi: 10.1002/ana.21798. - DOI - PMC - PubMed
    1. Bernardo BC, Ooi JYY, Weeks KL, Patterson NL, McMullen JR. Understanding key mechanisms of exercise-induced cardiac protection to mitigate disease: Current knowledge and emerging concepts. Physiological Reviews. 2018;98:419–475. doi: 10.1152/physrev.00043.2016. - DOI - PubMed
    1. Bockus LB, Humphries KM. cAMP-dependent Protein Kinase (PKA) signaling is impaired in the diabetic heart. The Journal of Biological Chemistry. 2015;290:29250–29258. doi: 10.1074/jbc.M115.681767. - DOI - PMC - PubMed

Publication types