CRISPR/Cas-Assisted Nanoneedle Sensor for Adenosine Triphosphate Detection in Living Cells
- PMID: 37769296
- PMCID: PMC10623508
- DOI: 10.1021/acsami.3c07918
CRISPR/Cas-Assisted Nanoneedle Sensor for Adenosine Triphosphate Detection in Living Cells
Abstract
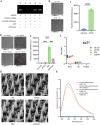
The clustered regularly interspaced short palindromic repeats (CRISPR)-associated protein (Cas) (CRISPR/Cas) systems have recently emerged as powerful molecular biosensing tools based on their collateral cleavage activity due to their simplicity, sensitivity, specificity, and broad applicability. However, the direct application of the collateral cleavage activity for in situ intracellular detection is still challenging. Here, we debut a CRISPR/Cas-assisted nanoneedle sensor (nanoCRISPR) for intracellular adenosine triphosphate (ATP), which avoids the challenges associated with intracellular collateral cleavage by introducing a two-step process of intracellular target recognition, followed by extracellular transduction and detection. ATP recognition occurs by first presenting in the cell cytosol an aptamer-locked Cas12a activator conjugated to nanoneedles; the recognition event unlocks the activator immobilized on the nanoneedles. The nanoneedles are then removed from the cells and exposed to the Cas12a/crRNA complex, where the activator triggers the cleavage of an ssDNA fluorophore-quencher pair, generating a detectable fluorescence signal. NanoCRISPR has an ATP detection limit of 246 nM and a dynamic range from 1.56 to 50 μM. Importantly, nanoCRISPR can detect intracellular ATP in 30 min in live cells without impacting cell viability. We anticipate that the nanoCRISPR approach will contribute to broadening the biomedical applications of CRISPR/Cas sensors for the detection of diverse intracellular molecules in living systems.
Keywords: ATP sensing; CRISPR/Cas; biosensor; nanomedicine; nanoneedles; porous silicon; sensor.
Conflict of interest statement
The authors declare no competing financial interest.
Figures


Similar articles
-
Aptamer assisted CRISPR-Cas12a strategy for small molecule diagnostics.Biosens Bioelectron. 2021 Jul 1;183:113196. doi: 10.1016/j.bios.2021.113196. Epub 2021 Mar 24. Biosens Bioelectron. 2021. PMID: 33839534
-
Hollow covalent organic framework-sheltering CRISPR/Cas12a as an in-vivo nanosensor for ATP imaging.Biosens Bioelectron. 2022 Aug 1;209:114239. doi: 10.1016/j.bios.2022.114239. Epub 2022 Apr 3. Biosens Bioelectron. 2022. PMID: 35429769
-
CRISPR-Cas12a-based efficient electrochemiluminescence biosensor for ATP detection.Anal Chim Acta. 2021 Dec 15;1188:339180. doi: 10.1016/j.aca.2021.339180. Epub 2021 Oct 18. Anal Chim Acta. 2021. PMID: 34794559
-
Multiplexed Detection Strategies for Biosensors Based on the CRISPR-Cas System.ACS Synth Biol. 2024 Jun 21;13(6):1633-1646. doi: 10.1021/acssynbio.4c00161. Epub 2024 Jun 11. ACS Synth Biol. 2024. PMID: 38860462 Review.
-
Signal amplification and output of CRISPR/Cas-based biosensing systems: A review.Anal Chim Acta. 2021 Nov 15;1185:338882. doi: 10.1016/j.aca.2021.338882. Epub 2021 Jul 26. Anal Chim Acta. 2021. PMID: 34711321 Review.
Cited by
-
A comprehensive review on the biomedical frontiers of nanowire applications.Heliyon. 2024 Apr 8;10(8):e29244. doi: 10.1016/j.heliyon.2024.e29244. eCollection 2024 Apr 30. Heliyon. 2024. PMID: 38628721 Free PMC article. Review.
-
Spatially-Resolved Organoid Transfection by Porous Silicon-Mediated Optoporation.Adv Mater. 2024 Dec;36(49):e2407650. doi: 10.1002/adma.202407650. Epub 2024 Oct 17. Adv Mater. 2024. PMID: 39420545 Free PMC article.
-
Nanoneedle-Based Transdermal Gene Delivery: A Minimally Invasive Strategy for Gene Therapy.Int J Mol Sci. 2025 Jun 27;26(13):6235. doi: 10.3390/ijms26136235. Int J Mol Sci. 2025. PMID: 40650006 Free PMC article. Review.
-
Integrating Porous Silicon Nanoneedles within Medical Devices for Nucleic Acid Nanoinjection.ACS Nano. 2024 Jun 11;18(23):14938-14953. doi: 10.1021/acsnano.4c00206. Epub 2024 May 10. ACS Nano. 2024. PMID: 38726598 Free PMC article.
-
Porous Silicon Nanoneedles Efficiently Deliver Adenine Base Editor to Correct a Recurrent Pathogenic COL7A1 Variant in Recessive Dystrophic Epidermolysis Bullosa.Adv Mater. 2025 Apr;37(17):e2414728. doi: 10.1002/adma.202414728. Epub 2025 Mar 12. Adv Mater. 2025. PMID: 40072288 Free PMC article.
References
-
- Hu T.; Chen X. Nano for CRISPR. ACS Nano 2022, 16 (6), 8505–8506. 10.1021/acsnano.2c05431. - DOI
-
- Kim H.; Lee S.; Seo H. W.; Kang B.; Moon J.; Lee K. G.; Yong D.; Kang H.; Jung J.; Lim E.-K.; et al. Clustered Regularly Interspaced Short Palindromic Repeats-Mediated Surface-Enhanced Raman Scattering Assay for Multidrug-Resistant Bacteria. ACS Nano 2020, 14 (12), 17241–17253. 10.1021/acsnano.0c07264. - DOI - PubMed
MeSH terms
Substances
Grants and funding
LinkOut - more resources
Full Text Sources

