

Predicting the phase distribution during multi-channel transcranial alternating current stimulation in silico and in vivo
- PMID: 37769460
- PMCID: PMC10955626
- DOI: 10.1016/j.compbiomed.2023.107516
Predicting the phase distribution during multi-channel transcranial alternating current stimulation in silico and in vivo
Abstract
Background: Transcranial alternating current stimulation (tACS) is a widely used noninvasive brain stimulation (NIBS) technique to affect neural activity. TACS experiments have been coupled with computational simulations to predict the electromagnetic fields within the brain. However, existing simulations are focused on the magnitude of the field. As the possibility of inducing the phase gradient in the brain using multiple tACS electrodes arises, a simulation framework is necessary to investigate and predict the phase gradient of electric fields during multi-channel tACS.
Objective: Here, we develop such a framework for phasor simulation using phasor algebra and evaluate its accuracy using in vivo recordings in monkeys.
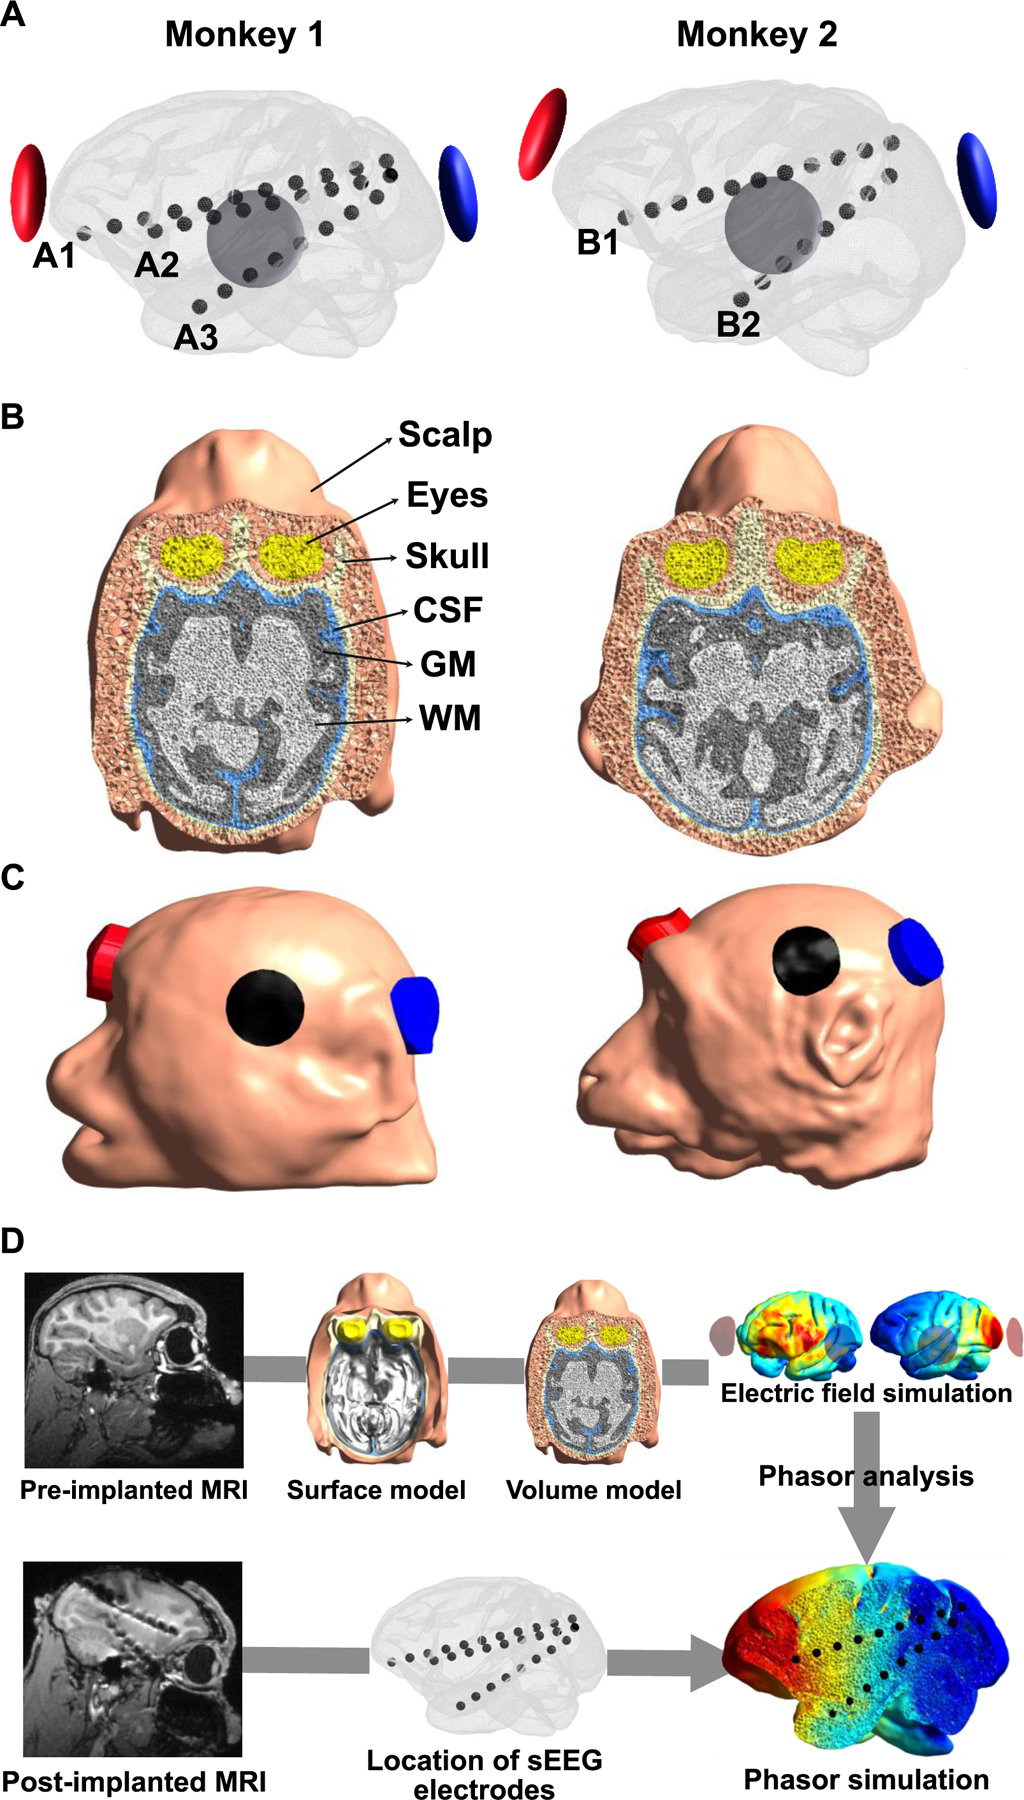
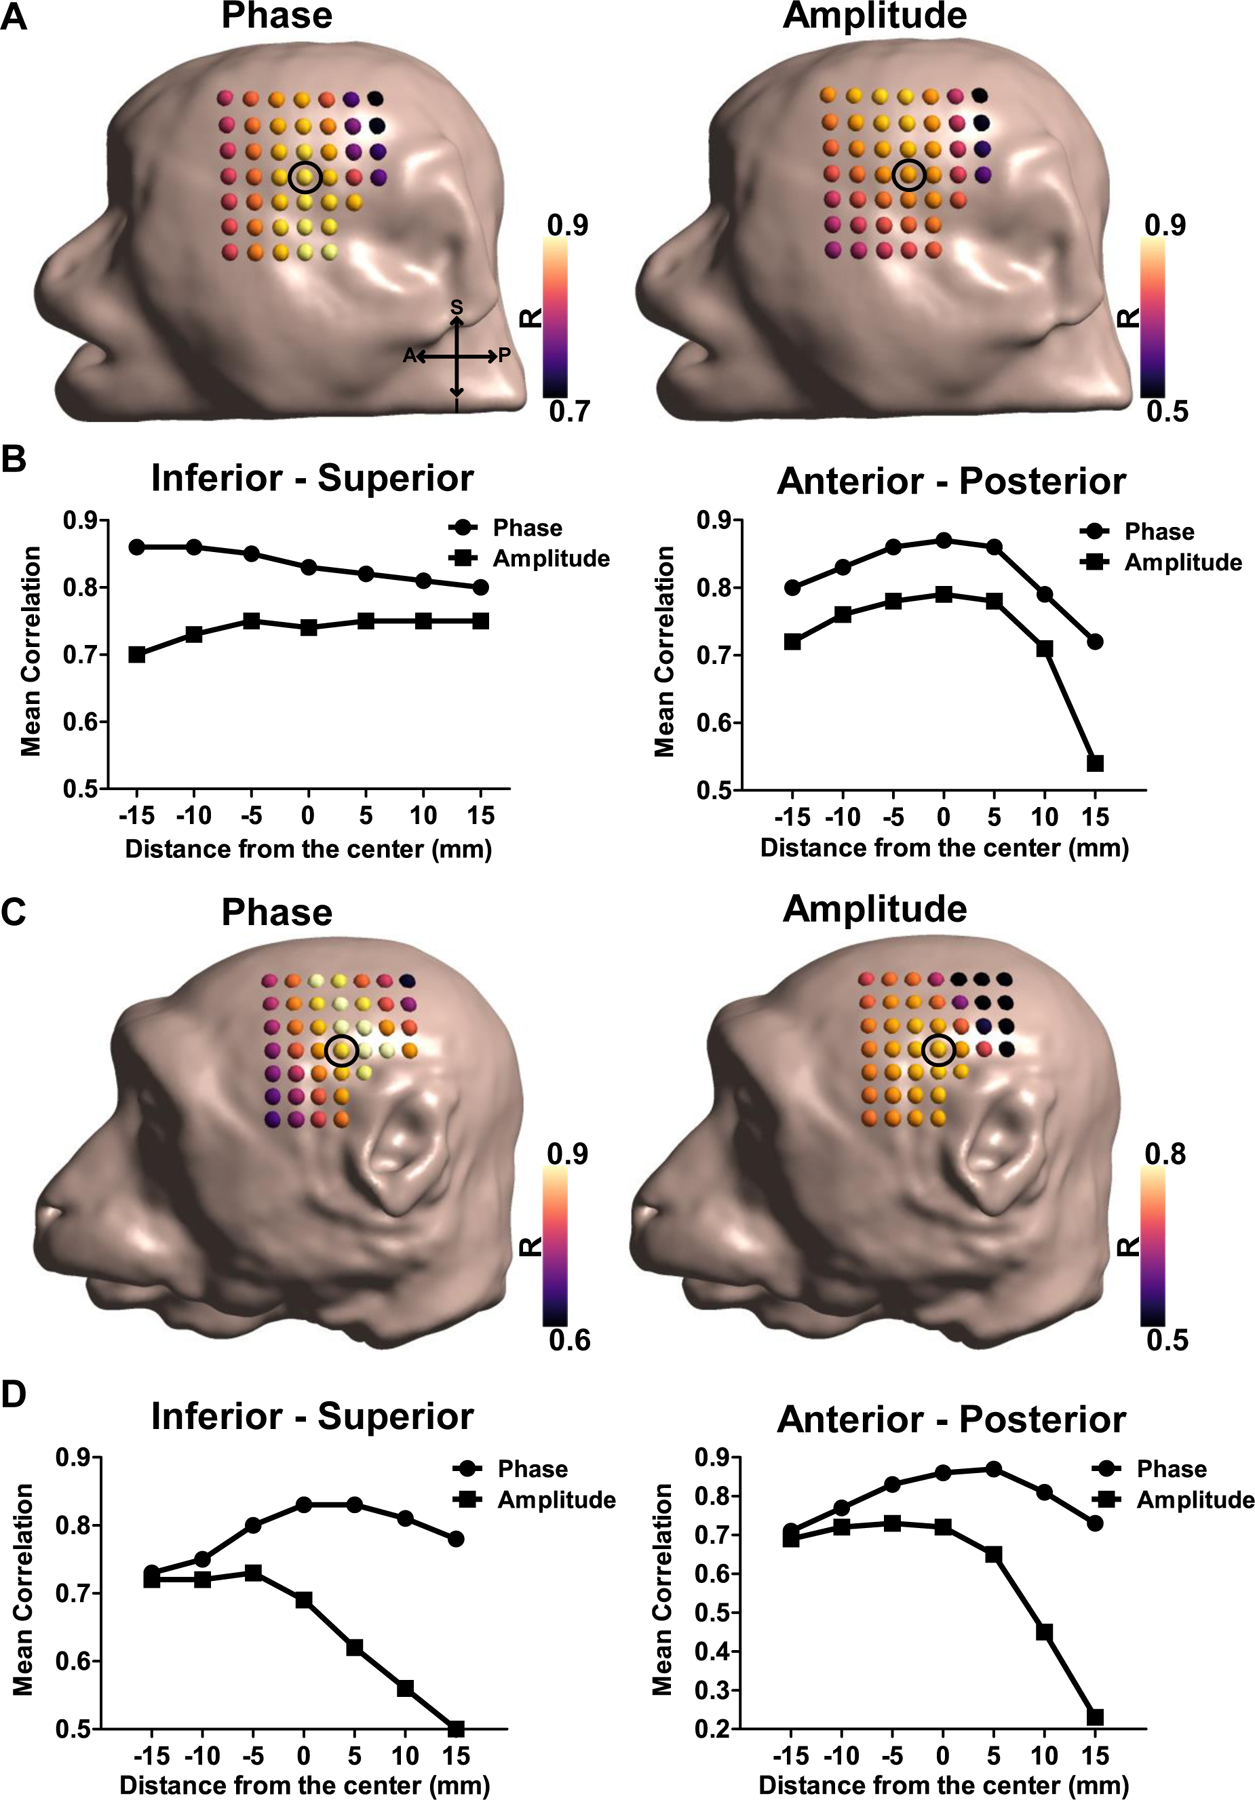
Methods: We extract the phase and amplitude of electric fields from intracranial recordings in two monkeys during multi-channel tACS and compare them to those calculated by phasor analysis using finite element models.
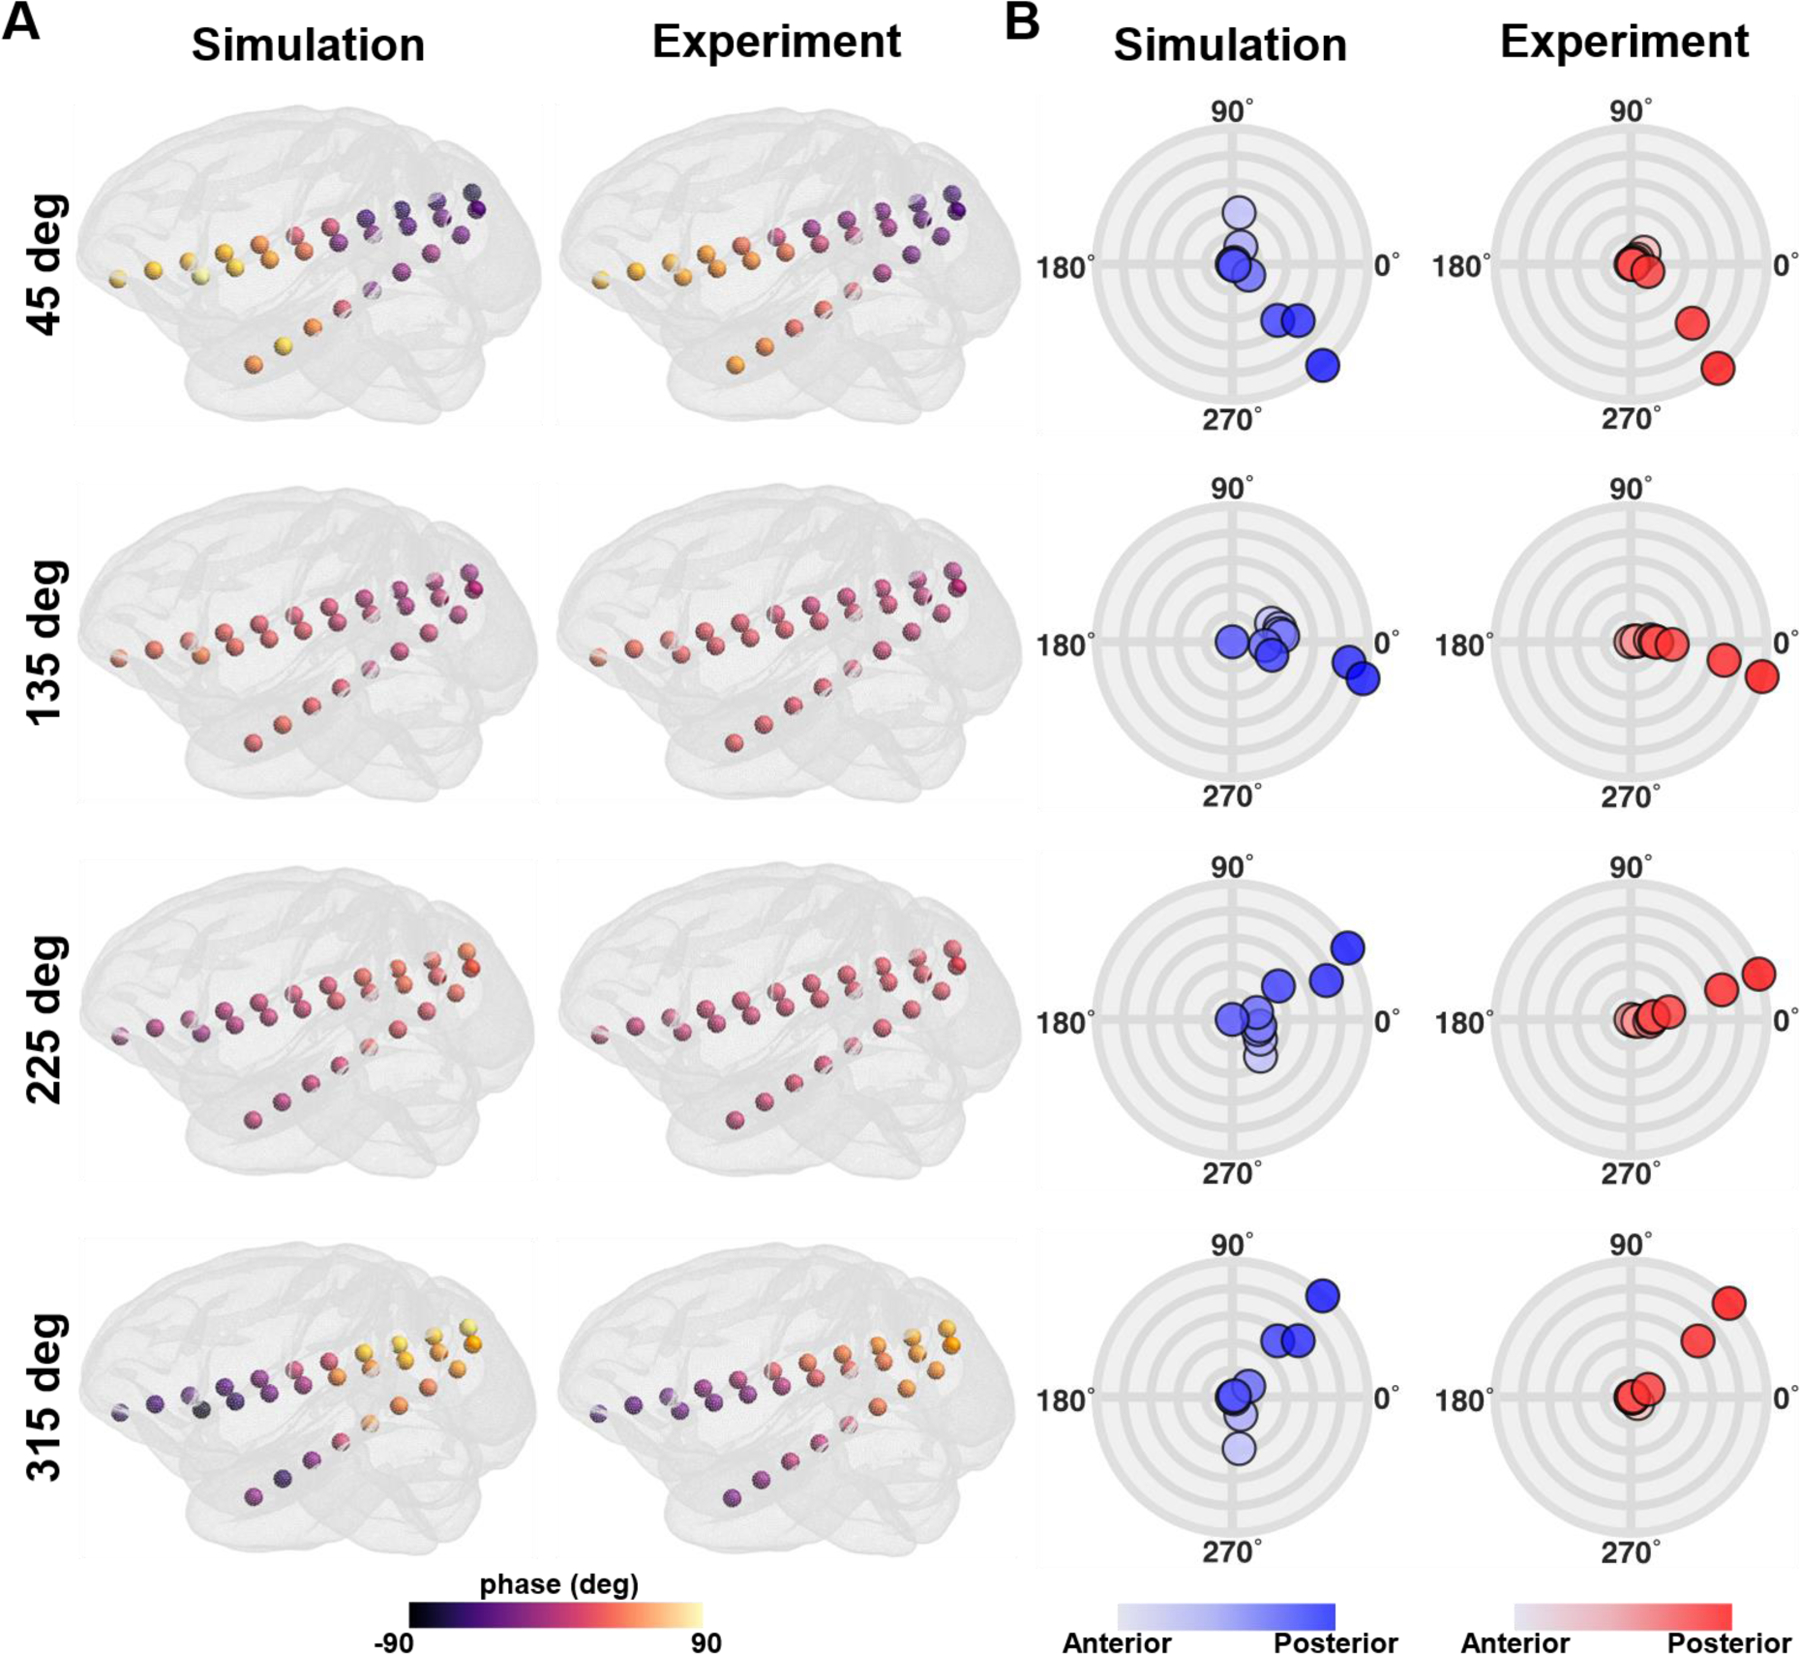
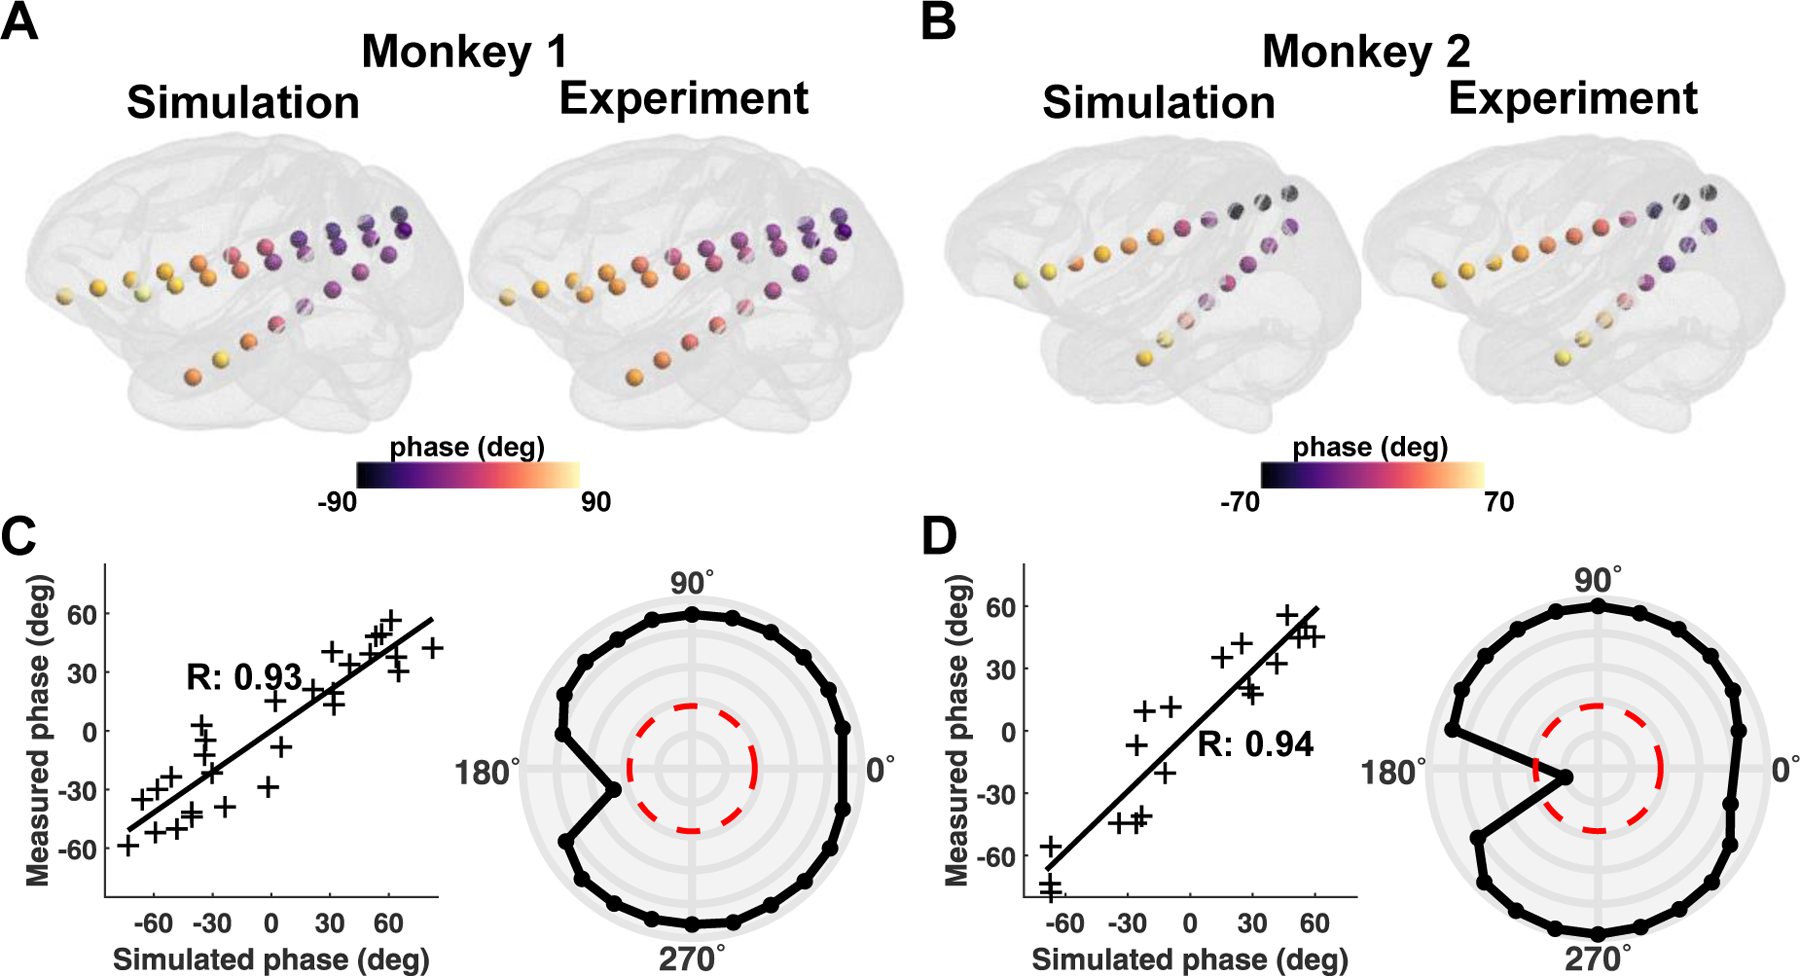
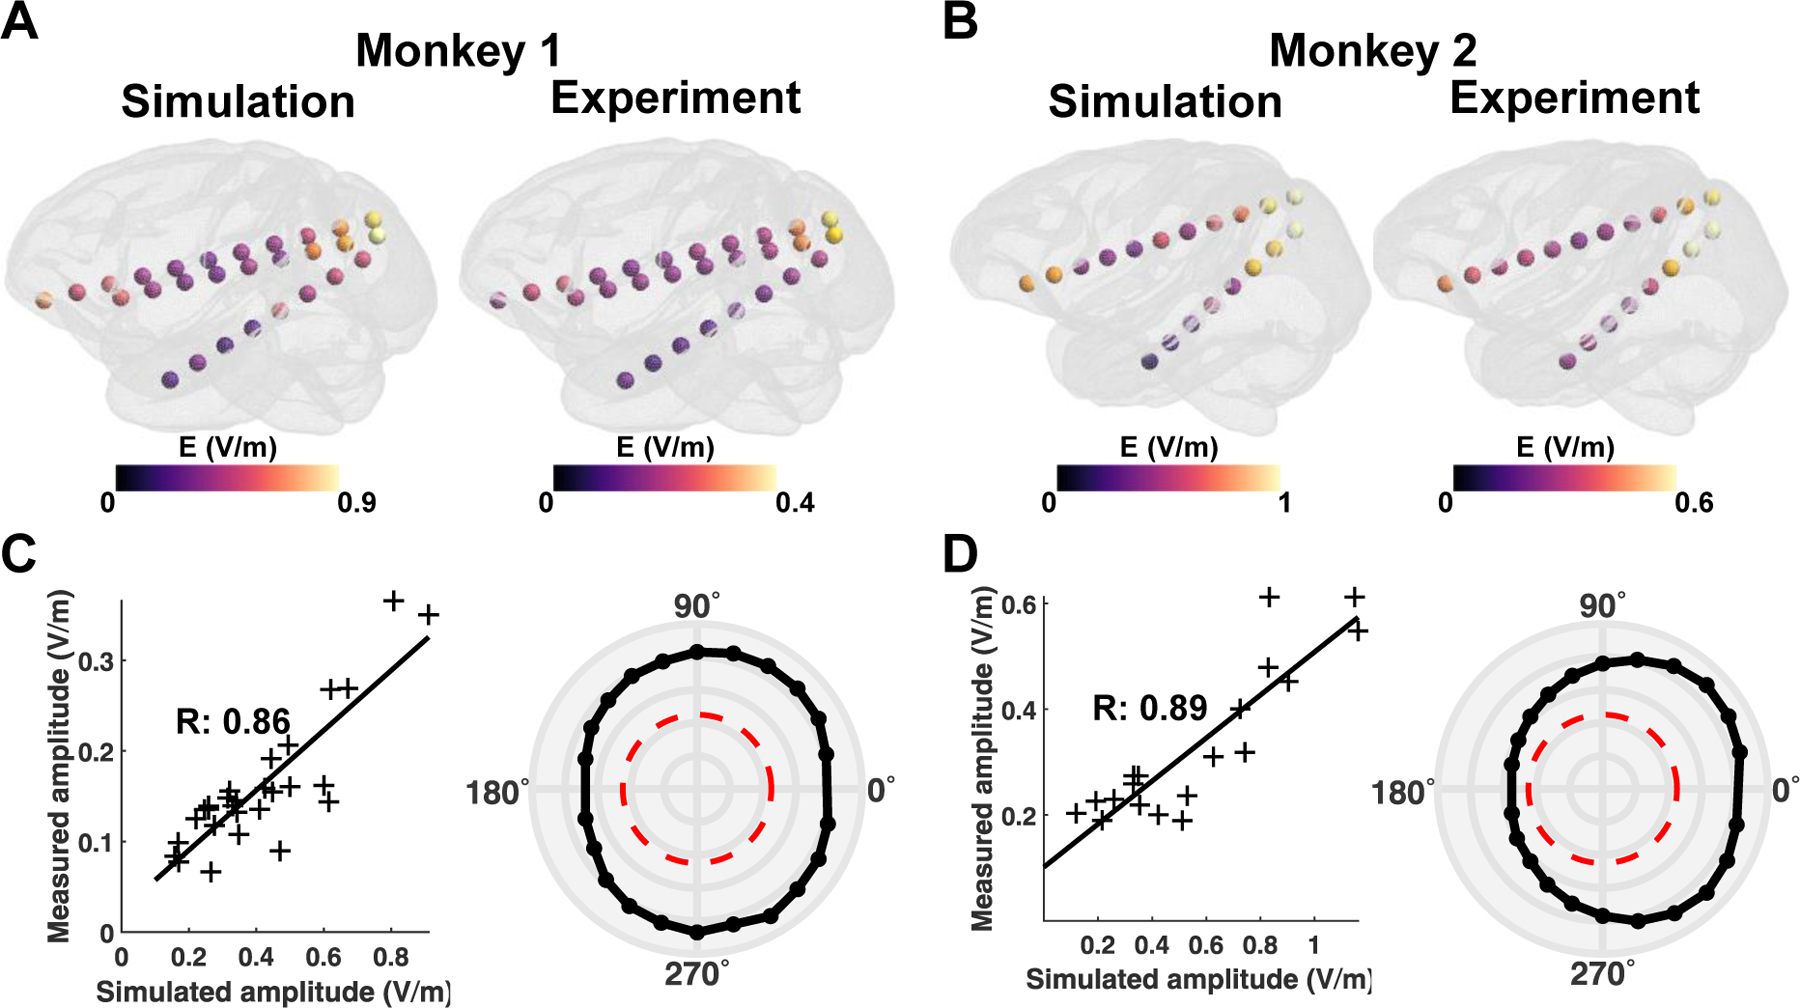
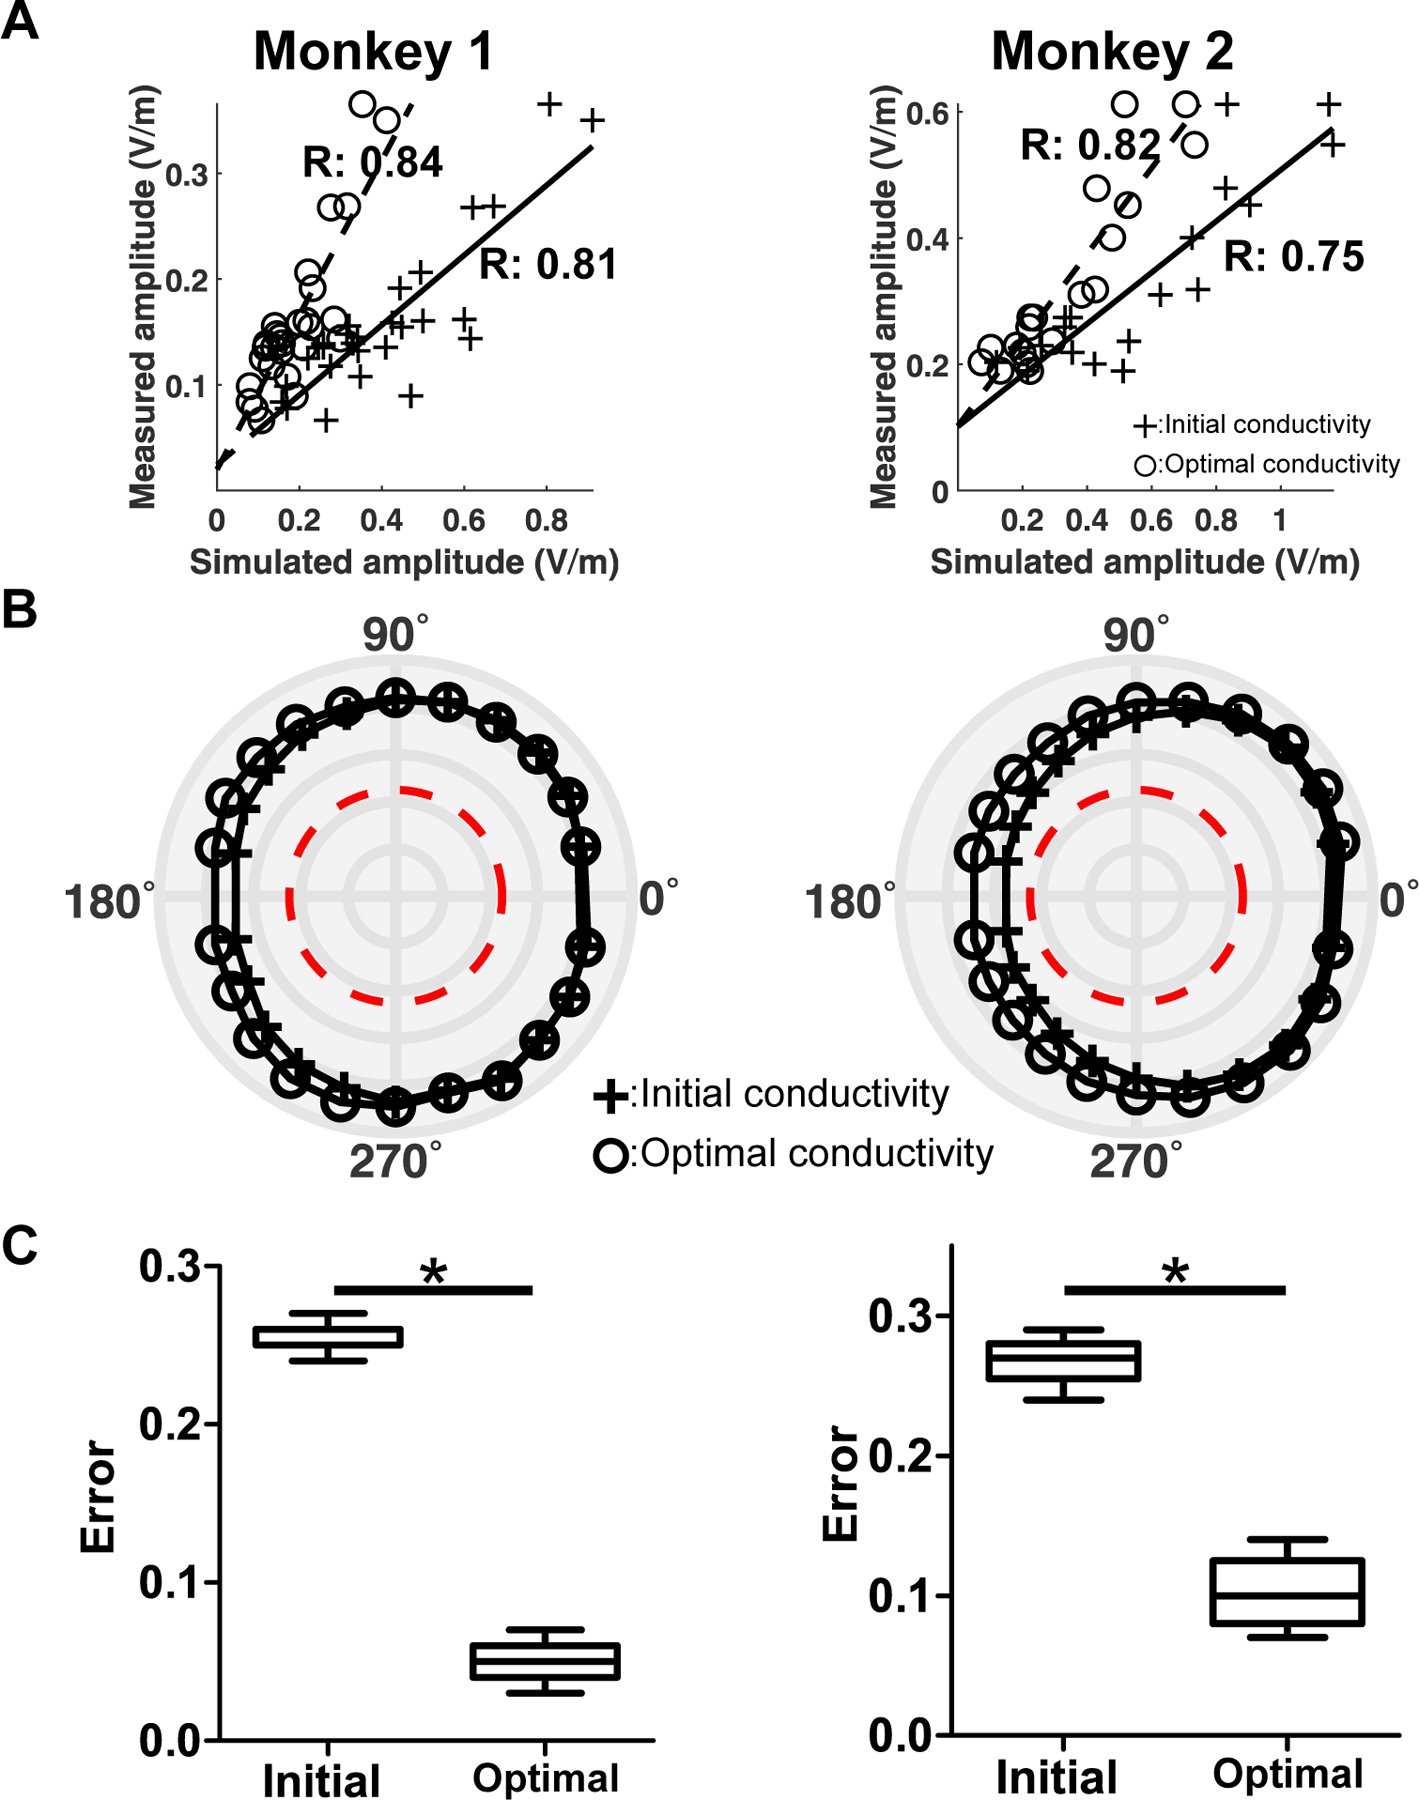
Results: Our findings demonstrate that simulated phases correspond well to measured phases (r = 0.9). Further, we systematically evaluated the impact of accurate electrode placement on modeling and data agreement. Finally, our framework can predict the amplitude distribution in measurements given calibrated tissues' conductivity.
Conclusions: Our validated general framework for simulating multi-phase, multi-electrode tACS provides a streamlined tool for principled planning of multi-channel tACS experiments.
Keywords: Finite element method; Nonhuman primate experiment; Phasor analysis; Transcranial alternating current stimulation.
Copyright © 2023 Elsevier Ltd. All rights reserved.
Conflict of interest statement
Declaration of competing interest The authors declare that they have no competing interests.
Figures
Update of
-
Experimental validation of computational models for the prediction of phase distribution during multi-channel transcranial alternating current stimulation.bioRxiv [Preprint]. 2023 Apr 8:2023.04.07.536090. doi: 10.1101/2023.04.07.536090. bioRxiv. 2023. Update in: Comput Biol Med. 2023 Nov;166:107516. doi: 10.1016/j.compbiomed.2023.107516. PMID: 37066288 Free PMC article. Updated. Preprint.
Similar articles
-
Experimental validation of computational models for the prediction of phase distribution during multi-channel transcranial alternating current stimulation.bioRxiv [Preprint]. 2023 Apr 8:2023.04.07.536090. doi: 10.1101/2023.04.07.536090. bioRxiv. 2023. Update in: Comput Biol Med. 2023 Nov;166:107516. doi: 10.1016/j.compbiomed.2023.107516. PMID: 37066288 Free PMC article. Updated. Preprint.
-
Electric field dynamics in the brain during multi-electrode transcranial electric stimulation.Nat Commun. 2019 Jun 12;10(1):2573. doi: 10.1038/s41467-019-10581-7. Nat Commun. 2019. PMID: 31189931 Free PMC article.
-
Prospects for transcranial temporal interference stimulation in humans: A computational study.Neuroimage. 2019 Nov 15;202:116124. doi: 10.1016/j.neuroimage.2019.116124. Epub 2019 Aug 29. Neuroimage. 2019. PMID: 31473351 Free PMC article.
-
[Transcranial alternating current stimulation. Entrainment and function control of neuronal networks].Nervenarzt. 2015 Dec;86(12):1516-22. doi: 10.1007/s00115-015-4317-6. Nervenarzt. 2015. PMID: 26440521 Review. German.
-
Aligning Event-Related Potentials with Transcranial Alternating Current Stimulation for Modulation-a Review.Brain Topogr. 2024 Nov;37(6):933-946. doi: 10.1007/s10548-024-01055-1. Epub 2024 Apr 30. Brain Topogr. 2024. PMID: 38689065 Free PMC article. Review.
Cited by
-
Quasistatic approximation in neuromodulation.J Neural Eng. 2024 Jul 24;21(4):10.1088/1741-2552/ad625e. doi: 10.1088/1741-2552/ad625e. J Neural Eng. 2024. PMID: 38994790 Free PMC article. Review.
-
Layers of the monkey visual cortex are selectively modulated during electrical stimulation.PLoS Biol. 2025 Jul 7;23(7):e3003278. doi: 10.1371/journal.pbio.3003278. eCollection 2025 Jul. PLoS Biol. 2025. PMID: 40623093 Free PMC article.
-
Modulation of motor excitability reflects traveling waves of neural oscillations.Cell Rep. 2025 Jun 24;44(6):115864. doi: 10.1016/j.celrep.2025.115864. Epub 2025 Jun 14. Cell Rep. 2025. PMID: 40517384 Free PMC article.
References
-
- Alekseichuk I, et al., Spatial working memory in humans depends on theta and high gamma synchronization in the prefrontal cortex. Current biology, 2016. 26(12): p. 1513–1521. - PubMed
-
- Alekseichuk I, et al., Model-driven neuromodulation of the right posterior region promotes encoding of long-term memories. Brain Stimulation, 2020. 13(2): p. 474–483. - PubMed
-
- Schilberg L, et al., Phase of beta-frequency tACS over primary motor cortex modulates corticospinal excitability. cortex, 2018. 103: p. 142–152. - PubMed
MeSH terms
Grants and funding
LinkOut - more resources
Full Text Sources
Research Materials
