. 2023 Nov:67:102895.
doi: 10.1016/j.redox.2023.102895. Epub 2023 Sep 21.

Increasing glutathione levels by a novel posttranslational mechanism inhibits neuronal hyperexcitability

Affiliations

Increasing glutathione levels by a novel posttranslational mechanism inhibits neuronal hyperexcitability

Ashwini Sri Hari et al. Redox Biol. 2023 Nov.

Abstract

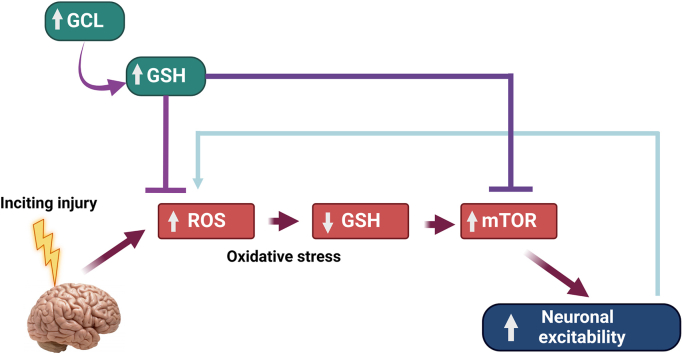
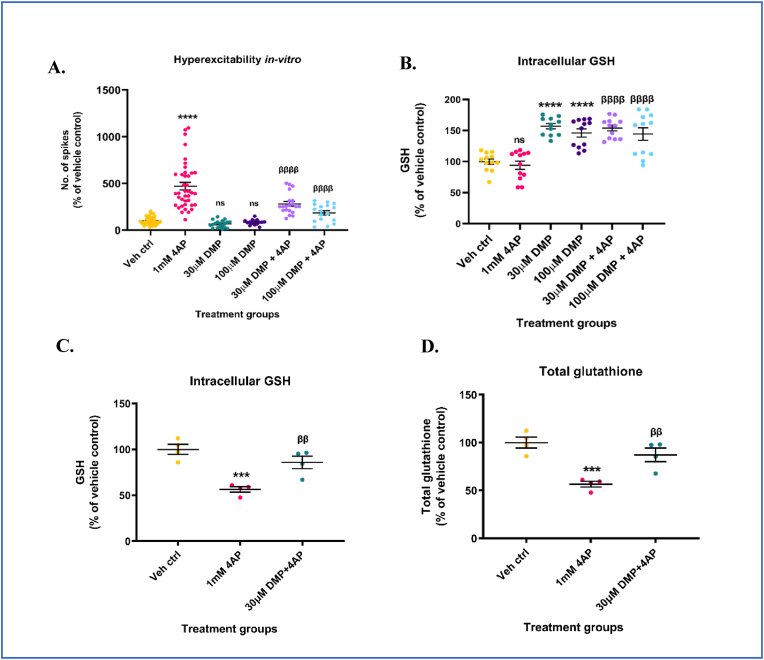
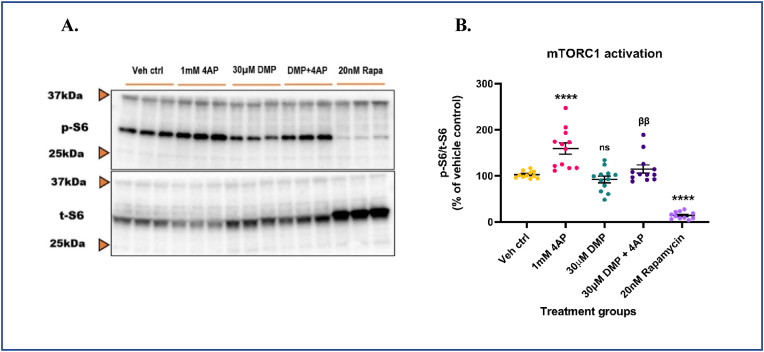
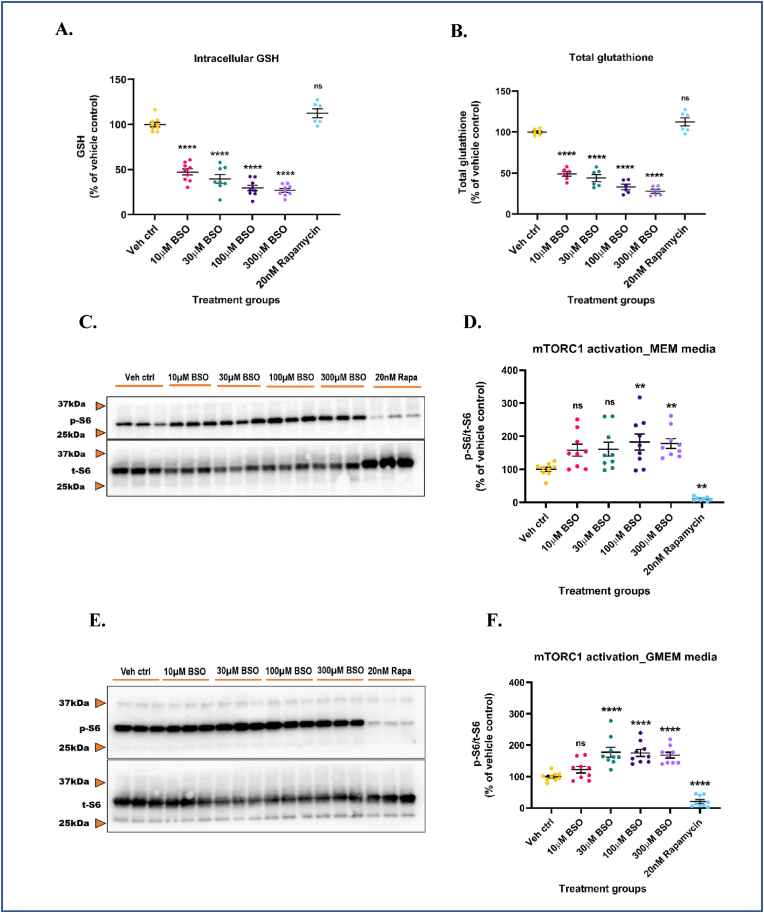
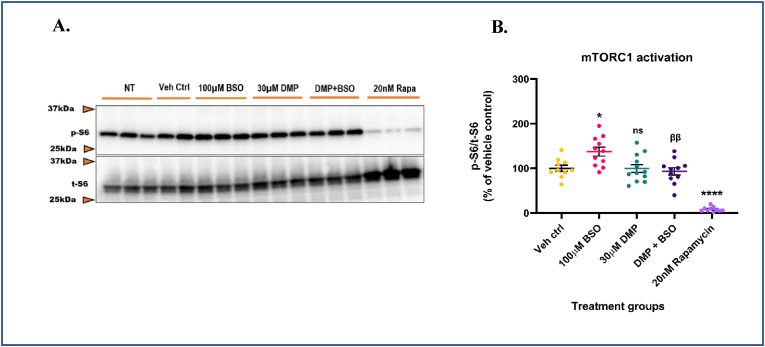
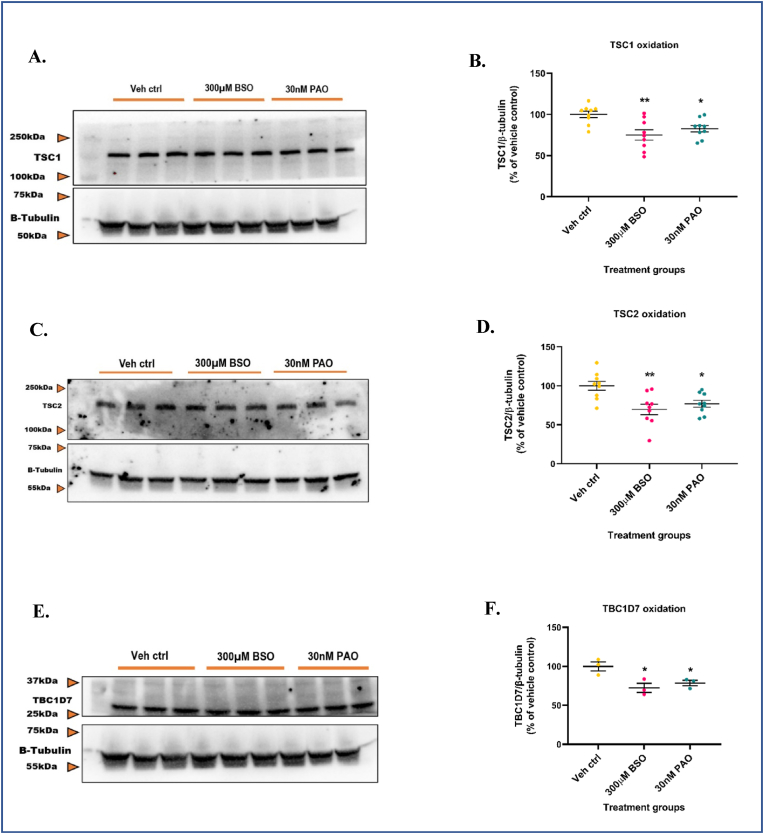
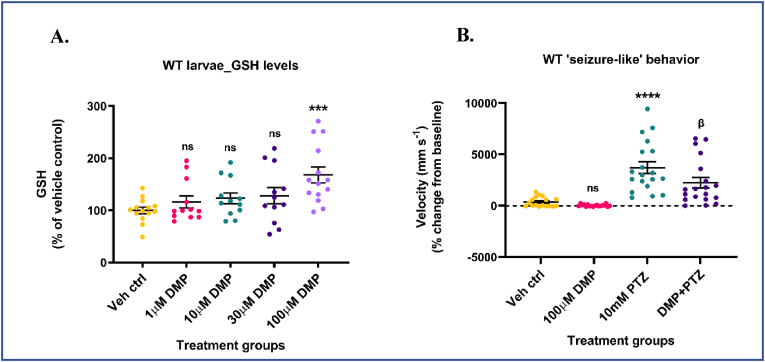
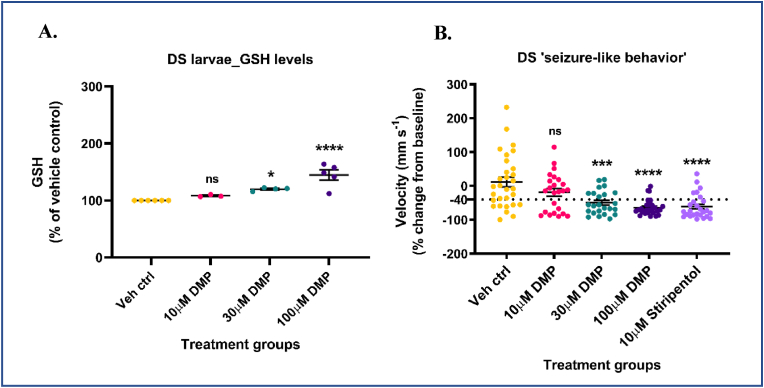
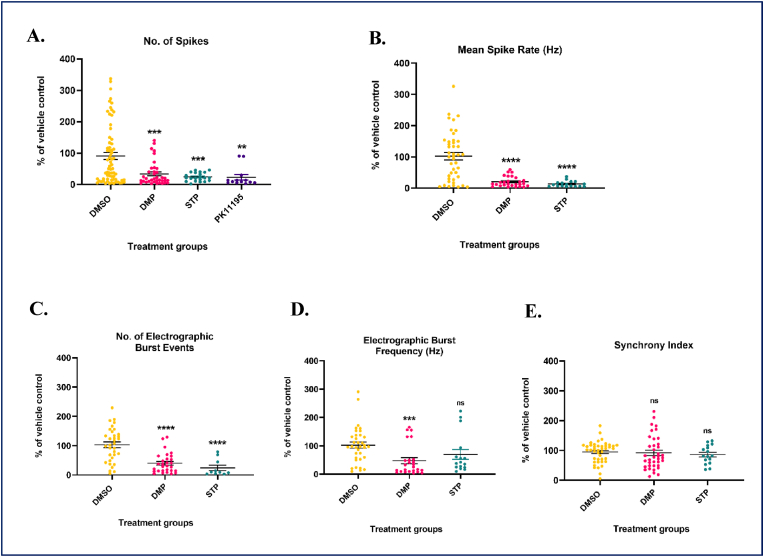
Glutathione (GSH) depletion, and impaired redox homeostasis have been observed in experimental animal models and patients with epilepsy. Pleiotropic strategies that elevate GSH levels via transcriptional regulation have been shown to significantly decrease oxidative stress and seizure frequency, increase seizure threshold, and rescue certain cognitive deficits. Whether elevation of GSH per se alters neuronal hyperexcitability remains unanswered. We previously showed that thiols such as dimercaprol (DMP) elevate GSH via post-translational activation of glutamate cysteine ligase (GCL), the rate limiting GSH biosynthetic enzyme. Here, we asked if elevation of cellular GSH by DMP altered neuronal hyperexcitability in-vitro and in-vivo. Treatment of primary neuronal-glial cerebrocortical cultures with DMP elevated GSH and inhibited a voltage-gated potassium channel blocker (4-aminopyridine, 4AP) induced neuronal hyperexcitability. DMP increased GSH in wildtype (WT) zebrafish larvae and significantly attenuated convulsant pentylenetetrazol (PTZ)-induced acute 'seizure-like' swim behavior. DMP treatment increased GSH and inhibited convulsive, spontaneous 'seizure-like' swim behavior in the Dravet Syndrome (DS) zebrafish larvae (scn1Lab). Furthermore, DMP treatment significantly decreased spontaneous electrographic seizures and associated seizure parameters in scn1Lab zebrafish larvae. We investigated the role of the redox-sensitive mammalian target of rapamycin (mTOR) pathway due to the presence of several cysteine-rich proteins and their involvement in regulating neuronal excitability. Treatment of primary neuronal-glial cerebrocortical cultures with 4AP or l-buthionine-(S,R)-sulfoximine (BSO), an irreversible inhibitor of GSH biosynthesis, significantly increased mTOR complex I (mTORC1) activity which was rescued by pre-treatment with DMP. Furthermore, BSO-mediated GSH depletion oxidatively modified the tuberous sclerosis protein complex (TSC) consisting of hamartin (TSC1), tuberin (TSC2), and TBC1 domain family member 7 (TBC1D7) which are critical negative regulators of mTORC1. In summary, our results suggest that DMP-mediated GSH elevation by a novel post-translational mechanism can inhibit neuronal hyperexcitability both in-vitro and in-vivo and a plausible link is the redox sensitive mTORC1 pathway.

Keywords: Glutamate cysteine ligase; Glutathione; Neuronal hyperexcitability; Oxidative stress; mTORC1.


Conflict of interest statement

Declaration of competing interest The authors declare that they have no known competing financial interests or personal relationships that could have appeared to influence the work reported in this paper.

Figures

Image 1
Graphical abstract
Fig. 1
Fig. 1
Dimercaprol (DMP) elevates intracellular GSH levels and protects against 4-aminopyridine (4AP)-induced neuronal hyperexcitability and GSH depletion. Primary neuronal-glial cerebrocortical cultures were pretreated with either 30 μM or 100 μM dimercaprol for 4 h followed by 1 mM 4AP stimulation for 1 h following which extracellular action potentials (number of spikes), and reduced glutathione (GSH) levels were measured. (A) Number of spikes measured on MEA system (B) GSH levels measured by HPLC. Primary neuronal-glial cerebrocortical cultures were treated with 30 μM DMP for 4 h followed by 1 mM 4AP treatment for 20 h. GSH and GSSG levels were measured by HPLC after the 24 h treatment paradigm. (C) GSH levels, and (D) Total glutathione (GSH+(2*GSSG)) levels. Data are represented as mean ± SEM (error bars). ***p < 0.001, ****p < 0.0001, ns: not significant versus vehicle control, ββp<0.01, ββββp<0.0001 versus 1 mM 4AP by one-way ANOVA with Tukey's post-hoc test. n = 7–8/grp (A), n = 2–4/grp (B, C, and D). N = 3–4 experimental replicates. Mean ± SD of raw data values of GSH normalized to total protein (nmol/mg protein) are stated in parentheses (GSH): a) Veh ctrl (13.6 ± 7.4); b) 1 mM 4AP (11.9 ± 4.1); c) 30 μM DMP (20.9 ± 10.7); d) 100 μM DMP (19.7 ± 9.6); e) 30 μM DMP+4AP (20.9 ± 10.2); and f) 100 μM DMP+4AP (19.4 ± 9.8) (1B); Mean ± SD of raw data values of GSH and total glutathione normalized to total protein (nmol/mg protein) are stated in parentheses (GSH; total glutathione) for each treatment group: a) Veh ctrl (23.66 ± 2.63; 23.76 ± 2.68); 1 mM 4AP (13.35 ± 1.43; 13.44 ± 1.42); 30 μM DMP+1 mM 4AP (20.29 ± 3.22; 20.71 ± 3.38) (1C and 1D).
Fig. 2
Fig. 2
4AP-induced hyperexcitability aberrantly activates mTORC1. Primary neuronal-glial cerebrocortical cultures were pretreated with 30 μM dimercaprol for 4 h and then stimulated with 1 mM 4AP for an additional 4 h. mTORC1 activity represented by phospho-S6 (p-S6)/total S6 (t-S6) was assessed by immunoblotting. 20 nM rapamycin was used as procedural/positive control. (A) Representative blot, and (B) Blot quantification. Data are represented as mean ± SEM (error bars). ****p < 0.0001, ns: not significant versus vehicle control, ββp<0.01 versus 1 mM 4AP by one-way ANOVA with Tukey's post-hoc test. n = 3/grp. N = 4 experimental replicates.
Fig. 3
Fig. 3
Intracellular GSH depletion aberrantly activates mTORC1 in both serum-free and serum-containing media. Primary neuronal-glial cerebrocortical cultures were treated with increasing concentrations of l-buthionine-(S,R)-sulfoximine (BSO) in MEM media and GSH, GSSG levels were measured by HPLC. 20 nM rapamycin was used as an additional negative control for this experiment. (A) GSH levels and (B) Total glutathione levels. Cultures were treated with increasing BSO concentrations for 24 h in MEM (serum-fee) (C and D) or GMEM (serum-containing) (E and F) media and mTORC1 activity represented by p-S6/t-S6 was assessed by immunoblotting. (C) Representative mTORC1 immunoblot (MEM media), and (D) Blot quantification. (E) Representative mTORC1 immunoblot (GMEM media), and (F) Blot quantification. 20 nM rapamycin was used as procedural/positive control for the immunoblotting experiments. Data are represented as mean ± SEM (error bars). **p < 0.01, ****p < 0.0001, ns: not significant versus vehicle control by one-way ANOVA with Dunnett's post-hoc test (A, B, D and F). n = 3/grp. N = 3 experimental replicates. Mean ± SD of raw data values of GSH and total glutathione normalized to total protein (nmol/mg protein) are stated in parentheses (GSH; total glutathione) for each treatment group: a) Veh ctrl (6.3 ± 4.9; 9.5 ± 2.0); b) 10 μM BSO (3.0 ± 2.3; 4.6 ± 0.6); c) 30 μM BSO (3.0 ± 1.9; 4 ± 0.3); d) 100 μM BSO (2.0 ± 1.5; 3.0 ± 0.3); e) 300 μM BSO (1.7 ± 1.3; 2.6 ± 0.2); and f) 20 nM Rapamycin (10.4 ± 1.1; 10.5 ± 1.1) (3A and 3B).
Fig. 4
Fig. 4
GSH depletion hyperactivates mTORC1 and its repletion protects against aberrant mTORC1 activation. Primary neuronal-glial cerebrocortical cultures were pre-treated with 30 μM dimercaprol for 4 h followed by 100 μM BSO treatment for 20 h in MEM media. 20 nM rapamycin was used as procedural/positive control. mTORC1 activity represented by p-S6/t-S6 was assessed by immunoblotting. No treatment control (NT) represents primary neuronal-glial cerebrocortical cultures treated with plain serum-free MEM media. This control was run to assess basal mTORC1 activity in the cultures and it was not significantly different (P = 0.4767) compared to the vehicle control group. (A) Representative mTORC1 immunoblot, and (B) Blot quantification. Data are represented as mean ± SEM (error bars). *p < 0.05, ****p < 0.0001, ns: not significant versus vehicle control; ββp<0.01 versus 100 μM BSO by one-way ANOVA with Tukey's post-hoc test. n = 2–3/grp. N = 4 experimental replicates.
Fig. 5
Fig. 5
GSH depletion oxidizes TSC1, TSC2, and TBC1D7 in the mTORC1 pathway. Primary neuronal-glial cerebrocortical cultures were treated with 300 μM BSO for 24 h and the total proteins TSC1, TSC2, and TBC1D7 normalized to loading control β-tubulin were probed for by redox-western blotting. 30 nM PAO was used as positive control. (A) Representative blot, and (B) Blot quantification for TSC1. (C) Representative blot, and (D) Blot quantification for TSC2. (E) Representative blot, and (F) Blot quantification for TBC1D7. Data are represented as mean ± SEM (error bars). *p < 0.05, **p < 0.01 versus vehicle control by one-way ANOVA with Dunnett's post-hoc test. n = 3/grp. N = 3 experimental replicates.
Fig. 6
Fig. 6
Dimercaprol increases GSH and attenuates acute ‘seizure-like’ swim behavior in wildtype larvae. 5-7 dpf wildtype (WT) zebrafish larvae were treated with 1, 10, 30 or 100 μM dimercaprol for 4 h. GSH levels were measured by HPLC. (A) Larval GSH levels. WT larvae were pre-treated with 100 μM DMP for 4 h and stimulated with 10 mM PTZ for 40min. Larval locomotion/swim behavior was measured by the Noldus DanioVision system running the EthoVisionXT software. (B) Change in larval swim velocity correlated to ‘seizure-like’ behavior. Data are represented as mean ± SEM (error bars). ***p < 0.001, ****p < 0.0001, ns: not significant versus vehicle control; βp<0.05 versus 10 mM PTZ by one-way ANOVA with Dunnett's post-hoc test (A) and Tukey's post-hoc test (B). n = 50–70 larvae pooled/grp (HPLC assay) and n = 10 larvae/grp (Noldus assay). N = 4–5 experimental replicates. Mean ± SD of raw data values of GSH normalized to total protein (nmol/mg protein) are stated in parentheses (GSH) for each treatment group: a) Veh ctrl (14.9 ± 7.7); b) 1 μM DMP (14.9 ± 5.9); c) 10 μM DMP (16.2 ± 6.9); d) 30 μM DMP (15.5 ± 4.7); and e) 100 μM DMP (21.7 ± 5.4) (6A).
Fig. 7
Fig. 7
Dimercaprol increases GSH levels and inhibits spontaneous ‘seizure-like’ swim behavior in DS (scn1Lab) mutants. 5-7 dpf scn1Lab mutants were treated with 10, 30 or 100 μM dimercaprol for 4 h. GSH levels were measured by HPLC. (A) DS mutants' GSH levels. DS mutants were treated with increasing concentrations of DMP for 4 h and swim behavior was assessed by the Noldus DanioVision system running the EthoVisionXT software. 10 μM stiripentol was used as a positive control. (B) Change in larval swim velocity correlated to ‘seizure-like’ behavior. The dotted black line at ∼ −40% represents the cut-off point below which velocity values corresponding to larval swim behavior are considered significantly reduced. Data are represented as mean ± SEM (error bars). *p < 0.05, ***p < 0.001, ****p < 0.0001, ns: not significant versus vehicle control by one-way ANOVA with Dunnett's post-hoc test (A and B). n = 50–70 larvae pooled/grp (HPLC assay) and n = 10 larvae/grp (Noldus assay). N = 4–5 experimental replicates. Mean ± SD of raw data values of GSH normalized to total protein (nmol/mg protein) are stated in parentheses (GSH) for each treatment group: a) Veh ctrl (14.2 ± 2.7); b) 10 μM DMP (15.2 ± 4.4); c) 30 μM DMP (16.3 ± 2.4); and d) 100 μM DMP (19.8 ± 2.0) (7A).
Fig. 8
Fig. 8
Dimercaprol treatment significantly decreases a series of ‘seizure-like’ parameters in DS (scn1Lab) mutants. DS mutants were treated with 100 μM dimercaprol for 4 h. Dimethyl sulfoxide (DMSO, < ∼1%) was used as vehicle control. 10 μM stiripentol (STP), and 10 μM PK11195 were used as positive controls. (A) No. of spikes, (B) Mean spike rate, (C) Number of electrographic burst events, (D) Electrographic burst frequency, and (E) Synchrony index were assessed by the Axion MEA system. The minimum threshold value for all parameters was set to be greater than 3% to be considered a reliable/true signal. Data are represented as mean ± SEM (error bars). **p < 0.01, ***p < 0.001, ****p < 0.0001, ns: not significant versus vehicle control by one-way ANOVA with Dunnett's post-hoc test. n = 3–5 larvae/grp. N = 10 experimental replicates.

References

    1. Scheffer I.E., Berkovic S., Capovilla G., et al. ILAE classification of the epilepsies: position paper of the ILAE commission for classification and terminology. Epilepsia. 2017;58(4):512–521. - PMC - PubMed
    1. England M.J., Liverman C.T., Schultz A.M., Strawbridge L.M. Epilepsy across the spectrum: promoting health and understanding. A summary of the Institute of Medicine report. Epilepsy Behav. 2012;25(2):266–276. - PMC - PubMed
    1. Dalic L., Cook M.J. Managing drug-resistant epilepsy: challenges and solutions. Neuropsychiatr Dis Treat. 2016;12:2605–2616. - PMC - PubMed
    1. Kwan P., Arzimanoglou A., Berg A.T., et al. Definition of drug resistant epilepsy: consensus proposal by the ad hoc Task Force of the ILAE Commission on Therapeutic Strategies. Epilepsia. 2010;51(6):1069–1077. - PubMed
    1. O'Dell C.M., Das A., Wallace Gt, Ray S.K., Banik N.L. Understanding the basic mechanisms underlying seizures in mesial temporal lobe epilepsy and possible therapeutic targets: a review. J. Neurosci. Res. 2012;90(5):913–924. - PMC - PubMed

Publication types

MeSH terms

Substances

LinkOut - more resources