. 2023 Oct 17;4(10):101206.
doi: 10.1016/j.xcrm.2023.101206. Epub 2023 Sep 27.

Ablation of ERO1A induces lethal endoplasmic reticulum stress responses and immunogenic cell death to activate anti-tumor immunity

Affiliations

Ablation of ERO1A induces lethal endoplasmic reticulum stress responses and immunogenic cell death to activate anti-tumor immunity

Lihui Liu et al. Cell Rep Med. .

Abstract

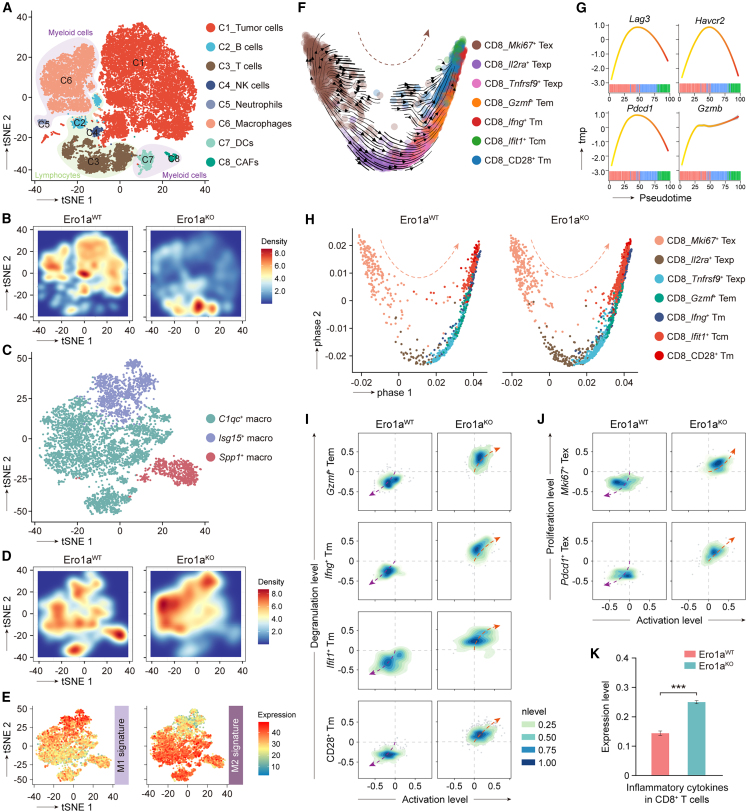
Immunophenotyping of the tumor microenvironment (TME) is essential for enhancing immunotherapy efficacy. However, strategies for characterizing the TME exhibit significant heterogeneity. Here, we show that endoplasmic reticular oxidoreductase-1α (ERO1A) mediates an immune-suppressive TME and attenuates the response to PD-1 blockade. Ablation of ERO1A in tumor cells substantially incites anti-tumor T cell immunity and promotes the efficacy of aPD-1 in therapeutic models. Single-cell RNA-sequencing analyses confirm that ERO1A correlates with immunosuppression and dysfunction of CD8+ T cells along anti-PD-1 treatment. In human lung cancer, high ERO1A expression is associated with a higher risk of recurrence following neoadjuvant immunotherapy. Mechanistically, ERO1A ablation impairs the balance between IRE1α and PERK signaling activities and induces lethal unfolded protein responses in tumor cells undergoing endoplasmic reticulum stress, thereby enhancing anti-tumor immunity via immunogenic cell death. These findings reveal how tumor ERO1A induces immunosuppression, highlighting its potential as a therapeutic target for cancer immunotherapy.

Keywords: ERO1A; endoplasmic reticulum stress response; immune target; immunotherapy; tumor microenvironment.


Conflict of interest statement

Declaration of interests The authors declare no competing interests.

Figures

None
Graphical abstract
Figure 1
Figure 1
ERO1A attenuates the anti-tumor efficacy of aPD-1 treatment in immunocompetent hosts (A) Western blot of ERO1A in MC-38 cells. Ero1aWT cells were integreated with non-targeting CRISPR-Cas9 vector. Ero1aKO cells were rescued by transduction with lentiviruses expressing empty vector (Ero1aEV) or the full length of mouse ERO1A cDNA (Ero1aOE). Result is a representative of three experiments. (B–D) Tumor volume in C57BL/6 mice bearing LLC Ero1aWT or LLC Ero1aKO tumors (B) or B16 (C) and MC-38 counterparts (D), treated with isotype or aPD-1 blockade (n = 5 mice/group). Data presented as means ± SEMs. ∗p < 0.05, ∗∗∗p < 0.001. ns, not significant. Two-sided Student’s t test. (E and F) Tumor weight (E) and tumor growth (F) of MC-38 Ero1aWT or Ero1aKO tumors in C57BL/6 hosts with or without aPD-1 treatment (n = 5 mice/group). Data presented as means ± SDs. ∗p < 0.05, ∗∗∗p < 0.001. ns, not significant. Two-sided Student’s t test. (G) Rescue of MC-38 Ero1aKO tumor growth in C57BL/6 hosts during six rounds of aPD-1 treatment (n = 5 mice/group). MC-38 Ero1aKO cells were rescued by transduction with lentiviruses expressing empty vector (Ero1aEV) or the full length of mouse ERO1A cDNA (Ero1aOE). Data presented as means ± SEMs. ∗∗∗p < 0.001. Two-sided Student’s t test. (H and I) Tumor volume in immunodeficient BALB/c nude mice (H) or CD8+ depleted C57BL/6 mice (I) bearing MC-38 Ero1aWT or Ero1aKO tumors (n = 5 mice/group). Data presented as means ± SEMs. ns, not significant. Two-sided Student’s t test. (J) Multiplex immunofluorescent staining of CD4, CD8, and Nk1.1 using MC-38 Ero1aWT and Ero1aKO tumor samples (representative of n = 3 mice/group). Tumors were collected after two rounds of aPD-1 treatment. Scale bars, 100 μm.
Figure 2
Figure 2
ERO1A induces T cell dysfunction in response to aPD-1 treatment (A) t-distributed stochastic neighbor embedding (t-SNE) visualization of major cell clusters, colored by cell subtype. Tumors were collected after two rounds of aPD-1 treatment and processed for scRNA-seq (n = 5 mice/group). CAFs, cancer-associated fibroblasts. DCs, dendritic cells. NK, natural killer. (B) t-SNE map of major cell types in MC-38 Ero1aWT and Ero1aKO tumors. Colored by cell subtype. (C) t-SNE map indicating the macrophage clusters based on the scRNA-seq data. Colored by cell subtype. (D) t-SNE map showing the sample origins of macrophages in MC-38 Ero1aWT and Ero1aKO tumors. Colored by cell subtype. (E) t-SNE map depicting the M1 and M2 macrophage signatures based on the scRNA-seq data. (F) Uniform manifold approximation and projection (UMAP) plot showing the RNA velocity of CD8+ T cell subsets. RNA velocities were visualized on the UMAP of Mki67+ Tex, Il2ra+ Texp, Tnfrsf9+ Texp, Gzmf+ Tem, Ifng+ Tm, Ifit1+ Tcm, and CD28+ Tm using Gaussian smoothing on a regular grid. (G and H) Diffusion map of CD8+ T cell clusters shows a resting-to-activated trajectory. The pseudotime expression changes in Lag3, Pdcd1, Havcr2, and Gzmb in CD8+ T cells (G). Pseudotime trajectory of CD8+ T cell subsets in MC-38 Ero1aWT and Ero1aKO tumors (H). Colored by cell subtype. (I and J) Projection of effective CD8+ T cells (I) and proliferative CD8+ T cells (J) based on cell activation, degranulation, and proliferation levels in MC-38 Ero1aWT and Ero1aKO tumors. (K) Bar plot showing the inflammatory cytokines of CD8+ T cells in MC-38 Ero1aWT and Ero1aKO tumors, assessed by scRNA-seq. Data presented as means ± SDs. ∗∗∗p < 0.001. Two-sided Student’s t test.
Figure 3
Figure 3
Ablation of ERO1A promotes anti-tumor immunity via ICD (A) t-SNE map showing the tumor cell clusters based on the scRNA-seq data. Colored by cell subtype. (B) UMAP plot showing the RNA velocity of tumor cell subsets. RNA velocities were visualized on the UMAP of the T1-hypoxia, T2-high cycling, T3-low cycling, and T4-Cxcl2+ tumor cell subtypes using Gaussian smoothing on a regular grid. (C) GSEA of T1-hypoxia tumor cell subsets showing higher enrichment of ER stress response and apoptotic signaling pathway in Ero1aKO tumors, compared with those in Ero1aWT tumors. (D and E) Comparison of cell viability (D) and LDH release-based (E) cell death in MC-38 Ero1aWT and Ero1aKO tumors treated with glucose-deprived medium, 0.3 μg/mL tunicamycin, or 100 μmol CoCl2. Tumor cells were harvested after 24-h incubation under ER-stressed conditions. Data presented as means ± SDs from 10 technical replicates. ∗p < 0.05, ∗∗p < 0.01, ∗∗∗p < 0.001. Two-sided Student’s t test. (F) t-SNE plots showing expression of damage-associated molecular pattern (DAMP)-related genes as identified by the scRNA-seq analysis of therapeutic models. (G) Boxplots showing the relative expression levels of DAMP-related genes in MC-38 Ero1aWT and Ero1aKO tumors, measured by scRNA-seq. Boxplots show the interquartile range (IQR) divided by the median. ∗∗p < 0.01, ∗∗∗p < 0.001. Wilcoxon signed-rank test. (H) Diagram of tumor rechallenge experiment. The first challenge was with PBS (group 1), Ero1aWT (group 2), Ero1aKO (group 3), or MC-38 Ero1aOE (group 4) tumor cells on the left flank of C57BL/6 mice, and the rechallenge was performed after 10 days with Ero1aWT tumor cells on the right flank. (I–K) Right-flank tumor growth from rechallenged mice bearing LLC Ero1aWT (I), B16 Ero1aWT (J), or MC-38 Ero1aWT (K) tumors. Data presented as means ± SEMs. Representative of n = 8 mice in LLC and B16 models, n = 5/6 mice in MC-38 models. ∗∗∗p < 0.001. Two-sided Student’s t test. (L) Tumor-free survival for MC-38 Ero1aWT rechallenged mice. Mice were initially transplanted with PBS (n = 5 mice), Ero1aWT (n = 5 mice), Ero1aKO (n = 6 mice), or Ero1aOE MC-38 cells (n = 6 mice). Kaplan-Meier curves of tumor-free survival for mice after secondary tumor rechallenge. ∗∗∗p < 0.001. Log rank test.
Figure 4
Figure 4
ERO1A ablation in tumors leads to defects in ER stress response (A and B) Western blots of PERK, pPERK, EIF2α, pEIF2α, ATF4, and CHOP (A) and IRE1α, pIRE1α, XBP1s, and ATF6α (B) in MC-38 Ero1aWT and Ero1aKO tumor cells treated with glucose-deprived medium, 0.3 μg/mL tunicamycin, or 100 μmol CoCl2. Tumor cells were harvested after 24 h of ER-stress induction (n = 3 independent repeats). (C) Heatmap representing the expression levels of XBP1 target genes in Ero1aKO tumors compared with those in Ero1aWT tumors, based on the scRNA-seq data in MC-38 therapeutic models. (D) Bar plot showing the gene expression levels of Ire1a, Xbp1, Perk, Eif2a, Atf6, Chop, and Casp12 in T1-hypoxia tumor cell cluster as analyzed by scRNA-seq data in MC-38 therapeutic models. Data presented as means ± SDs. ∗∗∗p < 0.001. ns, not significant. Two-sided Student’s t test. (E) Comparison of cell viability in ER-stressed MC-38 Ero1aWT cells treated with vehicle or Kira6. Tumor cells were treated with 0.3 μg/mL tunicamycin plus vehicle (Veh) or 0.3 μg/mL tunicamycin plus Kira6 for 24 or 48 h. Data presented as means ± SDs from eight technical replicates. ∗∗∗p < 0.001. Two-sided Student’s t test. (F and G) EdU staining (F) and quantification (G) of MC-38 Ero1aWT tumor cells treated with tunicamycin or Kira6 (representative of n = 3 mice). Data presented as means ± SDs from 12 randomly selected fields. ∗∗∗p < 0.001. Two-sided Student’s t test. Scale bars, 100 μm. (H) Tumor volume in C57BL/6 mice bearing MC-38 Ero1aWT tumors treated with vehicle, aPD-1 plus vehicle, Kira6 plus isotype, or Kira6 plus aPD-1 blockade (n = 6 mice/group). Data presented as means ± SEMs. ∗∗∗p < 0.001. Two-sided Student’s t test.
Figure 5
Figure 5
ERO1A in tumor cells promotes transmissible ER stress in TME (A) GSEA showing higher enrichment of ER stress response and cell death in CD8+ T cells of Ero1aWT tumors than in Ero1aKO tumors, based on the scRNA-seq data in MC-38 therapeutic models. (B) Bar plot showing the relative mRNA expression levels of Ire1a, Xbp1, Perk, Eif2a, Chop, Casp12, and Atf6 in CD8+ T cells by qRT-PCR. CD8+ T cells were isolated from MC-38 Ero1aWT or Ero1aKO therapeutic models. Data presented as means ± SDs from six technical replicates. ∗∗∗p < 0.001. Two-sided Student’s t test. (C) Bar plot indicating the cytokine release of granzyme B, IFN-γ, and TNF-α from T cells when co-cultured with MC-38 Ero1aWT or Ero1aKO tumor cells under ER stress. The ER-stress condition was induced by treatment with 0.3 μg/mL tunicamycin. Data presented as means ± SDs from four technical replicates. ∗p < 0.05, ∗∗∗p < 0.001. ns, not significant. Two-sided Student’s t test. (D and E) Flow cytometry of propidium iodide (PI) and CFDA-SE-stained MC-38 cells (D). Quantification of dead (CFDA-SE+ and PI+) or alive tumor cells (CFDA-SE+ and PI) by T cell cytotoxic functional assay (E). MC-38 Ero1aWT or Ero1aKO cells with or without 0.3 μg/mL tunicamycin treatment were co-cultured with activated CD8+ T cells for 24 h. Data presented as means ± SEM from three technical replicates. ∗p < 0.05. ns, not significant. Chi-squared test. (F) Diffusion map of CD8+ T cell clusters shows an apoptotic trajectory. The pseudotime expression changes in apoptotic signatures in CD8+ T cells of MC-38 Ero1aWT and Ero1aKO tumors, based on the scRNA-seq data in MC-38 therapeutic models. (G) Cellular crosstalk within SPP1 signaling pathway in MC-38 Ero1aWT (left) or Ero1aKO (right) tumors using CellChat algorithm, measured by scRNA-seq. Colored by cell subtype.
Figure 6
Figure 6
ERO1A as a biomarker in patients treated with immunotherapy (A) Immunohistochemistry (IHC) staining of ERO1A in NSCLC tumors that received neoadjuvant immunotherapy. IHC plots represent ERO1Alow tumors (upper) and ERO1Ahigh tumors (bottom). Scale bars, 100 μm. (B–E) Comparisons of baseline demographic and disease characteristics between ERO1Alow (n = 15 patients) and ERO1Ahigh groups (n = 22 patients), including histology (B), tertiary lymphoid structures (C), clinical response (D), and pathological response (E). PR, partial response; SD, stable disease; PD, progression of disease; MPG, Miller-Payne grades; LUSC, lung squamous cell carcinoma; LUAD, lung adenocarcinoma; LUASC, lung adenosquamous carcinoma; TLSs, tertiary lymphoid structures. ∗∗∗p < 0.001. ns, not significant. One-way ANOVA. (F and G) Computed tomography (CT) scan images of NSCLC patients in ERO1Alow (F) and ERO1Ahigh groups (G). CT scan was performed before (top) and after immunotherapy (bottom), respectively. IO, immunotherapy. Tumor is denoted by dotted line. (H) PET-CT scan images of NSCLC patients in ERO1Alow and ERO1Ahigh groups before (top) and after immunotherapy (bottom). Tumor is denoted by dotted line. IO, immunotherapy; SUV, standardized uptake value. (I) Changes in tumor size after neoadjuvant immunotherapy in ERO1Alow (n = 15 patients) and ERO1Ahigh groups (n = 22 patients). Tumor size was measured by CT scan and calculated by referring to the corresponding baseline. (J) Changes in tumor burden after neoadjuvant immunotherapy between ERO1Alow (n = 15 patients) and ERO1Ahigh groups (n = 22 patients). Tumor burden is measured as tumor volume. ∗∗∗p < 0.001. ns, not significant. Paired Student’s t test. (K) Relapse-free survival (RFS) for NSCLC patients stratified by the ERO1A expression. Kaplan-Meier curves of RFS for patients in ERO1Alow (n = 15) and ERO1Ahigh groups (n = 22). ∗p < 0.05. Log rank test. (L) Multiplex IHC (mIHC) staining of CD4 (cyan), CD8 (violet), CD68 (red), ERO1A (green), IRE1a (orange), PanCK (white), and DAPI (blue) of lung tumors treated with immunotherapy (representative of n = 3 patients). The ERO1A expression stimulated different downstream tumor immune phenotypes. Scale bars, 200 μm.

References

    1. Friedrich M.J. Immunotherapy 2.0: Improving the Response to Checkpoint Inhibitors. JAMA. 2019;321:131–133. doi: 10.1001/jama.2018.18306. - DOI - PubMed
    1. Zhang J., Huang D., Saw P.E., Song E. Turning cold tumors hot: from molecular mechanisms to clinical applications. Trends Immunol. 2022;43:523–545. doi: 10.1016/j.it.2022.04.010. - DOI - PubMed
    1. Binnewies M., Roberts E.W., Kersten K., Chan V., Fearon D.F., Merad M., Coussens L.M., Gabrilovich D.I., Ostrand-Rosenberg S., Hedrick C.C., et al. Understanding the tumor immune microenvironment (TIME) for effective therapy. Nat. Med. 2018;24:541–550. doi: 10.1038/s41591-018-0014-x. - DOI - PMC - PubMed
    1. Huang A.C., Zappasodi R. A decade of checkpoint blockade immunotherapy in melanoma: understanding the molecular basis for immune sensitivity and resistance. Nat. Immunol. 2022;23:660–670. doi: 10.1038/s41590-022-01141-1. - DOI - PMC - PubMed
    1. O'Donnell J.S., Teng M.W.L., Smyth M.J. Cancer immunoediting and resistance to T cell-based immunotherapy. Nat. Rev. Clin. Oncol. 2019;16:151–167. doi: 10.1038/s41571-018-0142-8. - DOI - PubMed

Publication types

MeSH terms