. 2023 Oct 23;33(20):4430-4445.e6.
doi: 10.1016/j.cub.2023.08.088. Epub 2023 Sep 27.

A single neuron in C. elegans orchestrates multiple motor outputs through parallel modes of transmission

Affiliations

A single neuron in C. elegans orchestrates multiple motor outputs through parallel modes of transmission

Yung-Chi Huang et al. Curr Biol. .

Abstract

Animals generate a wide range of highly coordinated motor outputs, which allows them to execute purposeful behaviors. Individual neurons in the circuits that generate behaviors have a remarkable capacity for flexibility as they exhibit multiple axonal projections, transmitter systems, and modes of neural activity. How these multi-functional properties of neurons enable the generation of adaptive behaviors remains unknown. Here, we show that the HSN neuron in C. elegans evokes multiple motor programs over different timescales to enable a suite of behavioral changes during egg laying. Using HSN activity perturbations and in vivo calcium imaging, we show that HSN acutely increases egg laying and locomotion while also biasing the animals toward low-speed dwelling behavior over minutes. The acute effects of HSN on egg laying and high-speed locomotion are mediated by separate sets of HSN transmitters and different HSN axonal compartments. The long-lasting effects on dwelling are mediated in part by HSN release of serotonin, which is taken up and re-released by NSM, another serotonergic neuron class that directly evokes dwelling. Our results show how the multi-functional properties of a single neuron allow it to induce a coordinated suite of behaviors and also reveal that neurons can borrow serotonin from one another to control behavior.


Conflict of interest statement

Declaration of interests The authors declare no competing interests.

Figures
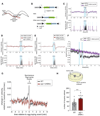
Figure 1.
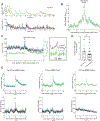
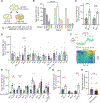
Figure 1.. The HSN neuron evokes egg-laying, acute speeding, and long-term slowing
(A) Cartoon showing HSN neuron (red) in C. elegans. Pharyngeal and vulval muscles are light gray; eggs are dark gray. (B) Intersectional promoter strategy for HSN-specific expression of CoChR. An inverted CoChR-sl2-GFP cassette is expressed under the cat-4 promoter. The egl-6 promoter drives expression of Cre recombinase, which acts on the lox sites to invert CoChR-sl2-GFP. (C) Behavioral responses to HSN::CoChR activation, shown as averages of velocity (top) or egg-laying (bottom) aligned to optogenetic stimuli. Blue boxes indicate the light illumination period. For velocity, statistics examined whether the change in velocity during lights-on was different between the two groups (see Methods). For egg-laying, statistics examined whether the egg-laying rate during lights-on was different between the two groups. Because egg-laying events are transient, the mean for the egg-laying rate over time is a jagged line. n = 37 animals (470 stimulation events) for +ATR and 12 animals (120 stimulation events) for -ATR. ****p<0.0001, Mann-Whitney U test. (D) HSN::CoChR activation in egl-1(n487gf) mutants. n = 10 animals (144 stimulation events) for egl-1. WT data is same as (C). ****p<0.0001, Mann-Whitney U test, as in (C). (E) HSN::CoChR activation in animals treated with FUDR. n = 20 animals (250 stimulation events) for FUDR-treated animals. WT data is same as (C). ****p<0.0001, Mann-Whitney U test, as in (C). (F) Effect of HSN::CoChR activation on speed in animals travelling at high baseline speeds, shown as average speed aligned to optogenetic stimuli. n = 100–112 animals. Statistics examined whether the change in speed (minute before stimulation versus minute after stimulation) was different between groups. ****p<0.0001, Mann-Whitney U test. (G) Change in animal velocity surrounding native, spontaneous egg-laying events. Lines show change in velocity relative to baseline (−5 to −3 min). n = 21 animals for wild-type (518 egg events) and 20 animals for egl-1 (169 egg events). Statistics examined whether the change in velocity preceding egg-laying was different between groups (see Methods). ****p<0.0001, Mann-Whitney U test. (H) Top: Behavioral assay for exploration. Bottom: Exploratory behavior of the indicated genotypes. Dots are individual animals. n = 20 animals for each genotype ***p<0.001, Mann-Whitney U test. Data are shown as means ± standard error of the mean (SEM). See also Figure S1.
Figure 2.
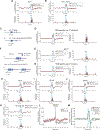
Figure 2.. HSN activity is correlated with egg-laying and locomotion
(A) Example of HSN GCaMP and speed in a freely-moving animal. (B) Average HSN GCaMP aligned to egg-laying events. n = 16 egg-laying events. **p<0.01, empirical p-value, comparing to shuffle controls in Figure S2A. (C) Left: Average speed (black) and HSN GCaMP (green) aligned to HSN calcium peaks. Right: zoomed-on plot of derivative of HSN GCaMP and speed. n = 104 peaks across 15 animals. **p<0.01, empirical p-value, comparing to shuffle controls in Figure S2B. (D) Number of HSN peaks in the minute before HSN peaks that either result in egg-laying or not. Dots are individual peaks. †p=0.0544, Wilcoxon rank-sum test. (E) Event-triggered averages displayed as in (C), splitting data based on how many HSN calcium peaks occurred before the HSN calcium peak being examined. n = 22–47 peaks per plot. **p<0.01, empirical p-value, determined as in (C). For (B)-(E), data are shown as mean ± SEM. See also Figure S2.
Figure 3.
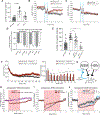
Figure 3.. HSN evokes acute speeding through its neuropeptidergic outputs
(A-B) HSN::CoChR-induced behavioral changes. Alleles: tph-1(mg280) and nlp-3(n4897). n = 7 animals (140 stimulation events) for tph-1 and 11 animals (180 stimulation events) for tph-1;nlp-3 animals. WT data is same as Figure 1C. *p<0.05, ****p<0.0001, Mann-Whitney U test, as in Figure 1C. (C) Cartoon of unc-17/VAChT conditional knockout allele. (D) HSN::CoChR activation in floxed unc-17 animals expressing pegl-6::Cre. n = 12 animals (120 stimulation events) for unc-17 HSN knockout. WT data is same as Figure 1C. *p<0.05, Mann-Whitney U test, as in Figure 1C. (E) HSN::CoChR activation in egl-21(n476) animals. n = 14 animals (205 stimulation events) for egl-21. WT data is same as Figure 1C. ****p<0.0001, Mann-Whitney U test, as in Figure 1C. (F) Cartoon of strain where a single-copy, floxed egl-21 rescue was introduced into egl-21(n476) null animals. (G) HSN::CoChR activation in HSN-specific egl-21 knockouts (egl-21(n476); floxed egl-21 genomic (kySi61); plus pegl-6::Cre). n = 15 animals (150 stimulation events) for egl-21 strain. WT data is same as Figure 1C. ****p<0.0001, Mann-Whitney U test, as in Figure 1C. (H-K) HSN::CoChR activation in neuropeptide mutants. Alleles: flp-2(gk1039), flp-28(flv11), flp-26(gk3015), and flp-2(flv15);flp-28(flv11). For mutants, n=16–26 animals (160–255 stimulation events). WT data is same as Figure 1C. *p<0.05, **p<0.01, ***p<0.001, ****p<0.0001, Mann-Whitney U test, as in Figure 1C, Bonferroni-corrected for single mutants. (L) Average changes in velocity surrounding native egg-laying events, shown as in Figure 1G. n = 17 animals for flp-2; flp-28 (432 egg laying events). WT is the same as in Figure 1G. *p<0.05, Mann-Whitney U test, determined as in Figure 1G. (M) HSN::CoChR-induced behavioral changes. HSN rescue promoter was Pcat-4prom68. These datasets are different from those in (K). WT: n = 17 animals (170 stimulation events); flp-2;flp-28: n = 22 animals (220 stimulation events); and rescue: n = 10 animals (100 stimulation events). *p<0.05, Mann-Whitney U test, as in Figure 1C. Data are shown as means ± SEM. See also Figure S3.
Figure 4.
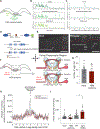
Figure 4.. HSN serotonin promotes slow locomotion and contributes to NSM-induced slowing
(A) Exploratory behavior of indicated genotypes. Alleles: tph-1(mg280) and nlp-3(n4897). Dots are individual animals. n = 19–24 animals. ****p<0.0001, Mann-Whitney U test. (B-C) HSN::CoChR-induced speed changes for indicated genotypes, shown as in Figure 1F. n = 85–182 animals. Asterisk is based on quantification in (D). (D) Quantification of data in (B-C), showing speed decrease 1 min or 2–5 min after HSN stimulation (relative to pre-stimulus baseline). *p<0.01, Mann-Whitney U test. (E) Exploratory behavior of indicated genotypes. Promoters used: tph-1 (3kb) for all serotonergic neurons; egl-6 for HSN. Dots are individual animals. n = 11 – 30 animals. ***p<0.01, ****p<0.0001, Mann-Whitney U test. (F) Average speed over time during HSN chemogenetic silencing. HSN::HisCl is Pegl-6::HisCl. Left: instantaneous speed. Right: same data, binning into 10 min intervals. n = 202–208 animals. *p<0.05, ****p<0.0001. Bonferroni-corrected t-test. (G) Cartoon illustrating serotonin release and re-uptake by NSM and HSN neurons. HSN does not appear to express mod-5 (Taylor et al., 2021; Duerr et al., 1999). (H) Change in animal speed upon NSM::Chrimson stimulation in the indicated genotypes. Animals were starved for 3 hours before the assays. n = 253–351 animals. ****p<0.0001, Mann-Whitney U test examining speed during light illumination. (I) NSM::Chrimson stimulation in wild-type and egl-1 animals. n = 85–202 animals.****p<0.0001, Mann-Whitney U test, as in (H). (J) NSM::Chrimson stimulation in indicated genotypes. n = 56–209 animals. ****p<0.0001, Mann-Whitney U test. **Asterisks between panels (I) and (J) indicate a significance difference in the effect of the egl-1 mutation in an otherwise wild-type background, compared to the effect of egl-1 in a mod-5 background, empirical p-value based on computing bootstrap differences. Data are shown as means ± SEM. See also Figure S4.
Figure 5.
Figure 5.. The distinct outputs of HSN map onto different sub-cellular compartments
(A) HSN neuron: soma, vulval presynaptic region and distal axon are labeled with shades of green that match colors in (B-C). (B) Example of simultaneous calcium imaging of three subcellular compartments of HSN in an immobilized animal. (C) Average GCaMP signal in each HSN compartment, aligned to HSN calcium peaks in the vulval presynaptic region. (D) Cartoon depicting split GFP knock-in strain that can be used for cell-specific labeling of cat-1/VMAT. (E) Representative images HSN::CAT-1 in the head (left) and mid-body (right) regions. Images were collected and are displayed using identical settings. Red asterisks indicate gut autofluorescence. Scale bar, 25 um. (F) Left: Cartoon of HSN neuron (red) in a C. elegans animal. Right: Site of the HSN axotomy: after cutting in this location, the soma is still connected to the vulval presynaptic region, but not the distal axon. (G) Egg-laying behavior of mock and HSN-axotomized animals. Dots show individual animals. n = 14–15 animals. (H) Average velocity surrounding native egg-laying events in mock and HSN-axotomized animals. Data display and statistics are similar to Figure 1G. n = 14–15 animals (126–161 egg laying events). *p<0.05, Mann-Whitney U test. (I) Baseline velocity of indicated conditions and genotypes. Dots show individual animals. n = 14–18 animals. *p<0.05, Mann-Whitney U test. Data are shown as means ± SEM. See also Figure S5.
Figure 6.
Figure 6.. Aversive sensory inputs reduce egg-laying via BAG sensory neurons and FLP-17/EGL-6 neuropeptide signaling
(A) Behavioral assay used to measure the effect of high osmolarity on egg-laying behavior. The metric at the bottom is the y-axis in subsequent plots. (B) Percent eggs laid on indicated osmolarity, compared to control (150 mOsm). Alleles: tax-2(p691) and ocr-2(ak47). n = 3 – 4 plates with 10 animals per plate. ****p<0.0001, two-factor ANOVA across conditions, with genotype and osmolarity as the two factors; both factors were significant. In addition, the indicated groups were statistically different with p=0.057, Mann-Whitney U test followed by Benjamini-Hochberg correction for multiple concentrations. (C) Percent eggs laid on high osmolarity for the indicated genotypes. Alleles: tax-2(p691) and tax-4 (p678). Dots show ratios of eggs laid on plates with high osm divided by eggs laid on plates with control osm (measured on paired plates; see Methods). n = 8–13 plates per genotype.***p<0.0001, Mann-Whitney U tests. (D) Percent eggs laid on high osmolarity for cell ablation lines. Exact genotypes used are in the key resource table. n = 4–13 plates for each genotype. Statistics were performed as in (C). **p<0.01, Mann-Whitney U tests followed by Bonferroni correction. (E) Percent eggs laid on high osmolarity for tax-4 cell-specific rescue lines. Promoters used are listed in key resource table. n = 6–20 plates per genotypes. Statistics were performed as in (C). **p<0.01, Mann-Whitney U tests followed by Bonferroni correction. (F) Top: Average BAG GCaMP activity, aligned to animals crossing from 150 mOsm agar to 300 mOsm. n=63 animals. **p<0.01, Wilcoxon signed rank test. Bottom: Individual BAG GCaMP traces over the same time frame. Recording gaps (blue) are periods when animals’ heads were out of view, but the body was in view such that animal identity could be maintained. (G) Percent eggs laid on high osmolarity for the indicated genotypes. Alleles: flp-17(n4894), flp-10(ok2624), and egl-6(n4537lf). n = 4–8 plates per genotype. Statistics were performed as in (C). *p<0.05 and **p<0.01, Mann-Whitney U tests. (H) Percent eggs laid on high osmolarity for mock and HSN-axotomized animals (same site of HSN axotomy as shown in Figure 5F). n = 16–21 animals. For all panels, statistics were comparing the indicated day-matched groups. Data are shown as means ± SEM. See also Figure S6.

Update of

References

    1. Bucher D, Taylor AL, and Marder E. (2006). Central pattern generating neurons simultaneously express fast and slow rhythmic activities in the stomatogastric ganglion. J. Neurophysiol 95, 3617– 3632. 10.1152/jn.00004.2006. - DOI - PubMed
    1. Weimann JM, and Marder E. (1994). Switching neurons are integral members of multiple oscillatory networks. Curr. Biol. CB 4, 896–902. 10.1016/s0960-9822(00)00199-8. - DOI - PubMed
    1. Atanas AA, Kim J, Wang Z, Bueno E, Becker M, Kang D, Park J, Estrem C, Kramer TS, Baskoylu S, et al. (2022). Brain-wide representations of behavior spanning multiple timescales and states in C. elegans. 2022.11.11.516186. 10.1101/2022.11.11.516186. - DOI - PMC - PubMed
    1. Fisher YE (2022). Flexible navigational computations in the Drosophila central complex. Curr. Opin. Neurobiol 73, 102514. 10.1016/j.conb.2021.12.001. - DOI - PubMed
    1. Fusi S, Miller EK, and Rigotti M. (2016). Why neurons mix: high dimensionality for higher cognition. Curr. Opin. Neurobiol 37, 66–74. 10.1016/j.conb.2016.01.010. - DOI - PubMed

Publication types

LinkOut - more resources