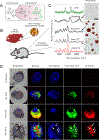
Review
. 2023 Nov:202:115107.
doi: 10.1016/j.addr.2023.115107. Epub 2023 Sep 26.

Quantitative Raman chemical imaging of intracellular drug-membrane aggregates and small molecule drug precipitates in cytoplasmic organelles

Affiliations
Review

Quantitative Raman chemical imaging of intracellular drug-membrane aggregates and small molecule drug precipitates in cytoplasmic organelles

Vernon LaLone et al. Adv Drug Deliv Rev. 2023 Nov.

Abstract

Raman confocal microscopes have been used to visualize the distribution of small molecule drugs within different subcellular compartments. This visualization allows the discovery, characterization, and detailed analysis of the molecular transport phenomena underpinning the Volume of Distribution - a key parameter governing the systemic pharmacokinetics of small molecule drugs. In the specific case of lipophilic small molecules with large Volumes of Distribution, chemical imaging studies using Raman confocal microscopes have revealed how weakly basic, poorly soluble drug molecules can accumulate inside cells by forming stable, supramolecular complexes in association with cytoplasmic membranes or by precipitating out within organelles. To study the self-assembly and function of the resulting intracellular drug inclusions, Raman chemical imaging methods have been developed to measure and map the mass, concentration, and ionization state of drug molecules at a microscopic, subcellular level. Beyond the field of drug delivery, Raman chemical imaging techniques relevant to the study of microscopic drug precipitates and drug-lipid complexes which form inside cells are also being developed by researchers with seemingly unrelated scientific interests. Highlighting advances in data acquisition, calibration methods, and computational data management and analysis tools, this review will cover a decade of technological developments that enable the conversion of spectral signals obtained from Raman confocal microscopes into new discoveries and information about previously unknown, concentrative drug transport pathways driven by soluble-to-insoluble phase transitions occurring within the cytoplasmic organelles of eukaryotic cells.

Keywords: Chemical imaging; Drug delivery; Drug targeting; Drug transport; Pharmacokinetics; Raman confocal microscopy.


Conflict of interest statement

Declaration of Competing Interest The authors declare the following financial interests/personal relationships which may be considered as potential competing interests: GRR owns stock in various companies in the pharmaceutical, biotechnology, and Raman microscopy space.

Figures
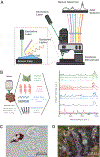
Fig. 1.
Fig. 1.. Raman confocal microscopy and its applications in drug transport research.
A) Illustration of the typical confocal microscope set up, using laser illumination to scan a sample and collect spectral data from different locations in the sample and thus generating a hyperspectral image. B) For interpreting the spectral data, a reference library of spectra is constructed. For this purpose, biomolecules were dissolved in water (or methanol for lipids) and spotted onto magnesium fluoride substrates. Once all solvent had evaporated, reference Raman spectra were acquired via 532 nm excitation. C) Macrophages from clofazimine treated animals were isolated and allowed to attach to a glass coverslip. Only one macrophage is visibly loaded with red drug crystals. Scale bar = 20 microns. D) On the flowers of the Cannabis plant, glandular trichomes are microscopic, hair-like secretory organs which cover the outer surface of the petals and seed pods. The cells that form the glandular trichomes are specialized to produce and secrete chemicals (mostly present in the spherical droplet at the tips of the hairlike, glandular structures) which cover the outer surface of the flower and fruits. Scale bar = 100 microns.
Fig. 2.
Fig. 2.
K-means clustering of PCA results datasets (PC scores) for single-cell Raman datasets acquired from (A) Niemann-Pick Type C diseased vs. wildtype fibroblasts and (B) untreated and drug-treated murine alveolar macrophages prepared on silicon chips. Reprinted from (Inkjet-printed micro-calibration standards for ultraquantitative Raman spectral cytometry. V. LaLone, M.V. Fawaz, J. Morales-Mercado, M.A. Mourão, C.S. Snyder, S.Y. Kim, et al. Analyst, 2019, 3790–3799) [24]. Identification of Raman signatures in the human induced pluripotent stem cell (hiPSC)-derived neural system from three different hiPSC lines. (C) Averaged SCRS (n = 8,774) acquired from the hiPSCs (n = 3,316), neural stem cells (NSCs) (n = 2,342), and neurons (n = 3,116) from different hiPSC lines. (D) Multivariate visualization of the single-cell Raman spectra (SCRS) via t-SNE depicts the differences between hiPSCs and their neural lineages. (The red, purple, and blue colors represent iPSCs, NSCs, and neurons, respectively.) Reprinted from (A single-cell Raman-based platform to identify developmental stages of human pluripotent stem cell-derived neurons. C.-C. Hsu, J. Xu, B. Brinkhof, H. Wang, Z. Cui, W.E. Huang, et al. PNAS, 2020, 18412–18423). Creative Commons Attribution (CC BY) license (http://creativecommons.org/licenses/by/4.0/) [98].
Fig. 3.
Fig. 3.
[28] Spectral preprocessing algorithm employing the water signal as an internal standard for all measurements. A) Cosmic rays are removed first. B) Next, the spectrum is normalized to the background signal (e.g., water peak at 3200 – 3400 cm−1). C) The non-specific background signals are then removed using a adaptable fitting algorithm (e.g., rolling circle, polynomial, etc.). D) The final result is a “pure” Raman spectrum where sources of spectral interference have been effectively removed. Reprinted (adapted) with permission from (Quantitative chemometric phenotyping of three-dimensional liver organoids by Raman spectral imaging. V. LaLone, A. Aizenshtadt, J. Goertz, F.S. Skottvoll, M.B. Mota, J. You, et al. Cell Reports Methods, 2023) [28]. E) Normalization to the water background signal in hydrated cells serves as an internal standard for quantitative measurements. F) Using this approach, emitted Raman intensity of molecular analytes of interest increase linearly with concentration in water as demonstrated here across a physiologically relevant range of albumin concentrations.
Fig. 4.
Fig. 4.. Raman imaging probes with unique signal generation to distinguish from endogenous biomolecules.
A) Typical Raman spectrum with the cell spectral-silent window where no Raman peak from endogenous biomolecules appears. B) Illustration of Raman chemical imaging probes include the use of specific, Raman-active chemical bonds, dyes, polymer dots and coded beads. C) Chemical structures of small biomolecules with deuterium isotope labels. d) Imaging incorporation of d31-palmitic acid into lipid droplets and cell membrane. Scale bar, 5 μm. e) Imaging d38-cholesterol uptake, esterification, and storage inside lipid droplets. CD, carbon–deuterium bond; CH, carbon–hydrogen bond. Scale bar, 10 μm. f) Imaging of newly synthesized proteins by d-amino acids. Scale bar, 10 μm. g) D2O labeling as a global metabolic tracer for newly synthesized proteins, lipids, and DNA in live cells. Scale bar, 10 μm. i) Imaging of newly synthesized proteins by alkyne-tagged methionine analogue homopropargylglycine (HPG). Scale bar, 10 μm. j) Imaging of choline metabolites in neuron by propargylcholine. Scale bar, 10 μm. Reprinted from (Biological imaging of chemical bonds by stimulated Raman scattering microscopy. F. Hu, L. Shi, W. Min. Nature Methods, 2019, 830–842). Copyright (2023), with permission from Springer Nature [114].
Fig. 5.
Fig. 5.. Raman chemical imaging studies showing chloroquine accumulating within the expanded lysosomes of drug treated MDCK cells.
A): microscopic images of a chloroquine treated MDCK cell, showing the green fluorescence of the lysosomal probe Lysotracker Green (top) and the corresponding bright field image (middle), together with the merged image (bottom). B) microscopic brightfield images showing the location of Raman spectral acquisition (top), and the corresponding Raman spectra acquired from those regions (bottom). Arrows point to the location of the major ‘signature’ Raman vibrations of chloroquine. 1) Raman spectrum of 100 mM chloroquine in buffer, as reference. 2) spectrum from an expanded lysosome from a drug treated cell. 3) spectrum from the cytosol of a drug treated cells. 4) spectrum from vesicles of untreated cell. 5) spectrum from cytosol of untreated cells. Reprinted from (Effect of phospholipidosis on the cellular pharmacokinetics of chloroquine. N. Zheng, X. Zhang, G. Rosania. Journal of Pharmacology and Experimental Therapeutics, 2011, 661–671). Copyright (2023), with permission from American Society for Pharmacology and Experimental Therapeutics (ASPET) [120]. C) Alveolar macrophages were procured from mice, seeded onto silicon chips, and incubated with chloroquine or vehicle control for 24 hours. Raman area scans were acquired across the area of multiple cells from drug-treated (n=20 cells) and untreated control cells (n=20). D) Subtracting the average whole cell spectrum of untreated cells (n=20) from that of drug-treated cells (n=20) yields the signature peaks of the chloroquine reference sample, thereby revealing the presence of intracellular chloroquine. Reprinted (adapted) from (An Expandable Mechanopharmaceutical Device (3): a Versatile Raman Spectral Cytometry Approach to Study the Drug Cargo Capacity of Individual Macrophages. V. LaLone, M.A. Mourão, T.J. Standiford, K. Raghavendran, K. Shedden, K.A. Stringer, et al. Pharmaceutical Research, 2019). Copyright (2023), with permission from Springer [23].
Fig. 6.
Fig. 6.. Cellular drug transport model accounting for the various pathways mediating the intralysosomal accumulation and precipitation of clofazimine (CFZ) in macrophages.
Drug molecules can enter a cell as insoluble complexes through vesicle mediated trafficking pathways (1, phagocytosis). Alternatively, they can also be transported into the cell in complex with extracellular proteins (yellow) through endocytic pathway (2). In the case of poorly soluble drug molecules (3), the non-ionized form of a lipophilic drug molecule (CFZ, green boxes) may exist in equilibrium with aggregated and bound forms. The freely soluble unionized molecules can passively diffuse through the lipid membranes of a biological cell. Depending on the pKa of the compound and the pH of the cellular compartment, the drug may become protonated (CFZH+), and ionized. Lysosomes have an acidic pH due to the proton-pumping action of the V-ATPase, and the uptake of chloride ions through a proton-chloride exchanger. The ionized form of the drug molecule becomes trapped in the lysosomes because it cannot diffuse through the membranes, causing the drug to accumulate. Depending on the molecule’s concentration and Ksp with the chloride counter-ion (Cl-), it precipitates as the HCl salt crystal.
Fig. 7.
Fig. 7.. Brightfield, fluorescence, and Raman analysis of CFZ crystal salts.
A) Brightfield (BF) and fluorescence (FITC = green fluorescence; Cy5 = red fluorescence) images of various CFZ salt crystals formed with different counterions, next to their corresponding Raman spectra. B) Corresponding Raman spectra acquired from calibration samples of CFZ mixed with phosphatidylcholine (C16:0) across the linear range (% wt/wt). C) Linear correlation of % CFZ signal (acquired from linear combination modelling with reference spectra) and % CFZ wt/wt; quantitative range was experimentally determined from 0.06% to 0.65% relative mass. Reprinted from (Synthesis and Characterization of a Biomimetic Formulation of Clofazimine Hydrochloride Microcrystals for Parenteral Administration. M. Murashov, J. Diaz-Espinosa, V. LaLone, J. Tan, R. Laza, X. Wang, K. Stringer, G. Rosania. Pharmaceutics, 2018). Creative Commons Attribution (CC BY) license (http://creativecommons.org/licenses/by/4.0/) [145].
Fig. 8.
Fig. 8.. Raman confocal microscopy of drug accumulation and distribution within alveolar macrophages of mice treated with clofazimine [27].
A) Schematic showing diffusion of non-ionized free base CFZ through lipid membranes into cell. Upon entrance into acidic compartments, CFZ is protonated, and ion-trapping occurs. The presence of high counterion (chloride) and proton concentrations promotes formation of intracellular HCl salt crystals. Reprinted (adapted) with permission from (Chemical analysis of drug biocrystals: a role for counterion transport pathways in intracellular drug disposition. R.K. Keswani, J. Baik, L. Yeomans, C. Hitzman, A.M. Johnson, A.S. Pawate, et al. Molecular Pharmaceutics, 2015, 2528–2536). Copyright (2023) American Chemical Society [83]. B) Clofazimine accumulated in alveolar macrophages of drug-treated mice. For this experiment, C57BL/6 mice were fed with a drug-supplemented diet up to 8 weeks. C) At different times during this feeding period, bronchoalveolar lavage samples were obtained from the drug treated mice and analyzed via single-cell Raman imaging. D) The Raman spectra were linearly deconvoluted, on a per-pixel basis, using pure component reference spectra; the scaling coefficients were used to color code the specific spectral signals associated with free base (green) and protonated (red) clofazimine. In this way, Raman chemical imaging revealed a gradual accumulation of the free base form during the first week of treatment, followed by its subsequent conversion into the protonated, HCl salt form of the drug, as observed 3 and 7 weeks afterwards. Reprinted (adapted) from (Reverse Engineering the Intracellular Self-Assembly of a Functional Mechanopharmaceutical Device. T. Woldemichael, R.K. Keswani, P.M. Rzeczycki, M.D. Murashov, V. Lalone, B. Gregorka, et al. Scientific Reports, 2018). Creative Commons Attribution (CC BY) license (http://creativecommons.org/licenses/by/4.0/) [27].
Figure 9.
Figure 9.. CFZ is predominantly present in the protonated form in skeletal and cardiac muscle.
Following an 8-week clofazimine treatment regimen, images of a histological cryo-section of (A) cardiac and (B) skeletal muscle were obtained from a drug treated mouse. Spectra were compared from a clofazimine-containing area (blue dot) in relation to an area free of clofazimine (purple dot). C) Representative Raman spectra obtained from different regions of the myocardium (blue line) and skeletal muscle (black line) of drug treated animals, together with reference spectra of untreated myocardium (pink line), skeletal muscle (grey line), pure clofazimine hydrochloride crystals (orange line) and pure clofazimine free base crystals (green line) Only the protonated salt form of clofazimine was detected in cardiac and skeletal muscles of the drug-treated animals. Reprinted from (Clofazimine-Mediated, Age-Related Changes in Skeletal Muscle Mitochondrial Metabolites. J. Diaz-Espinosa, K.A. Stringer, G.R. Rosania. Metabolites, 2023, 671). Creative Commons Attribution (CC BY) license (http://creativecommons.org/licenses/by/4.0/) [154].
Fig. 10.
Fig. 10.. Quantifying drug accumulation and distribution inside macrophages in high resolution Raman images.
Alveolar macrophages obtained from untreated C57BL/6 mice were cultured on silicon chips, in the presence of 8 μM nilotinib, a small molecule protein tyrosine kinase inhibitor, for 24 hours. Following incubation, cells were washed with isotonic saline followed by deionized water and air dried. Raman imaging was performed using 100X air objective lens (Zeiss Epiplan-NEOFLUOR, N.A.=0.9) continuous area scan with 532 nm excitation laser; Raman images consist of 90×90 spectra with exposure time of 0.3 seconds each, resulting in 8100 spectra acquired across the area of a single cell. Following least squares regression spectral fitting, the integrated Raman signal was related to the protein, lipid, nucleic acid/carbohydrate, and drug content of the cell (A, B). Plotting the contribution of the drug signal to the total Raman signal revealed hot spots where drug accumulated within the cytoplasm (B, C). In addition, the drug containing cells showed high accumulation of lipid (green; B, C). Scale bar = 5 μm. Spectra acquired from selected cytoplasmic regions of the cells revealed the expected signals of pure lipid, protein, and drug (D). Reprinted from (An Expandable Mechanopharmaceutical Device (3): a Versatile Raman Spectral Cytometry Approach to Study the Drug Cargo Capacity of Individual Macrophages. V. LaLone, M.A. Mourão, T.J. Standiford, K. Raghavendran, K. Shedden, K.A. Stringer, et al. Pharmaceutical Research, 2019). Copyright (2023), with permission from Springer [23].
Fig. 11.
Fig. 11.. Inkjet printing of cell-sized microdroplets as calibration standards.
The commercially available FujiFilm Dimatix MP-2831 Inkjet Materials Printer equipped with specific cartridge fluid modules and piezoelectric inkjet nozzles, generated droplets of 1 or 10 picoliters in size with tailor-made inks. Droplets were printed on 5mm × 5mm silicon wafer chips that were well-suited for Raman spectral imaging, since the low and constant background signal of the silicon chip could be readily subtracted out. The droplets were air dried directly on the chip and were visible as brightly colored spots under reflected light. Because the surface of the silicon chip oxidized to form silicon dioxide upon interaction with air, cells can be plated and grown directly on the chips, as well as on glass. A high magnification image of one of these cells clearly revealed the spread cell, with a translucent cell nucleus in the center, surrounded by cytoplasmic vesicles. White box is 50 μm × 50 μm. Full chip scale bars = 1000 μm; Zoomed brightfield and Raman image scale bars = 10 μm. Reprinted (adapted) with permission from (Inkjet-printed micro-calibration standards for ultraquantitative Raman spectral cytometry. V. LaLone, M.V. Fawaz, J. Morales-Mercado, M.A. Mourão, C.S. Snyder, S.Y. Kim, et al. Analyst, 2019, 3790–3799) [24].
Fig. 12.
Fig. 12.. Single component standard curves.
Microfluidic printer inks were formulated as aqueous solutions and/or nanoparticulate HDL suspensions in HPLC-grade water. A stock solution of 100 mg/mL albumin was formulated in diluent (0.25% polysorbate 20 in HPLC-grade water) to reduce surface tension between 28 and 33 dynes/cm and achieve viscosity between 0.010 and 0.012 Pa*s; in this way, a 10 pL drop (A) would theoretically contain up to 1000 pg of protein with negligible surfactant content (<0.5% wt/wt). Additional albumin inks were formulated by serial dilutions of albumin stock with diluent (A, B). By formulating aqueous inkjet printer inks incorporating (synthetic) HDL particles (stock solution containing 90 mg/mL HDL in water; C, D), the inkjet printer was used to print calibration dot microarrays of known phospholipid concentration (DPPC; 1,2-dipalmitoyl-sn-glycero-3-phosphocholine). The Raman signals were acquired as 50 × 50 micron area scans (B, D); All acquired Raman spectra underwent equivalent preprocessing procedures; cosmic ray removal (filter size: 4; dynamic factor: 4.6) performed on a per-pixel basis. For a single area scan, all pixel’s intensities were summed over the acquisition region to generate a single “integrated” spectrum which reflected the composition and total amount of material present within the given area scan. Background subtraction was performed by regression fitting of baseline estimation throughout multiple shifted windows across the integrated spectrum via spline approximation. The spectral region of interest (2700–3200 cm−1) was excised from the integrated spectrum and interpreted via linear regression spectral fitting with pure component reference spectra (i.e., protein, (E); and DPPC, (F), revealing a linear relationship between the amount of material deposited on each microdot, and the total, integrated Raman spectral signal acquired from each microdot. Reprinted (adapted) with permission from (Inkjet-printed micro-calibration standards for ultraquantitative Raman spectral cytometry. V. LaLone, M.V. Fawaz, J. Morales-Mercado, M.A. Mourão, C.S. Snyder, S.Y. Kim, et al. Analyst, 2019, 3790–3799) [24].
Fig. 13.
Fig. 13.. Spectral decomposition analysis of multicomponent microdots.
Inkjet printer inks containing mixtures of lipids, proteins and cholesterol were formulated by varying the concentrations of protein and HDL particles, while incorporating cholesterol in the HDLs[–160] (Liu et al., 2013; Navab et al., 2010; Schwendeman et al., 2015), to yield dots of three unique compositions: 1) 350 pg protein/peptide, 200 pg lipids, and 20 pg cholesterol (A); 2) 575 pg protein/peptide, 150 pg lipids, and 0pg cholesterol (B); 3) 550 pg protein/peptide, 100 pg lipids, and 10 pg cholesterol (C). These multicomponent inks were well-suited to print cell-size microdots, which dried as well as the pure components (Fig. 12). Integrated Raman spectra were acquired from these multicomponent microdots and preprocessed with equivalent parameters (D). Spectral decomposition was performed using pure component reference spectra relating the spectral contribution of each pure component to the integrated Raman signal acquired from each microarray dot containing the multiple components. By plotting the expected amounts of protein (E), lipid (F) and the lipid/protein ratio (G) in different microarray dots relative to the total, measured signal from each, could be fitted with a straight line (the grey shadow represents the error of the slope). Thus, the least squares regression model provided reliable measurements of multicomponent mixtures of biochemical components, like the isolated components (Fig. 12). Reprinted (adapted) with permission from (Inkjet-printed micro-calibration standards for ultraquantitative Raman spectral cytometry. V. LaLone, M.V. Fawaz, J. Morales-Mercado, M.A. Mourão, C.S. Snyder, S.Y. Kim, et al. Analyst, 2019, 3790–3799) [24].
Fig. 14.
Fig. 14.. Distinguishing different cellular phenotypes based on variations in cytoplasmic lipid, protein and nucleic acid signals.
A) Workflow for obtaining high resolution Raman spectral images of individual bronchoalveolar lavage cells acquired from mice. Raman hyperspectral images were recorded using the WiTec alpha300 R Confocal Raman Imaging Microscope (Ulm, Germany) equipped with a 100X air objective lens (Zeiss EC EPIPLAN, N.A.=0.9) and 532 nm solid-state excitation laser (0–55 mW, tunable intensity range with attenuator dial) coupled to a CCD detector via a 100μm diameter multi-mode fiberoptic cable.. B) Raman spectral images were preprocessed and the least squares regression algorithm was used to calculate a percent contribution to the total signal from lipid (green) protein (red) and nucleic acid/carbohydrate (blue); by color coding each pixel in this manner, a diversity of cellular phenotypes were observed (C): while each cell clearly exhibited a nucleus containing mostly protein and nucleic acid signals, the cytoplasm of each cell showed very different amounts of lipid, protein, and nucleic acids. Scale bar = 10 microns. From these hyperspectral Raman images, extracted average spectra (S.D. shown by shadow) from nuclei, cytoplasmic regions, and lipid-rich regions were overlaid with protein and lipid (DPPC) reference spectra (D). Statistical analysis (mean ± S.D.) confirmed the higher lipid content in cytoplasm (E). Reprinted (adapted) from (An Expandable Mechanopharmaceutical Device (3): a Versatile Raman Spectral Cytometry Approach to Study the Drug Cargo Capacity of Individual Macrophages. V. LaLone, M.A. Mourão, T.J. Standiford, K. Raghavendran, K. Shedden, K.A. Stringer, et al. Pharmaceutical Research, 2019). Copyright (2023), with permission from Springer [23].
Fig. 15.
Fig. 15.. Drug and drug metabolite deposits were detected within lysosomes yielding altered Raman spectral signals as compared to parent drug for drug-treated 3D iHLC organoids.
A-D) Chemical formula for drugs where detected deposit signals were extracted from intracellular drug and/or metabolite aggregate regions of interest (5 drug deposits from n = 3 3D induced human liver culture organoids (iHLCs) each treatment group) for (A) amiodarone, (B) nilotinib, (C) fluticasone-propionate, and (D), neratinib-treated 3D iHLC organoids. Spectral differences between unmixed deposits and parent drug reference signals suggests metabolism of compounds. Linear combination modelling reveals unique biomolecular content (i.e., protein and lipid) associated with various drug/metabolite deposits. Reprinted (adapted) with permission from (Quantitative chemometric phenotyping of three-dimensional liver organoids by Raman spectral imaging. V. LaLone, A. Aizenshtadt, J. Goertz, F.S. Skottvoll, M.B. Mota, J. You, et al. Cell Reports Methods, 2023) [28].

Similar articles

Cited by

References

    1. Flynn GL, Roberts MS, Physical and Biophysical Foundations of Pharmacy Practice: Issues in Drug Delivery, Michigan Publishing2015.
    1. Jusko WJ, Moving from basic toward systems pharmacodynamic models, J Pharm Sci, 102 (2013) 2930–2940. - PMC - PubMed
    1. Rosania GR, Thurber GM, Quantitative Analysis of Cellular Drug Transport, Disposition, and Delivery, Springer US2021.
    1. Chu X, Korzekwa K, Elsby R, Fenner K, Galetin A, Lai Y, Matsson P, Moss A, Nagar S, Rosania GR, Bai JP, Polli JW, Sugiyama Y, Brouwer KL, International Transporter C, Intracellular drug concentrations and transporters: measurement, modeling, and implications for the liver, Clin Pharmacol Ther, 94 (2013) 126–141. - PMC - PubMed
    1. Alberts B, Cell biology: the endless frontier, Mol Biol Cell, 21 (2010) 3785. - PMC - PubMed

Publication types

Substances

LinkOut - more resources