. 2023 Oct;44(10):1126-1134.
doi: 10.3174/ajnr.A8000.

Systematic Literature Review of Machine Learning Algorithms Using Pretherapy Radiologic Imaging for Glioma Molecular Subtype Prediction

Affiliations

Systematic Literature Review of Machine Learning Algorithms Using Pretherapy Radiologic Imaging for Glioma Molecular Subtype Prediction

Jan Lost et al. AJNR Am J Neuroradiol. 2023 Oct.

Abstract

Background: The molecular profile of gliomas is a prognostic indicator for survival, driving clinical decision-making for treatment. Pathology-based molecular diagnosis is challenging because of the invasiveness of the procedure, exclusion from neoadjuvant therapy options, and the heterogeneous nature of the tumor.

Purpose: We performed a systematic review of algorithms that predict molecular subtypes of gliomas from MR Imaging.

Data sources: Data sources were Ovid Embase, Ovid MEDLINE, Cochrane Central Register of Controlled Trials, Web of Science.

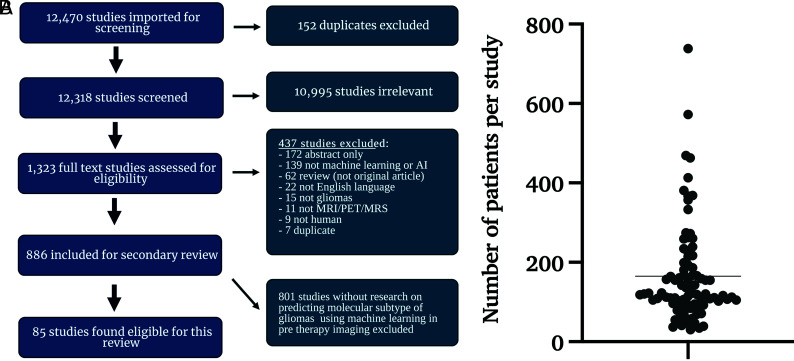
Study selection: Per the Preferred Reporting Items for Systematic Reviews and Meta-Analyses (PRISMA) guidelines, 12,318 abstracts were screened and 1323 underwent full-text review, with 85 articles meeting the inclusion criteria.

Data analysis: We compared prediction results from different machine learning approaches for predicting molecular subtypes of gliomas. Bias analysis was conducted for each study, following the Prediction model Risk Of Bias Assessment Tool (PROBAST) guidelines.

Data synthesis: Isocitrate dehydrogenase mutation status was reported with an area under the curve and accuracy of 0.88 and 85% in internal validation and 0.86 and 87% in limited external validation data sets, respectively. For the prediction of O6-methylguanine-DNA methyltransferase promoter methylation, the area under the curve and accuracy in internal validation data sets were 0.79 and 77%, and in limited external validation, 0.89 and 83%, respectively. PROBAST scoring demonstrated high bias in all articles.

Limitations: The low number of external validation and studies with incomplete data resulted in unequal data analysis. Comparing the best prediction pipelines of each study may introduce bias.

Conclusions: While the high area under the curve and accuracy for the prediction of molecular subtypes of gliomas are reported in internal and external validation data sets, limited use of external validation and the increased risk of bias in all articles may present obstacles for clinical translation of these techniques.


Figures

FIG 1.
FIG 1.
A, Inclusion/exclusion criteria and resultant study data. Flow chart represents screening workflow and exclusion criteria to visualize the eligibility of studies. The search strategy included keywords “artificial intelligence,” “machine learning,” “deep learning,” “radiomics,” “MR imaging,” “glioma,” “glioblastoma,” and related terms. An independent librarian reviewed the data. We predefined 8 uniform exclusion criteria: 1) abstract-only, 2) no application of ML reported, 3) not an original article, 4) not published in English, 5) no investigation of glioma/glioblastoma, 6) unrelated to MR imaging, MR spectroscopy, or PET imaging, 7) no human research subjects, and 8) duplicates. B, Distribution of all patients per study included in training or validation of a predictive model. We excluded patients whose data were strictly used for models other than the prediction of molecular subtypes. The line indicates the mean number of patients. AI indicates artificial intelligence.
FIG 2.
FIG 2.
Algorithm performance measurement in internal and external validation data sets. Percentages are reported as fractions to visualize measurements in 1 graph.
FIG 3.
FIG 3.
AUC and accuracy (ACC) results from internal and external validation studies. Results from 76 internal and 18 external validation studies are demonstrated on the basis of the molecular subtype that is being predicted. The central line in each result indicates the median value of the labeled subtype. Percentages are reported as fractions to provide visualization.
FIG 4.
FIG 4.
Comparison of performance of different ML algorithms in internal and external validation data sets. A, In internal validation studies, 35% (n = 27/77) used tree-based; 27% (n = 21/77), SVM; 32% (n = 25/77), neural network; and 5% (n = 4/77), other classifiers. The section named “Others” includes machine and deep learning algorithms, which cannot be classified into these 3 groups, and mixed classifiers with characteristics of multiple techniques. Lines indicate the mean value. B, Comparison of ML and DL algorithms. This figure refers to SVM and tree-based algorithms as overall ML algorithms. At the same time, all neural network–based classifiers are DL classifiers. In internal validation studies, 68% (n = 52/77) used ML algorithms, and 32% (n = 25/77) used DL classifiers. The DL algorithms demonstrated higher AUCs and statistically significant internal validation data sets. In the 95 patient cohorts analyzed, 68 studies used classic ML classifiers for their predictive models, while 26 used DL networks. The comparison of algorithms in external validation data sets was limited due to the small number of studies that validated DL algorithms. ACC indicates accuracy.
FIG 5.
FIG 5.
Performance measurements for the prediction of IDH and MGMT in internal and external data sets. A. AUC results for IDH mutation status and MGMT promoter methylation prediction. These data include all studies with IDH and/or MGMT prediction results, increasing the number of studies from 59 to 63. B, Accuracy results for IDH mutation and MGMT promoter methylation status.
FIG 6.
FIG 6.
Average PROBAST scores of all 85 included articles. Domains were scored as high ROB if ≥1 item for each domain were scored as “No” or “Probably No.” PROBAST questions are assessed so that answering with no indicates ROB for this respective item. If 1 domain was considered a high ROB, the overall ROB of the study was considered high. As a result, each study was overall rated as having a high ROB. ROB indicates risk of bias; D, development studies; V, validation studies; D1, domain 1 participants; D2, domain 2 predictors; D3, domain 3 outcome; D4, domain 4 analysis.

References

    1. Norden AD, Wen PY. Glioma therapy in adults. Neurologist 2006;12:279–92 10.1097/01.nrl.0000250928.26044.47 - DOI - PubMed
    1. Johns Hopkins Medicine. Gliomas. June 27, 2022. https://www.hopkinsmedicine.org/health/conditions-and-diseases/gliomas. Accessed June 27, 2022
    1. Louis DN, Perry A, Wesseling P, et al. . The 2021 WHO Classification of Tumors of the Central Nervous System: a summary. Neuro Oncol 2021;23:1231–51 10.1093/neuonc/noab106 - DOI - PMC - PubMed
    1. Parker NR, Khong P, Parkinson JF, et al. . Molecular heterogeneity in glioblastoma: potential clinical implications. Front Oncol 2015;5:55 10.3389/fonc.2015.00055 - DOI - PMC - PubMed
    1. Friedmann-Morvinski D. Glioblastoma heterogeneity and cancer cell plasticity. Crit Rev Oncog 2014;19:327–36 10.1615/critrevoncog.2014011777 - DOI - PubMed

Publication types

LinkOut - more resources