. 2023 Sep 28;14(1):6081.
doi: 10.1038/s41467-023-41709-5.

Biomolecular condensates modulate membrane lipid packing and hydration

Affiliations

Biomolecular condensates modulate membrane lipid packing and hydration

Agustín Mangiarotti et al. Nat Commun. .

Abstract

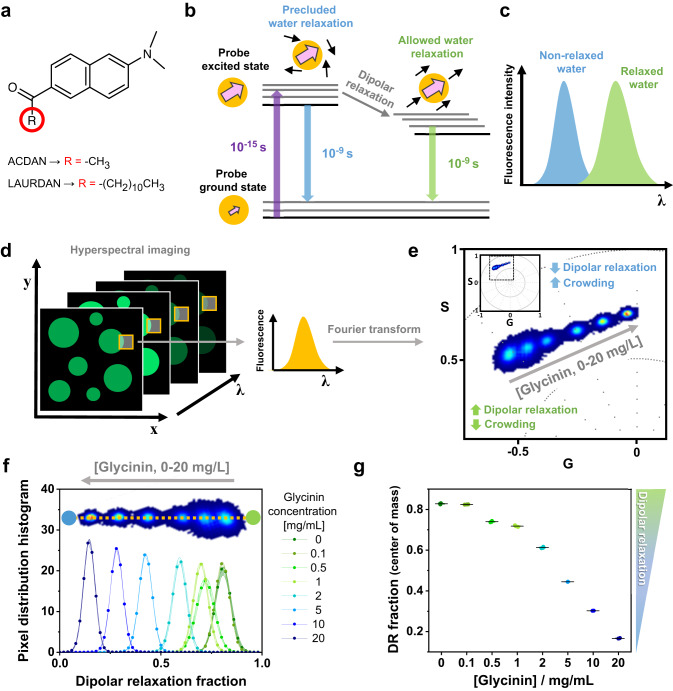
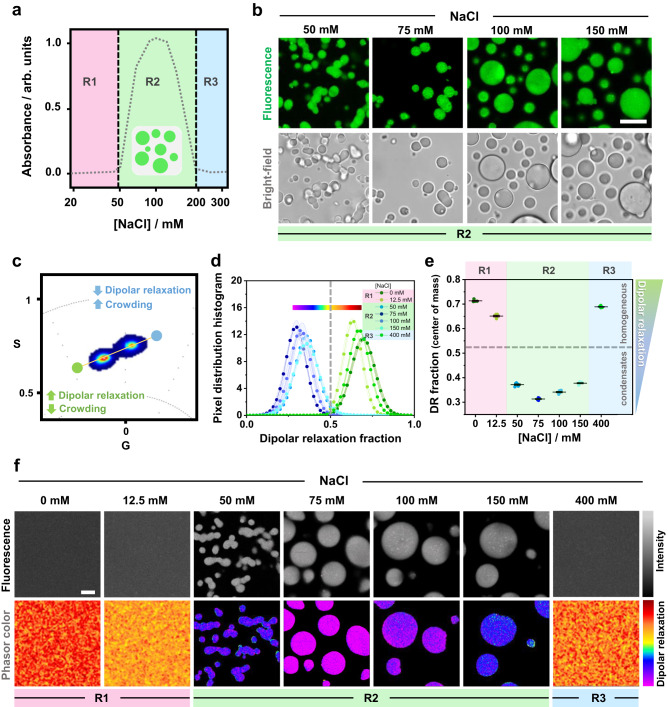
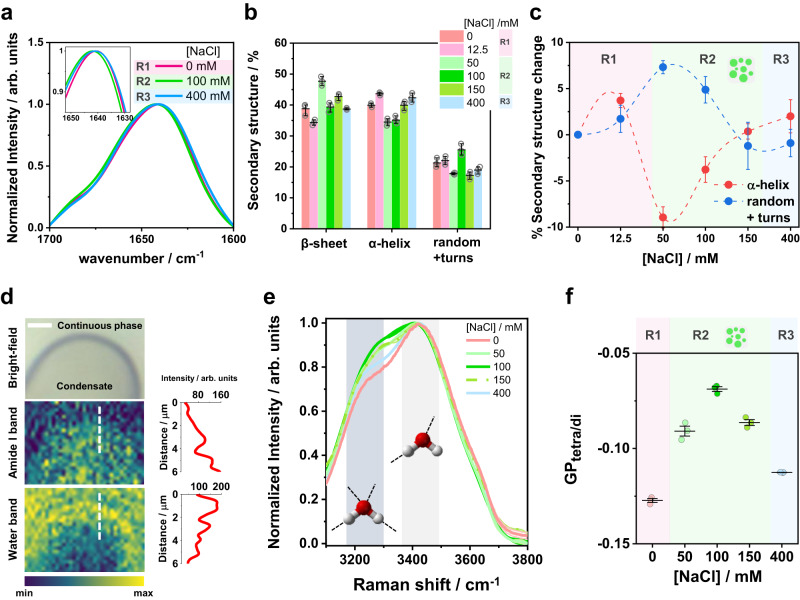
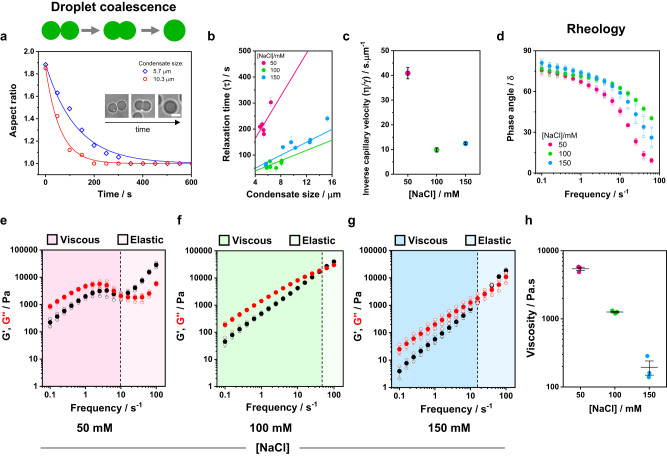
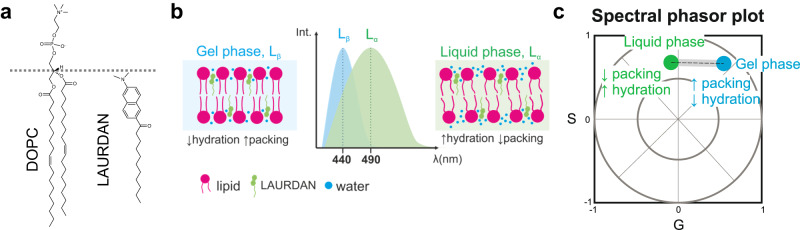
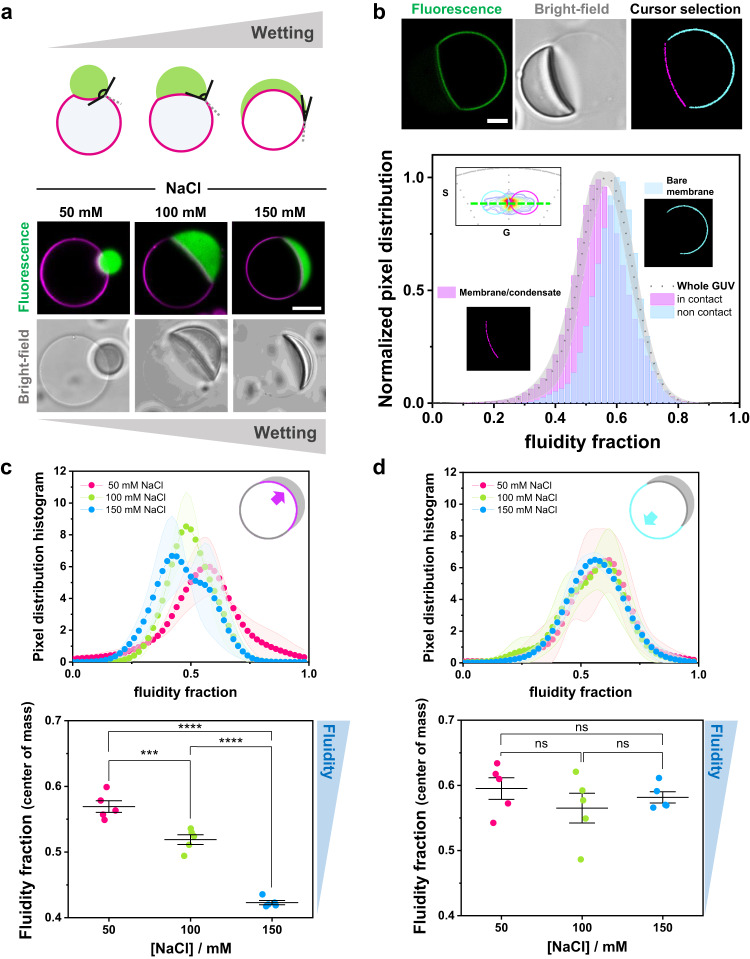
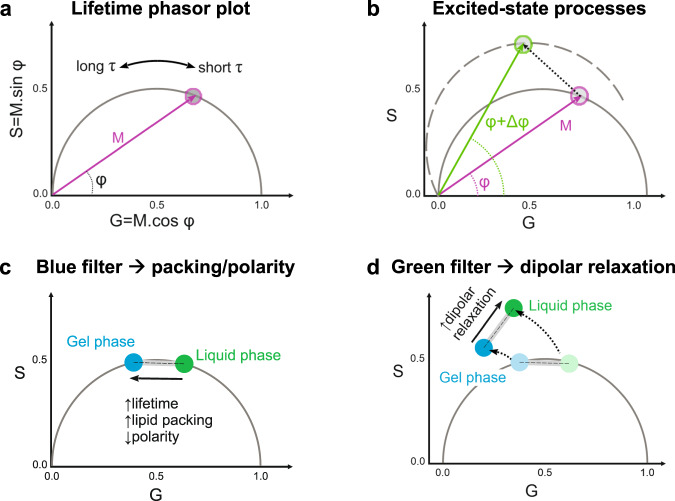
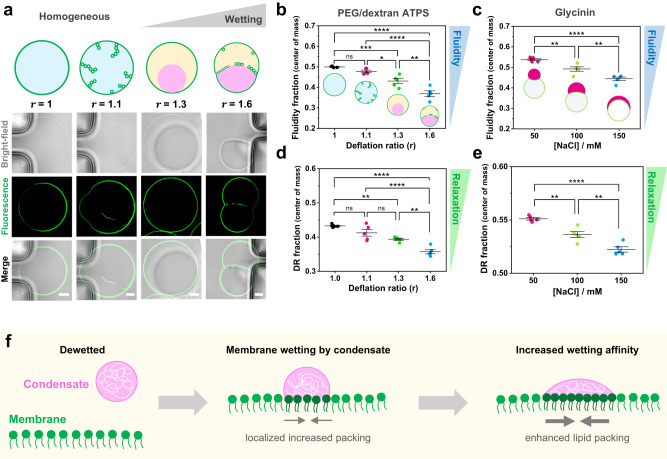
Membrane wetting by biomolecular condensates recently emerged as a key phenomenon in cell biology, playing an important role in a diverse range of processes across different organisms. However, an understanding of the molecular mechanisms behind condensate formation and interaction with lipid membranes is still missing. To study this, we exploited the properties of the dyes ACDAN and LAURDAN as nano-environmental sensors in combination with phasor analysis of hyperspectral and lifetime imaging microscopy. Using glycinin as a model condensate-forming protein and giant vesicles as model membranes, we obtained vital information on the process of condensate formation and membrane wetting. Our results reveal that glycinin condensates display differences in water dynamics when changing the salinity of the medium as a consequence of rearrangements in the secondary structure of the protein. Remarkably, analysis of membrane-condensates interaction with protein as well as polymer condensates indicated a correlation between increased wetting affinity and enhanced lipid packing. This is demonstrated by a decrease in the dipolar relaxation of water across all membrane-condensate systems, suggesting a general mechanism to tune membrane packing by condensate wetting.


Conflict of interest statement

All authors declare no competing interests.

Figures

Fig. 1
Fig. 1. DAN probes solvatochromism allows the quantification of water dipolar relaxation and crowding.
a Molecular structure of the di-methylaminonaphtalene (DAN) probes, highlighting the differences between ACDAN (6-acetyl-2-dimethylaminonaphthalene, water soluble) and LAURDAN (6-dodecanoyl-2-dimethylaminonaphthalene, partitions in membranes). b Perrin-Jablonski diagram illustrating the phenomenon of solvent dipolar relaxation. Upon excitation, there is an increase in the dipole moment of the probe (pink arrow). When the solvent dipoles (black arrows) are free to align with the probe in its excited state, the dipole energy is reduced and the fluorescence emission is red-shifted, as seen in (c). d Hyperspectral imaging consists of acquiring images at different emission wavelengths to generate a lambda-stack. Each pixel of the final image contains spectral information. e Phasor plot of the spectral emission of ACDAN in solutions containing glycinin. The data for different protein concentrations in water (0, 0.1, 0.5, 1, 2, 5, 10 and 20 mg/mL) are superimposed. Increasing the protein-water ratio results in a blue-shift of the emission, i.e. a decrease in water dipolar relaxation. The inset shows the full spectral phasor plot and the dashed square delineates the fragment that is magnified in the graph. The colors of the pixel clouds indicate the pixel density, increasing from blue to red. f Dipolar relaxation fraction histogram from two-cursor analysis for the data shown in (e). Data are represented as the mean (dots and lines) ± SD (shadowed contour), n = 3 independent experiments per condition. The inset shows the trajectory displayed by the pixel clouds taken from the phasor plot, from which the histograms were calculated. g The center of mass of the histograms for the dipolar relaxation fraction shown in (f) is represented as mean ± SD (see Eq. 12), and independent experiments are plotted. Data for panels (f) and (g) are provided as a Source Data file.
Fig. 2
Fig. 2. Characterization of glycinin phase separation using ACDAN fluorescence spectral phasor analysis.
a Glycinin exhibits phase separation at intermediate NaCl concentrations as shown from absorbance measurements (x-axis is in log scale). In regions R1 and R3 glycinin solutions are homogeneous, while in R2, phase separation occurs (adapted from Chen et al. ). b Confocal cross sections and brightfield images of glycinin condensates at different NaCl concentrations (within region R2 in (a)). Scale bar: 10 µm. c ACDAN spectral phasor plot for glycinin in water and in solutions at 12.5, 50, 75, 100, 150, and 400 mM NaCl. The data for the different conditions fall into two main pixel clouds. d Histograms obtained from two-cursor analysis showing the distribution of pixels along the yellow line depicted in (c). Starting from the blue circular cursor and moving towards the green circular cursor, crowding decreases and dipolar relaxation increases. The distance between the cursors is used as the x-axis showing the dipolar relaxation fraction. An arbitrary line was placed at x = 0.5 to separate the two groups of data corresponding to homogeneous (R1, R3 with x roughly above 0.5) and condensate (R2 with x roughly below 0.5) regions in the phase diagram. Each histogram is shown as mean ± SD, n = 5 independent experiments per condition. The continuous color map used to visualize the degree of dipolar relaxation in the images in (f) is shown above the histograms. e Center of mass of the dipolar relaxation (DR) distributions shown in (d) for glycinin in water and at the indicated NaCl concentrations. When the system is homogeneous, data falls above 0.5 (horizontal dashed line corresponding to x = 0.5 in (d)), indicating stronger dipolar relaxation. When the system is phase-separated, the data point to weaker dipolar relaxation (crowded environment). Zoomed plots of d and e can be found in Supplementary Fig. 1. Independent experiments are plotted as circles, the lines indicate mean ± SD. f Examples of ACDAN fluorescence intensity images (upper panels) and corresponding images visualized with a continuous color map defined in (d) indicating dipolar relaxation. Scale bar: 5 µm. Data for panel (e) are provided as a Source Data file.
Fig. 3
Fig. 3. Glycinin secondary structure changes with salt concentration and modifies the water environment inside condensates.
a Examples of FTIR-ATR spectra of the Amide I band of glycinin in different regions of the phase diagram in Fig. 2a: R1 (0 mM NaCl), R2 (100 mM NaCl), R3 (400 mM NaCl); see Supplementary Figs. 2 and 3 for details. The inset shows a zoomed region highlighting the spectral shifts. b Secondary structure content for glycinin at different conditions obtained by ATR-FTIR analysis. Individual data points are shown (circles) together with the mean ± SD values (black lines). n = 3 independent experiments. c Percentage change in secondary structure motifs for the different salinity conditions relative to the structure of glycinin in salt-free water. The plotted data were obtained by subtracting the average values for each condition shown in (b). The error bars were calculated as σij=σi2+σj2, where σ is the standard deviation. Major secondary structure rearrangements of the protein while changing salinity are associated with the α-helix and random+turns content. d Raman microscopy image of a section of a single condensate at 100 mM NaCl. Pixel color is mapped to the intensity of the Amide I band (middle image) or water band (bottom image) as indicated by the color bar. Intensity profiles shown next to the images were acquired along the white dashed lines in the images. Scale bar is 3 µm. e Raman spectra of the water band at different NaCl concentrations. Lines are mean values and SD is shadowed (n = 3 independent experiments). The regions in gray indicate the main bands around 3225 and 3432 cm−1 corresponding to tetra-coordinated and tri-coordinated water molecules respectively as shown by the cartoons. f Spectral changes in the Raman water band quantified with the GPtetra/di function, calculated as indicated in Eq. (13). See Supplementary Fig. 4 for further details. Independent experiments are plotted as circles and the lines represent mean ± SD. The background in panels (c) and (f) was colored to represent the different regions of the phase diagram in Fig. 2a. Data for panels (ac) and (e, f) are provided as a Source Data file.
Fig. 4
Fig. 4. Glycinin condensates material properties change with salinity.
The material properties of condensates at 50 mM (pink), 100 mM (green) and 150 mM (blue) NaCl were evaluated with different approaches. a Examples of aspect ratio vs time for coalescing condensates of different sizes. Glycinin condensates coalesce within minutes, displaying different characteristic relaxation times according to size and NaCl concentration. The data are fitted with the function y=1+(y01).exp(x/τ), where τ is the characteristic relaxation time. The inset shows an example of condensate coalescence at 100 mM NaCl. The scale bar is 5 µm. b Plot of the relaxation time vs. the final condensate diameter. Values are shown as mean ± SD, n = 19 independent experiments. Solid lines are fits to the linear equation: y=ηγx, where the slope, ηγ, is the inverse capillary velocity. c Inverse capillary velocity obtained from (b) for varying salt concentrations indicate that the material properties of the condensates are modulated by salinity conditions. The data plotted correspond to mean ± SD values of the slopes of the curves shown in (b). dh Rheology measurements of glycinin condensates at different salt concentrations display changes in the material properties. d. Phase angle vs frequency for glycinin condensates at the different conditions. In all cases condensates behave as viscoelastic liquids (see Supplementary Fig. 6). Independent experiments are plotted as open circles and the mean ± SD are shown in solid circles (n = 3). eg Plots showing the average storage and loss modulus (G, black, and G, red) vs frequency for glycinin condensates at the indicated salinities. Independent measurements are plotted as hollow circles and the mean ± SD are shown in full circles (n = 3). Shaded regions represent the the dominant viscous or elastic regime, as indicated. The crossover frequency (black dashed line) is equal to 1/τm, where τm is the terminal relaxation time. h Zero-shear viscosity for the condensate phase at different salt concentrations. Independent measurements are shown as circles, and lines represent mean values ± SD. Data for panels (ah) are provided as a Source Data file.
Fig. 5
Fig. 5. LAURDAN phasor analysis reports on membrane packing and hydration.
a Molecular structures of DOPC and LAURDAN. The dashed line indicates the approximate relative locations of the lipid and the dye from the bilayer center (~1.5 nm). b Scheme illustrating the spectral shifts for LAURDAN in membranes with different properties: highly packed and dehydrated membranes, like those in the liquid-ordered (Lo) or in the gel-phase state (Lβ) will present a blue-shifted spectrum with a maximum located near 440 nm. Membranes in a liquid phase state (Lα) will present a red shifted spectrum with a maximum centered around 490 nm,. c Sketch of a spectral phasor plot showing the trajectory for LAURDAN fluorescence in membranes. Spectra corresponding to different degrees of water penetration will fall within the linear trajectory between the two extremes for the liquid and the gel phases,,. Any deviation from this trajectory would indicate the presence of a third component, as shown in Supplementary Fig. 7b.
Fig. 6
Fig. 6. Membrane wetting by condensates increases lipid packing and membrane dehydration.
a Biomolecular condensates can wet membranes,, and the increase in wetting can be observed as an increase in the spreading of the droplet over the membrane, as well as a decrease in the contact angle as illustrated in the sketch (upper panel). Examples of membrane wetting (DOPC GUVs labeled with 0.1 mol% Atto 647N-DOPE, magenta) by glycinin condensates (FITC labeled, green) at the indicated NaCl concentrations (bottom panel). Scale bar: 10 µm. bd DOPC GUVs labeled with LAURDAN (0.5 mol%) in contact with unlabeled condensates.Using LAURDAN fluorescence spectral phasor analysis, we can segment the vesicle and separate the contributions of the membrane in contact with the condensate and the bare membrane on the same GUV. b Example analysis for a single DOPC GUV labeled with 0.5% LAURDAN (green) in contact with an unlabeled condensate (at 100 mM NaCl). The cursor-colored segments and the corresponding histograms are shown in the bottom panel. The part of the membrane in contact with the condensate is more packed (with lower fluidity fraction) than the bare membrane. Distributions were normalized for clarity. Scale bar: 10 µm. c, d Histograms of the pixel distribution (top panel), and center of mass of the distributions (bottom panel) for the membrane segment in contact with the condensate (c) and for the bare membrane segment (d), at the indicated NaCl concentrations. The sketches indicate the part of the membrane being analyzed. Data are shown as mean ± SD (n = 5 GUVs per condition). The statistical analysis was performed with One-way ANOVA and Tukey post-test analysis (p < 0.0001, **** | p < 0.001, *** | p < 0.01, ** | p < 0.05, * | ns = non-significant). Data for panels (bd) are provided as a Source Data file.
Fig. 7
Fig. 7. Lifetime phasor plots allow discriminating between polarity and dipolar relaxation changes for LAURDAN decay in membranes.
a Lifetime phasor plot. The modulation (M) indicates the distance of the phasor point from the origin (0:0), and the phase angle (φ) the decrease or increase in lifetime (τ). Together, these parameters determine the position of the phasor point in the universal semicircle. b When excited-state processes take place, M remains the same, but due to the delay in the emission (Δφ), the phasor points appear outside the universal circle as the plot rotates,,,. c, d. Using different bandpass filters, the contributions of the polarity and the dipolar relaxation can be split for LAURDAN decay. c The lifetimes measured through the blue channel (416–470 nm) give information about the change in lipid packing. The sketch illustrates how the lifetime changes between liquid and gel phases. Linear combination rules apply and the changes can be quantified in the same manner as described for spectral phasors (Fig. 1). All intermediate packing states will fall within the linear trajectory between these two extremes. d The green channel (500–600 nm) for LAURDAN fluorescence provides information on water dipolar relaxation processes, and the phasor points fall outside the universal semicircle. For membranes in the liquid phase state, dipolar relaxations are more pronounced because the water molecules have enough time to reorient around the LAURDAN moiety (see Fig. 1b), while for gel and liquid ordered phases dipolar relaxation is less pronounced.
Fig. 8
Fig. 8. Tuning membrane lipid packing and hydration is a general mechanism underlying wetting by condensate droplets. a.
DOPC vesicles labeled with 0.5 mol% LAURDAN filled with a PEG/dextran solution (ATPS) undergo morphological transformations due to the increase in membrane wetting affinity by the polymer-rich phases. Vesicle deflation with associated increases in the internal polymer concentration result from exposure to solutions of higher osmolarity. This leads to tube formation and subsequent phase separation in the vesicle (see Methods for further details). The dextran-rich phase (pink color in the sketch) is denser and has a higher refractive index than the PEG-rich phase (yellow), as can be observed in the bright-field images. The degree of vesicle osmotic deflation,r, is given by the ratio of the external to initial internal osmolarity. The lower panel shows snapshots vesicles trapped in a microfluidic device subjected to different deflation ratios. The dark regions visible in the bright-field images are the microfluidic posts. Scale bars: 5 µm. be FLIM phasor fluidity and dipolar relaxation analysis for DOPC GUVs labeled with 0.5% LAURDAN in contact with the ATPS (b, d) and the glycinin condensates (c, e), respectively. The center of mass for fluidity changes (b, c) and dipolar relaxation (DR) changes (d, e) are shown. Histograms can be found in Supplementary Fig. 11. In both condensate systems, an increase in membrane wetting leads to a decrease in fluidity. Independent experiments are shown as circles and the lines represent mean values ± SD. The statistical analysis was performed with One-way ANOVA and Tukey post-test analysis (p < 0.0001, **** | p < 0.001, *** | p < 0.01, ** | p < 0.05, * | ns = non-significant). f Sketch summarizing the findings: when the condensate (pink) interacts with the membrane (green), wetting promotes an increased lipid packing (and decreased water dipolar relaxation) in the contact region. If the wetting affinity is increased, the effect on membrane packing becomes stronger. Note that the lipids in the contact region are colored in a darker green only for contrast, but the composition of the membrane remains unaltered. Data for panels (b-e) are provided as a Source Data file.

Similar articles

Cited by

References

    1. Banani SF, Lee HO, Hyman AA, Rosen MK. Biomolecular condensates: organizers of cellular biochemistry. Nat. Rev. Mol. Cell Biol. 2017;18:285–298. - PMC - PubMed
    1. Ladouceur A-M, et al. Clusters of bacterial RNA polymerase are biomolecular condensates that assemble through liquid–liquid phase separation. Proc. Natl Acad. Sci. 2020;117:18540–18549. - PMC - PubMed
    1. Laflamme G, Mekhail K. Biomolecular condensates as arbiters of biochemical reactions inside the nucleus. Commun. Biol. 2020;3:773. - PMC - PubMed
    1. Alberti S, Hyman AA. Biomolecular condensates at the nexus of cellular stress, protein aggregation disease and ageing. Nat. Rev. Mol. Cell Biol. 2021;22:196–213. - PubMed
    1. Molliex A, et al. Phase Separation by low complexity domains promotes stress granule assembly and drives pathological fibrillization. Cell. 2015;163:123–133. - PMC - PubMed

Publication types