. 2023 Sep 28;14(1):6008.
doi: 10.1038/s41467-023-41655-2.

Defining the condensate landscape of fusion oncoproteins

Affiliations

Defining the condensate landscape of fusion oncoproteins

Swarnendu Tripathi et al. Nat Commun. .

Abstract

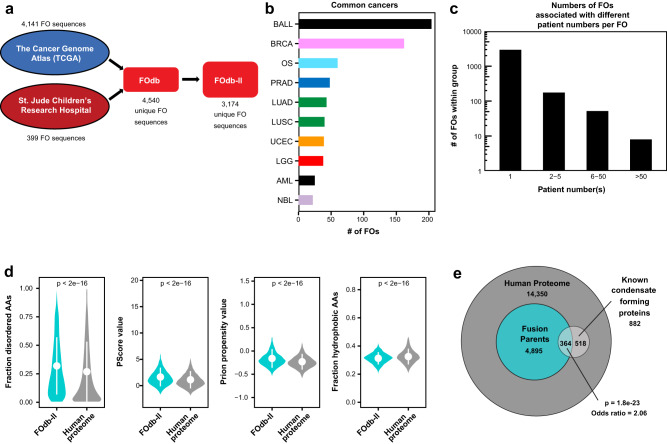
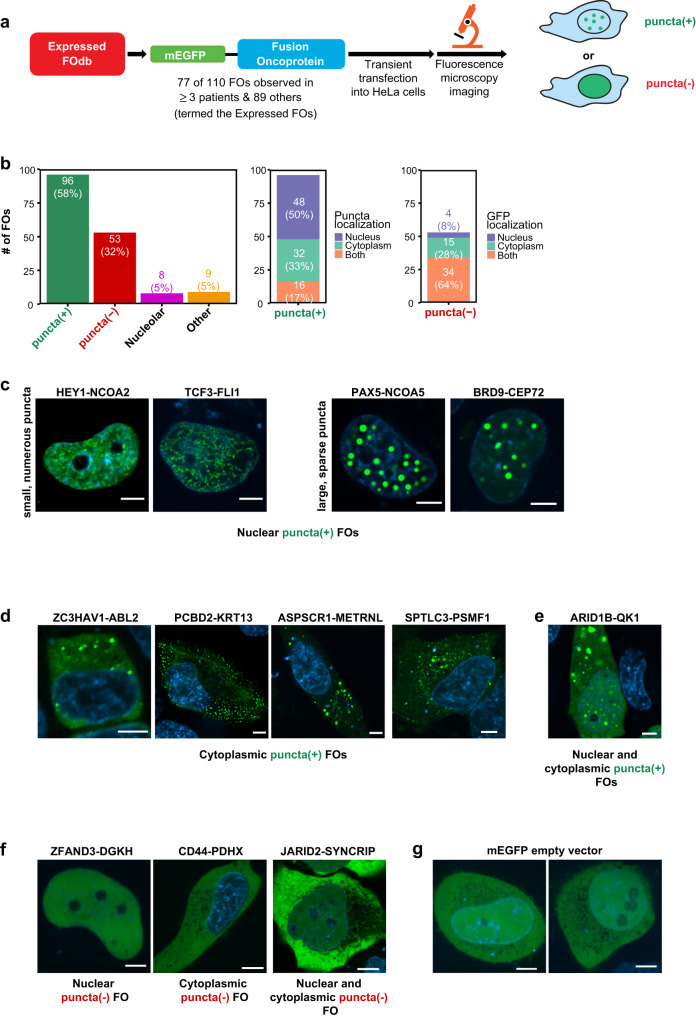
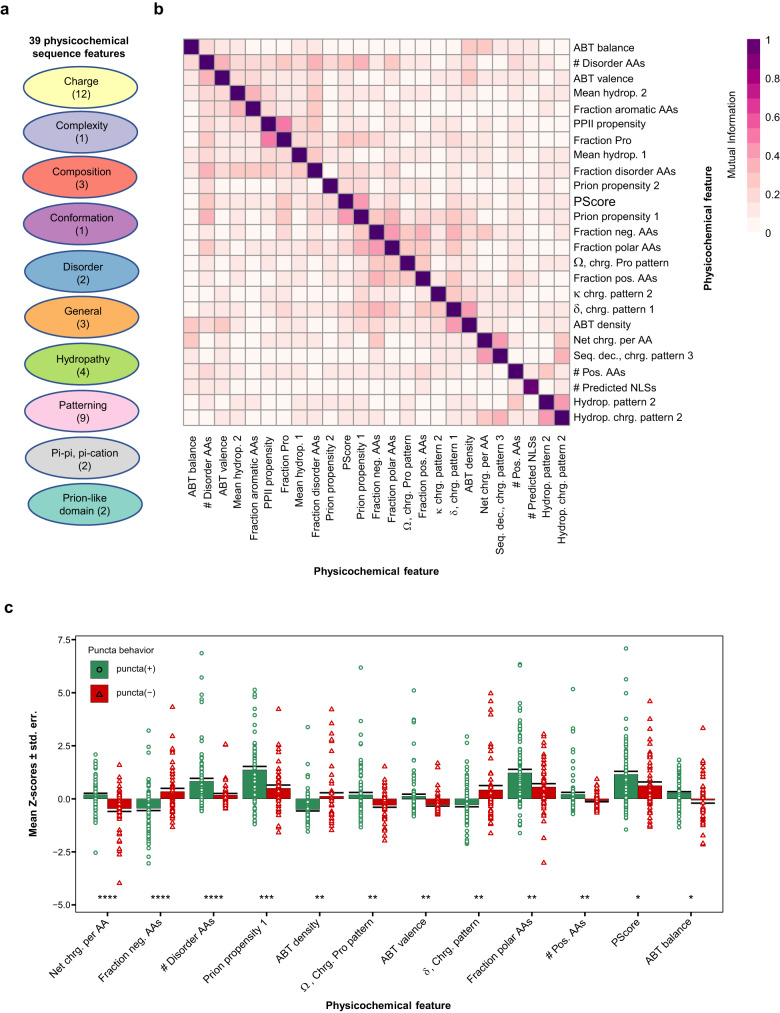
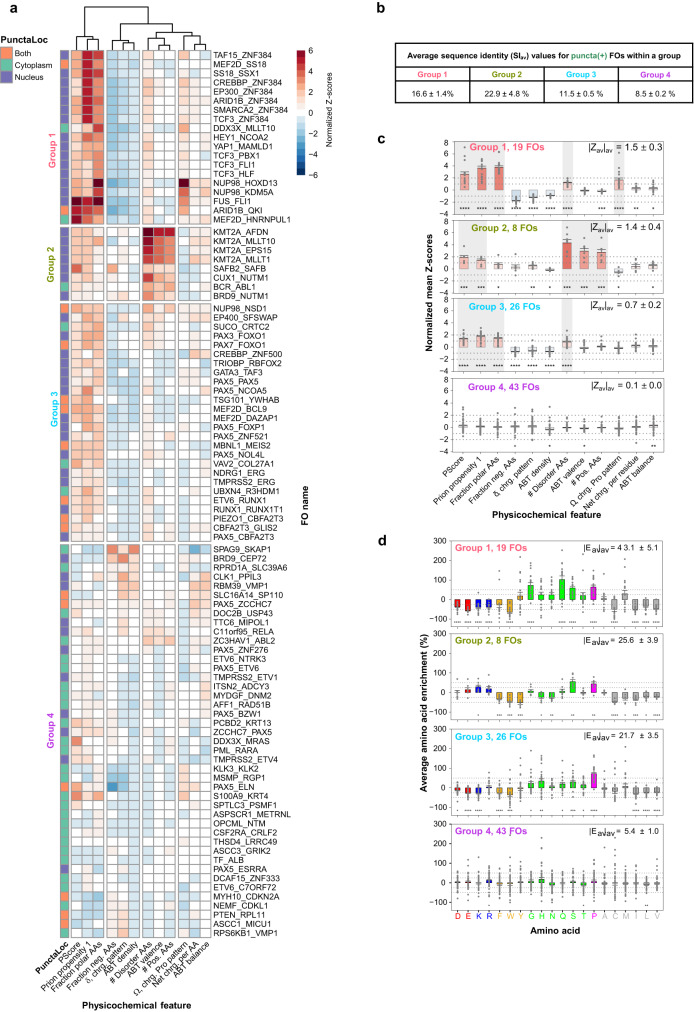
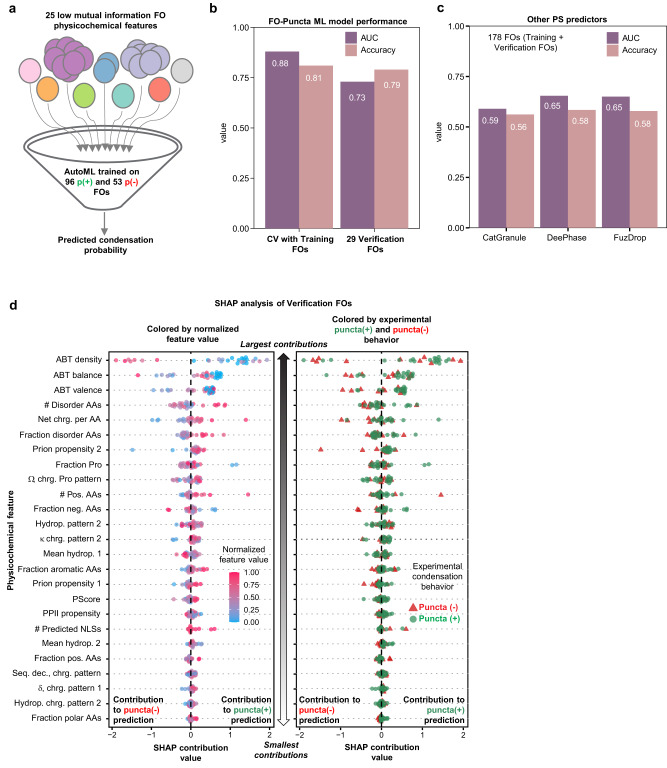
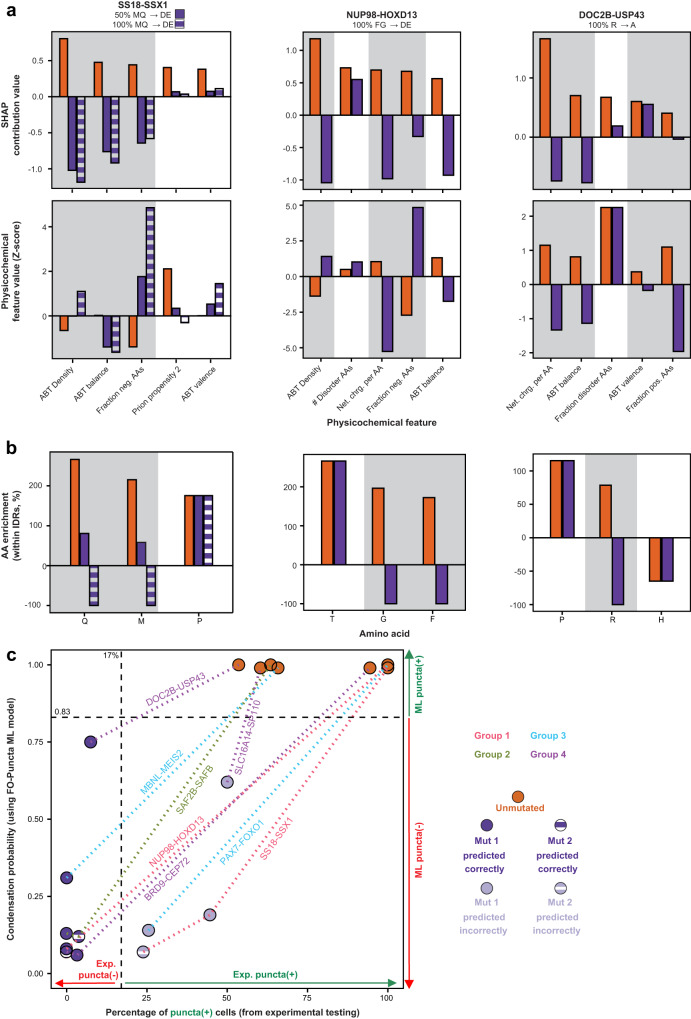
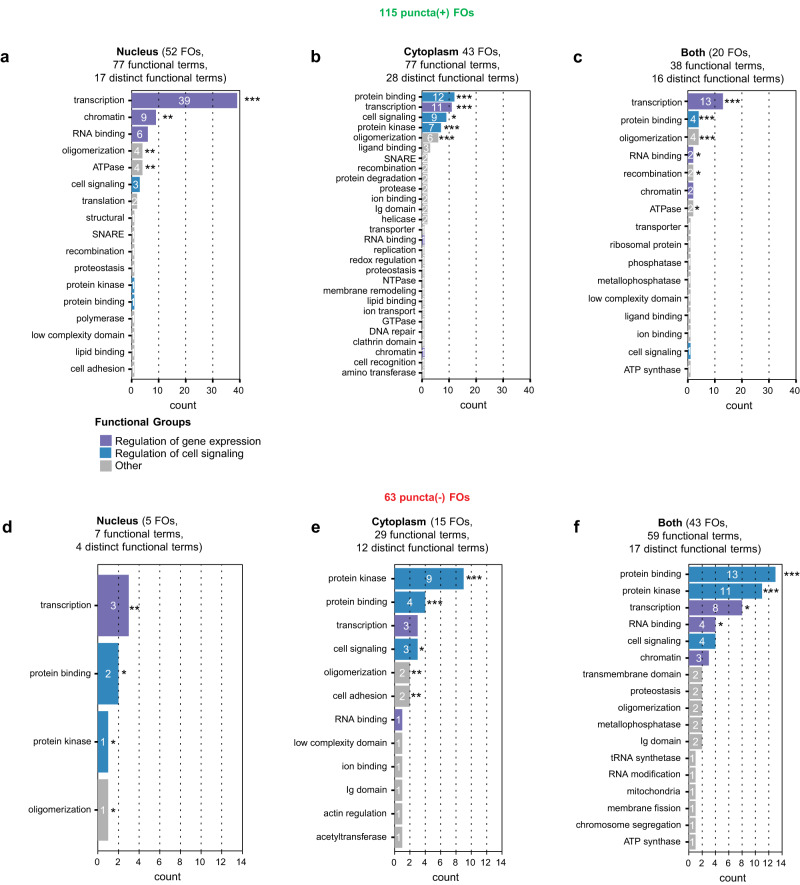
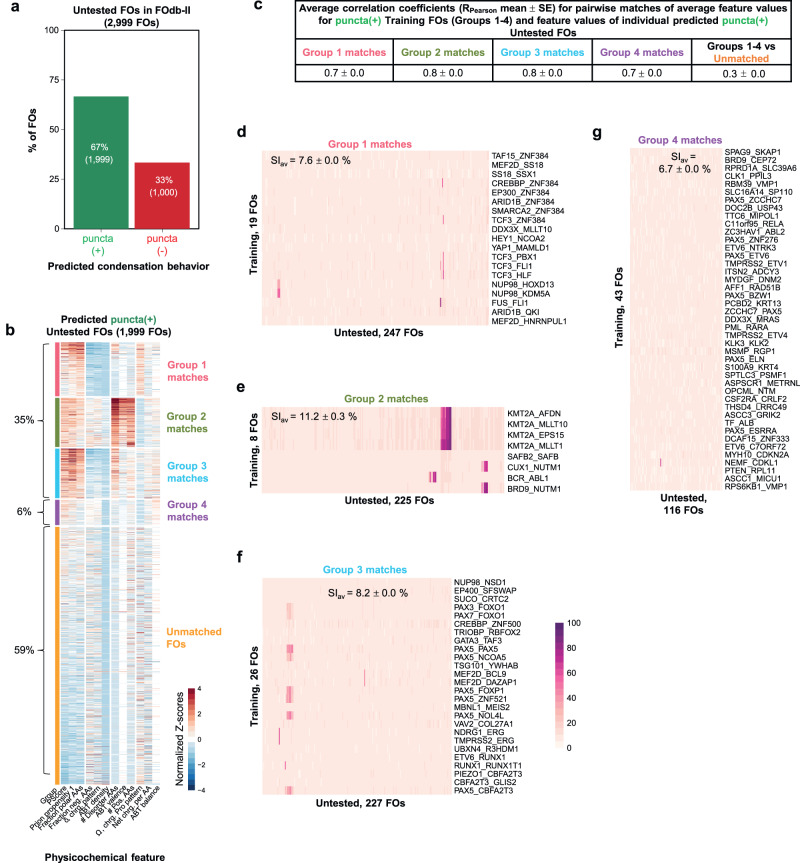
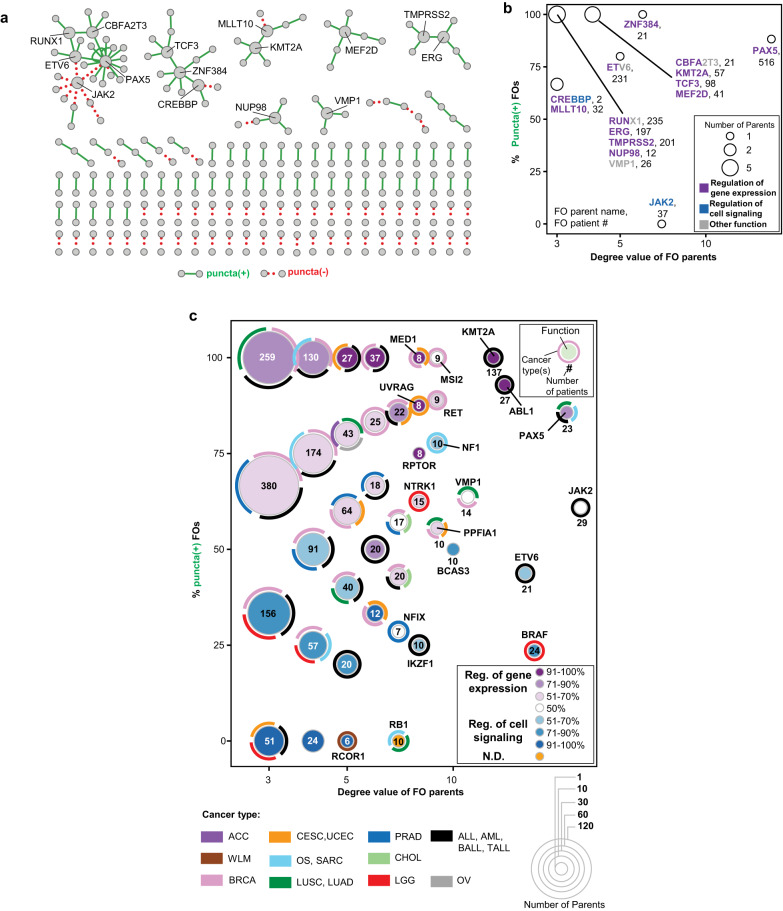
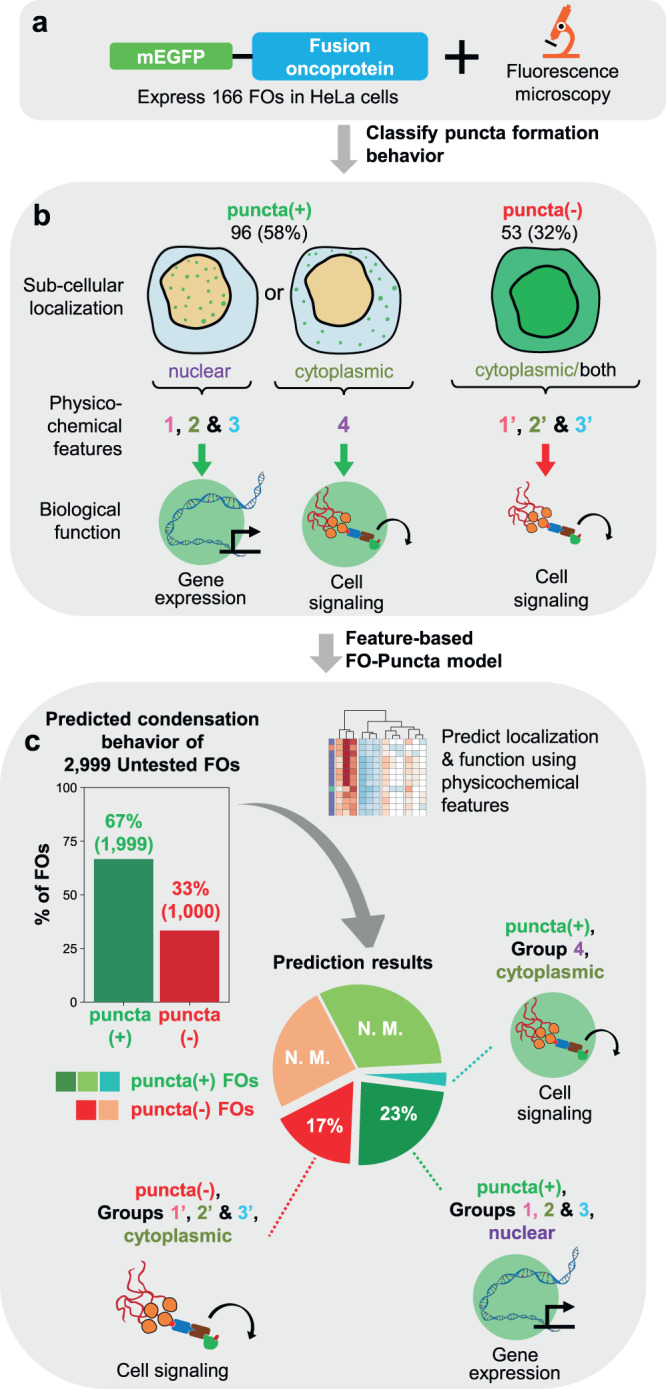
Fusion oncoproteins (FOs) arise from chromosomal translocations in ~17% of cancers and are often oncogenic drivers. Although some FOs can promote oncogenesis by undergoing liquid-liquid phase separation (LLPS) to form aberrant biomolecular condensates, the generality of this phenomenon is unknown. We explored this question by testing 166 FOs in HeLa cells and found that 58% formed condensates. The condensate-forming FOs displayed physicochemical features distinct from those of condensate-negative FOs and segregated into distinct feature-based groups that aligned with their sub-cellular localization and biological function. Using Machine Learning, we developed a predictor of FO condensation behavior, and discovered that 67% of ~3000 additional FOs likely form condensates, with 35% of those predicted to function by altering gene expression. 47% of the predicted condensate-negative FOs were associated with cell signaling functions, suggesting a functional dichotomy between condensate-positive and -negative FOs. Our Datasets and reagents are rich resources to interrogate FO condensation in the future.


Conflict of interest statement

S.D.G. is currently employed by Arrakis Therapeutics but his authorship role occurred while he was employed at St. Jude Children’s Research Hospital (SJCRH). I.I. has received honoraria from Amgen and Mission Bio. D.M.M. is currently employed by Dewpoint Therapeutics but her authorship role occurred while she was employed at SJCRH. M.R.W. is currently employed by IDEXX Laboratories, Inc. but his authorship role occurred while he was employed at SJCRH. D.F.J. reports personal fees from Transition Bio outside the submitted work. C.G.M. has received consulting and speaking fees from Illumina and Amgen, and research support from Loxo Oncology, Pfizer and Abbvie. R.W.K. reports personal fees from Dewpoint Therapeutics, GLG Consulting, and New Equilibrium Biosciences outside the submitted work. No disclosures were reported by the other authors.

Figures

Fig. 1
Fig. 1. Overview of the fusion oncoprotein (FO) database (FOdb).
a Schematic representation of sequence sources for the FOdb. Information on cancer type and number of patient occurrences was obtained for 3174 FO sequences; these are reported in FOdb-II. b Bar graph representation of the most frequently observed cancer types in which FOs were observed, based on analysis of FOs in the FOdb-II (BALL B-cell acute lymphoblastic leukemia, BRCA breast invasive carcinoma, OS Osteosarcoma, PRAD prostate adenocarcinoma, LUAD lung adenocarcinoma, LUSC lung squamous cell carcinoma, UCEC uterine corpus endometrial carcinoma, LGG low grade glioma, AML acute myeloid leukemia, NBL neuroblastoma). c Bar graph representation of the number of FOs associated with certain ranges of patient number(s) (number of patients in which the FO was observed) in FOdb-II. d Comparison of the fraction of disordered amino acids, PScore values, Prion propensity values, and fractions of hydrophobic amino acids in the sequences in FOdb-II (n = 3174) to these values for the human proteome (using the Swiss-Prot database) (n = 20,373). Average values ± standard deviations of the mean are reported; significance was assessed using the two-sided t-test and no adjustments were made for multiple comparisons. e Euler diagram showing the overlap between the 4540 FOdb fusion oncoproteins’ parent proteins and known condensate-forming proteins, as portions of the human proteome. The statistical significance of the overlap was assessed using Fisher’s exact test (two-sided), and the log-odds ratio reflects the increased probability of fusion parents to be known condensate-forming proteins. All source data are provided as a Source Data File.
Fig. 2
Fig. 2. Results of live cell imaging of mEGFP-tagged FOs from diverse human cancers.
a Schematic representation of the FO imaging workflow. A total of 166 FOs were analyzed for condensate formation in HeLa cells, termed the Expressed FOs. b Quantification of the number of FOs classified as puncta(+), puncta(-), nucleolar, or other (left). Within the puncta(+) and puncta(-) FOs, the number of FOs localized to either the nucleus, cytoplasm, or both was quantified based on puncta [for puncta(+) FOs] (middle) or diffuse GFP localization [for puncta(-) FOs] (right). Percentages are reported in parentheses. See “Methods” for details of these classifications. (C-E) Representative confocal microscopy images of live HeLa cells expressing mEGFP-tagged puncta(+) FOs localized to the nucleus (c), cytoplasm (d) or both compartments (e) based upon two biological replicates. f Representative confocal microscopy images of live HeLa cells expressing mEGFP-tagged puncta(-) FOs localized to the nucleus (left), cytoplasm (middle) or both (right) based upon two biological replicates. g Representative confocal microscopy images of live HeLa cells expressing mEGFP empty vector as a negative control based upon two biological replicates. In all images, the FO signal (green) is overlayed with the DNA signal (Hoechst dye, blue). All scale bars are 5 μm. All source data are provided as a Source Data File.
Fig. 3
Fig. 3. Physicochemical feature differences between the puncta(+) and puncta(-) Expressed FOs.
a The values of 39 physicochemical features, which fall into ten broad categories, were computed based on the amino acid sequences of 96 puncta(+) and 53 puncta(-) FOs. The numbers in parentheses indicate numbers of features in each category. See Supplementary Dataset 5 for physicochemical feature definitions. b Mutual information matrix assessing redundancy between the 39 physicochemical features. A mutual information cut-off of 0.5 or less was applied to reduce the number of features to 25. c Quantification of the enrichment or depletion of the 12 non-redundant and most significant physicochemical features (out of 25) for puncta(+) and puncta(-) FOs with respect to the human sequences within the Protein Data Bank (PDB). Values are reported as mean Z-scores ± standard error. The Z-scores values of the puncta(+) (n = 96) and puncta(-) (n = 53) FOs for each feature are shown in green circles and red triangles, respectively, along the y-axis. Significance was assessed using two-sided t-test and no adjustment were made for multiple comparisons (*p < 0.05; **p < 0.01; ***p < 0.001; ****p < 0.0001). Features include: Net charge per amino acid (Net chrg. per AA); Fraction negative amino acids (Fraction neg. AAs); Number of disordered amino acids (# Disorder AAs); prion-like domain content (Prion propensity 1); Acidic/Basic Tract density, valence and balance (ABT density, ABT valence and ABT balance); Ω, Charged residue/proline patterning (Ω Chrg. Pro pattern); δ, Charged residue patterning (δ Chrg. Pattern); Fraction polar amino acids (Fraction polar AAs); Number of positive amino acids (# Pos. AAs); and pi-pi and pi-cation interaction score (PScore). See Supplementary Dataset 5 for additional information on these and other physicochemical features used in these analyses. All source data are provided as a Source Data File.
Fig. 4
Fig. 4. Physicochemical features of the puncta(+) Expressed FOs.
a 2-dimensional (2D) hierarchical clustering of the puncta(+) FOs on the basis of the 12 most discriminatory physicochemical features. FO names are reported on the vertical axis. The values of features are reported on the horizontal axis. The first column (left) represents localization of the FO puncta (nucleus, purple; cytoplasm, green; or both, orange). FOs cluster into four groups (Groups 1–4) based on 2D hierarchical cluster analysis. The names of the physicochemical features used for clustering are given at the bottom. The significance of the different clusters/groups is given in Supplementary Fig. 2A. b Average sequence identity ± standard error for pairwise comparison of all FOs within each of the individual groups in (d). c Quantification of the mean enrichment or depletion values for the 12 physicochemical features for Groups 1–4. Values are reported as mean Z-scores ± standard error and normalized to the human sequences in the PDB. The average values of the absolute mean Z-scores ± standard error are reported in the top right of each plot. The Z-scores values of the puncta(+) FOs for each feature are shown in solid gray circles along the y-axis for Groups 1–4. Gray boxes highlight the features with significant enrichments noted in the text (one standard deviation or greater above the mean Z-scores). d Quantification of the average amino acid enrichment or depletion ± standard error for FO sequences in Groups 1–4. The amino acid enrichment values of the puncta(+) FOs for each amino acid are shown in solid gray circles along the y-axis. The mean of the absolute average enrichments ± standard error are reported in the top right of each plot. In both (c) and (d), significance was calculated using two-sided t-test with respect to the human sequences in the PDB and no adjustment were made for multiple comparisons (*p < 0.05; **p < 0.01; ***p < 0.001; ****p < 0.0001). All source data are provided as a Source Data File.
Fig. 5
Fig. 5. A Machine Learning model for predicting condensate formation probability of FOs.
a Supervised Machine Learning was used to develop a Gradient Boosting Machine model (termed FO-Puncta ML model) trained using the 25 low mutual information physicochemical features for 96 puncta(+) [abbreviated p(+)] and 53 puncta(-) [abbreviated p(-)] FOs (termed Training FOs). b Performance metrics [area under the curve (AUC, purple) and accuracy (cream)] for the FO-Puncta ML model using cross validation (CV) with the Training FOs and independent testing of 29 Verification FOs. c SHapley Additive exPlanations (SHAP) analysis for the 29 Verification FOs colored by normalized physicochemical feature value (left) or condensation behavior (right). The features are ranked by the magnitude of their relative SHAP contributions, with those with the largest contributions toward the top. Positive values of the SHAP contributions are for predictions of puncta(+) behavior and negative values for puncta(-) behavior. d Performance metrics [area under the curve (AUC, purple) and accuracy (cream)] for prediction of phase separation behavior for the combined Training and Verification FOs (reported herein) using three previously published phase separation predictors (catGranule, DeePhase, and FuzDrop). All source data are provided as a Source Data File.
Fig. 6
Fig. 6. Mutagenesis of puncta(+) expressed FOs.
a SHapley Additive exPlanations (SHAP) (top) and feature value (bottom) analysis for unmutated (orange) and mutated (purple shades) FOs. Positive SHAP contribution values indicate the magnitude of contributions to puncta(+) predictions, while negative SHAP contribution values indicate the magnitude of contributions to puncta(-) predictions. The five features with the largest SHAP contributions based on absolute values are listed for each FO and those used in mutant design are highlighted in gray. See Figure S6 and Supplementary Dataset 7 for the full complement of features and values for all eight FOs that were mutated. See Supplementary Dataset 5 for additional information on the physicochemical features used in these analyses. b The top three amino acid enrichments or depletions within the intrinsically disordered regions (IDRs) of the specified unmutated (orange) and mutated (purple shades) FOs. Those used in mutant design are highlighted in gray. See Figure S6 and Supplementary Dataset 7 for the full complement of IDR amino acid enrichments or depletions for the eight FOs that were mutated. c Plot of the FO-puncta ML model condensation probability prediction on the y-axis and experimentally determined percentage of puncta(+) cells on the x-axis. Unmutated FOs are in orange. Mutated FOs that were correctly predicted as puncta(-) are in purple. Mutant FOs that were puncta(+) are in gray. Lines connect unmutated FOs to their mutated counterparts and are color-coded based on the group (Group 1–4) from which the original FO was derived. FO names are indicated along the lines. The FO-Puncta ML model cut-off for puncta(-) classification is less than 0.83. The experimental puncta(-) cut-off is less than 17% of cells with puncta. See Fig. S7 for representative cell images of each unmutated and mutated FO. All source data are provided as a Source Data File.
Fig. 7
Fig. 7. Conserved Domain and functional analysis of puncta(+) and puncta(-) Training and Verification FOs.
Functional terms identified from the Conserved Domain Database (CDD) are shown for the 115 puncta(+) Training and Verification FOs localized to the nucleus (a), cytoplasm (b), and both compartments (c). Functional terms identified from the Conserved Domain Database (CDD) are shown for the 63 puncta(-) Training and Verification FOs localized to nucleus (d), cytoplasm (e), and both compartments (f). The colors of the bars represent the three major functional classes, regulation of gene expression (including transcription, chromatin, and RNA binding Conserved Domain functional terms; purple), regulation of cell signaling (including protein kinase, protein binding, and cell signaling Conserved Domain functional terms; blue) and other functions (gray). The numbers in each bar indicate the number of unique FOs with the noted functional term, and asterisks indicate statistically significant over-representation based on p-value estimates from 100,000-fold one-sided resampling with replacement using identically-sized protein sets (*p < 0.05; **p < 0.01; ***p < 0.001). All source data are provided as a Source Data File.
Fig. 8
Fig. 8. Physicochemical features for predicted puncta(+) FOs.
a Results of predicted condensation behavior using the FO-Puncta ML model for all FOs in FOdb-II excluding the Expressed and Verification FOs (2999 FOs, in total; termed the Untested FOs). b Results of comparing the values of 12 physicochemical features (as performed for the Training FOs) for each predicted puncta(+) FO in the Untested FO set to the average feature values of Groups 1–4 of the puncta(+) Training FOs. The Untested FOs were matched to the feature groups with which they had the greatest and most significant (p ≤ 0.05) pairwise positive correlation and data is presented as a clustered heatmap. 1184 FOs (59%) did not match any of the four feature groups and were placed in a separate group (Unmatched FOs, orange). See Supplementary Dataset 5 for additional information on the physicochemical features used in these analyses. c The average Pearson correlation coefficients for the feature group matches displayed in (A). Data is reported as RPearson mean ± standard error. dg Matrices comparing pairwise amino acid sequence identities between the matched groups (Training FOs versus Untested FOs in Groups 1–4). The average percent identity standard error is given at the top of each matrix. All source data are provided as a Source Data File.
Fig. 9
Fig. 9. The FO condensate landscape.
a Cytoscape network analysis of all FO parents (nodes) from the Training and Verification FO sets. Edges indicate a fusion event. Solid green edges reflect puncta(+) and dotted red edges puncta(-) cellular condensation behavior, respectively. b Analysis of the condensation behavior of all FO parents from (A) that are involved in ≥ 3 fusion events in our Training and Verification FO sets (degree value ≥ 3). The percent of puncta(+) FOs in which the parent is involved is plotted on the y-axis and the degree value of the parent is on the x-axis. Circles represent FO parents with the same puncta(+) percentage and degree values, and the size of the circle reflects the number of FO parents encompassed by that circle. Numbers following parent names indicate the total patient count for FOs associated with that parent. The parent names are color-coded to indicate the predominant functional associations of the FOs in which each parent is found as analyzed through the Conserved Domain Database (CDD). Purple indicates a predominant association with regulation of gene expression, blue indicates regulation of cell signaling, and gray indicates all other functions. See Supplementary Dataset 7 for all terms. c Analysis of the condensation behavior of all Untested FO parents that are involved in ≥ 3 fusions (degree value ≥ 3). The percentage of puncta(+) FOs in which a parent is involved is plotted on the y-axis and the degree value of the parent is on the x-axis. Circles represent clusters of FO parents with the same puncta(+) percentage and degree values, and the size of a circle reflects the number of FO parents encompassed by that circle. The gradient coloring of circles reflects the dominance of the functional classification of the FOs in which the parents comprising each circle are involved, with 50% indicating that the two functional classes are equally represented. Functional assignment is based on matching FOs to Groups 1–4 of puncta(+) or Group 1′−3′ of puncta(-) FOs. Orange circles indicate that FOs did not match any of the Groups 1–4. Circles containing a single parent are labeled with the parent’s name. Cancer type abbreviations are defined in Supplementary Dataset 3. All source data are provided as a Source Data File.
Fig. 10
Fig. 10. Condensate formation by fusion oncoproteins; experimental workflow and major findings.
Summary schematic of the reported findings on the FO condensate landscape. Cellular imaging (a) and 2D-hierarchical clustering (b) of puncta(+) and puncta(-) FOs resulted in the identification of FO groups with distinct physicochemical features. The groups further correlated with sub-cellular localization and function. Most nuclear FOs function in the regulation of gene expression and are found in puncta(+) Groups 1–3, while most cytoplasmic FOs function in the regulation of cell signaling and are found in puncta(+) Group 4 and puncta(-) Groups 1′−3′. c Application of the FO-Puncta ML model to 2999 Untested FOs resulted in a prediction of 67% puncta(+) and 33% puncta(-) FOs. A portion of these FOs could be matched to the established puncta(+) and puncta(-) groups (23% and 17% of 2999 FOs, respectively) based on their physicochemical feature values, providing insight into their predicted sub-cellular localization and function. Another, larger portion could not be matched to established feature groups (N. M.).

Similar articles

Cited by

References

    1. Gao QS, et al. Driver fusions and their implications in the development and treatment of human cancers. Cell Rep. 2018;23:227–238.e223. - PMC - PubMed
    1. Brien GL, Stegmaier K, Armstrong SA. Targeting chromatin complexes in fusion protein-driven malignancies. Nat. Rev. Cancer. 2019;19:255–269. - PubMed
    1. Hu X, et al. TumorFusions: an integrative resource for cancer-associated transcript fusions. Nucleic Acids Res. 2018;46:D1144–D1149. - PMC - PubMed
    1. Gu Z, et al. PAX5-driven subtypes of B-progenitor acute lymphoblastic leukemia. Nat. Genet. 2019;51:296–307. - PMC - PubMed
    1. Stransky N, Cerami E, Schalm S, Kim JL, Lengauer C. The landscape of kinase fusions in cancer. Nat. Commun. 2014;5:4846. - PMC - PubMed

Publication types

Substances