. 2023 Sep 28;14(1):6062.
doi: 10.1038/s41467-023-41691-y.

Perivascular niche cells sense thrombocytopenia and activate hematopoietic stem cells in an IL-1 dependent manner

Affiliations

Perivascular niche cells sense thrombocytopenia and activate hematopoietic stem cells in an IL-1 dependent manner

Tiago C Luis et al. Nat Commun. .

Abstract

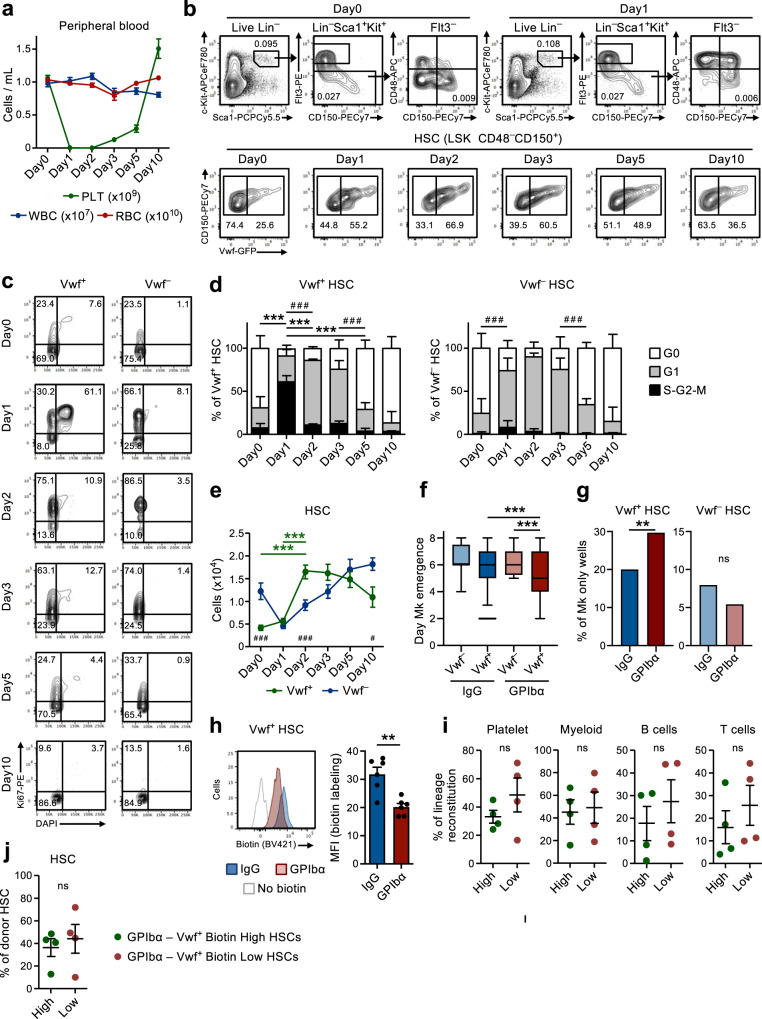
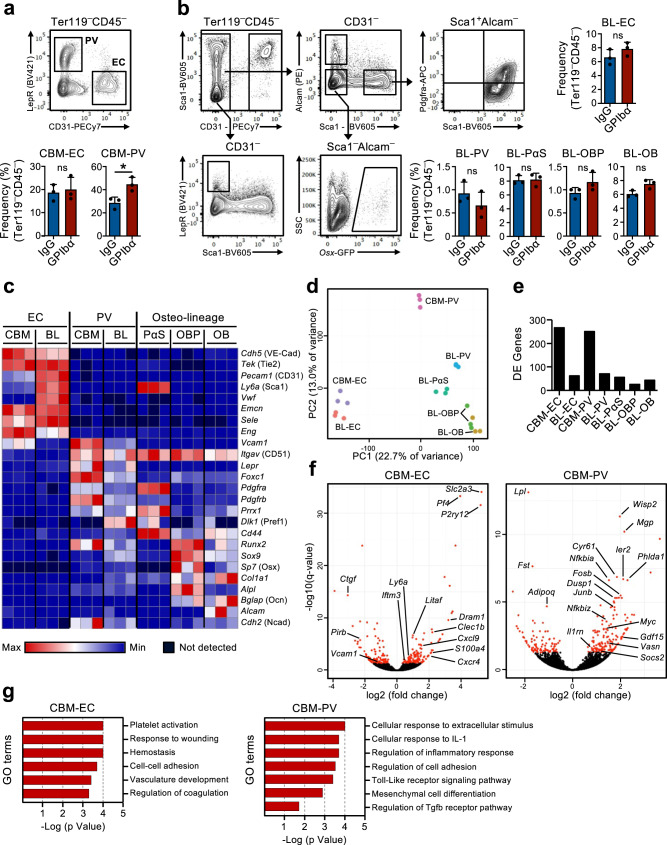
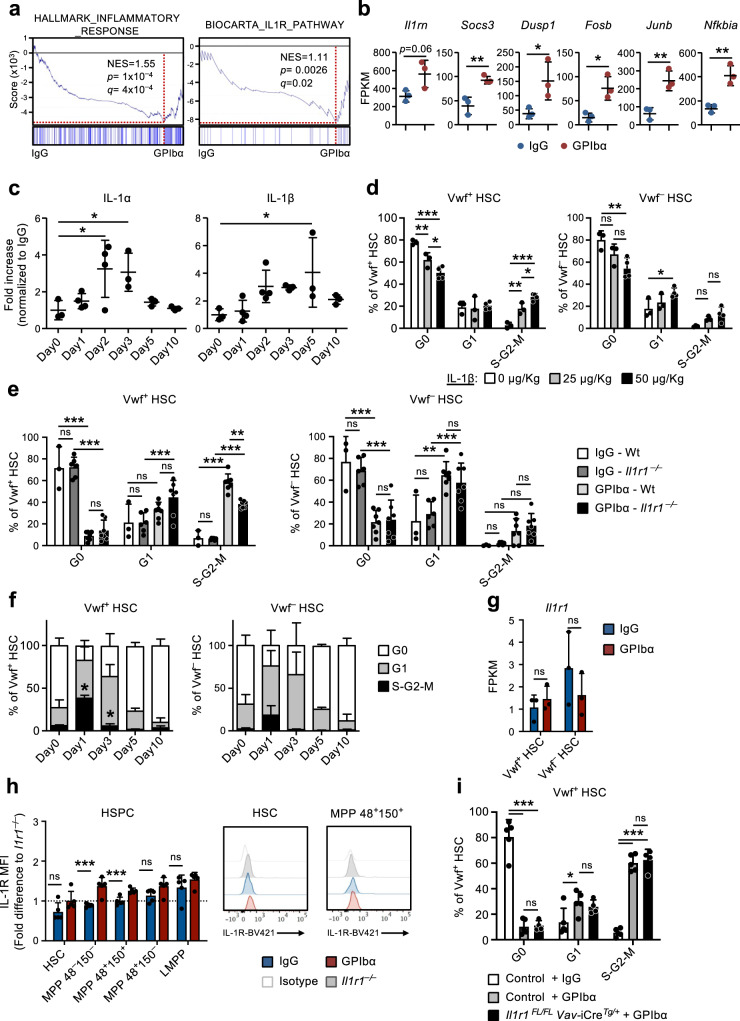
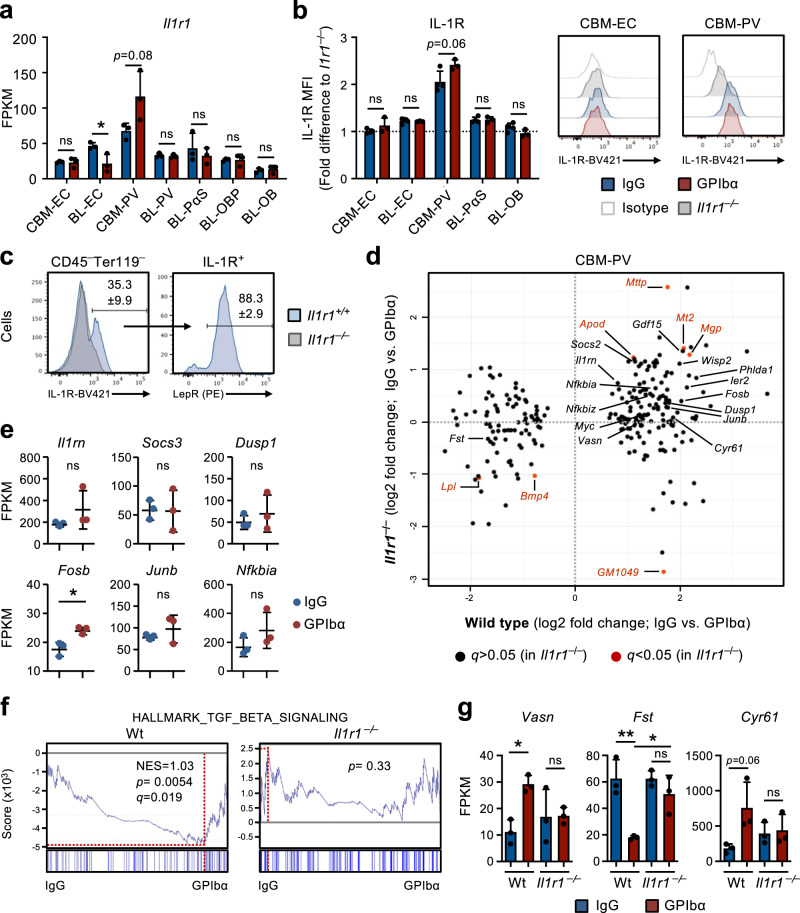
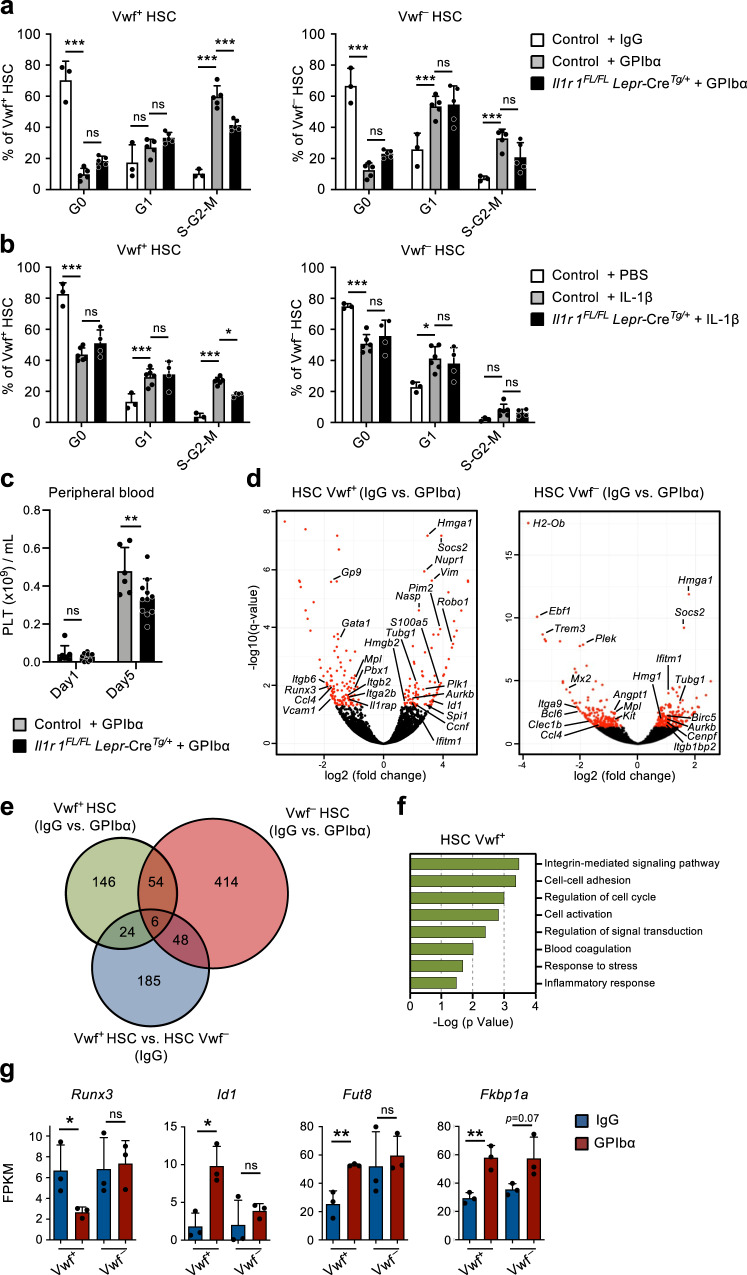
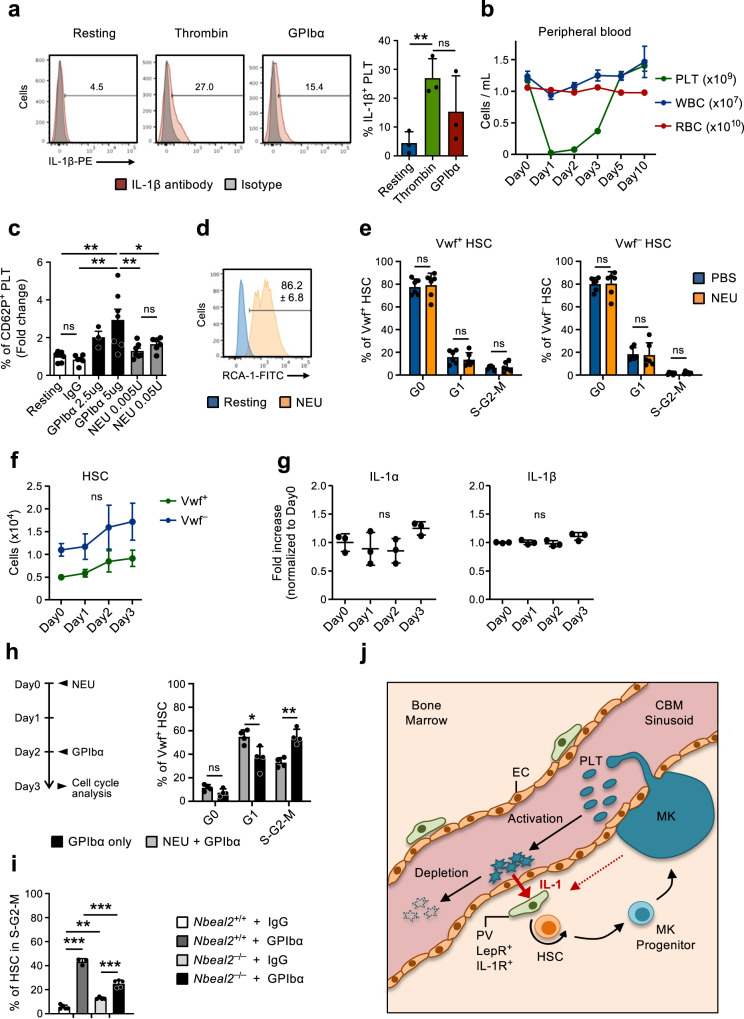
Hematopoietic stem cells (HSCs) residing in specialized niches in the bone marrow are responsible for the balanced output of multiple short-lived blood cell lineages in steady-state and in response to different challenges. However, feedback mechanisms by which HSCs, through their niches, sense acute losses of specific blood cell lineages remain to be established. While all HSCs replenish platelets, previous studies have shown that a large fraction of HSCs are molecularly primed for the megakaryocyte-platelet lineage and are rapidly recruited into proliferation upon platelet depletion. Platelets normally turnover in an activation-dependent manner, herein mimicked by antibodies inducing platelet activation and depletion. Antibody-mediated platelet activation upregulates expression of Interleukin-1 (IL-1) in platelets, and in bone marrow extracellular fluid in vivo. Genetic experiments demonstrate that rather than IL-1 directly activating HSCs, activation of bone marrow Lepr+ perivascular niche cells expressing IL-1 receptor is critical for the optimal activation of quiescent HSCs upon platelet activation and depletion. These findings identify a feedback mechanism by which activation-induced depletion of a mature blood cell lineage leads to a niche-dependent activation of HSCs to reinstate its homeostasis.


Conflict of interest statement

H.N. is the President and CEO, and G.Z. is an employee of CCOA Therapeutics Inc. Both authors are inventors of the monoclonal antibody NIT E (Canada patent number: 2, 689, 726; US patent number: US8, 323, 652 B2; and European patent number: 2186829). All other authors declare no competing interests.

Figures

Fig. 1
Fig. 1. Rapid activation of Vwf+ HSCs in response to acute platelet depletion precedes restoration of platelet homeostasis.
(Related to Supplementary Figs. 1 and 2). a Kinetics analysis of peripheral blood cell parameters post administration of anti-GPIbα antibody. Day 0 mice were treated with IgG isotype control antibody. Data represent mean ± SEM of 10 (Day0), 13 (Day1), 10 (Day2), 9 (Day3), 8 (Day5) and 7 (Day10) mice from 14 independent experiments. PLT platelets, WBC white blood cells, RBC red blood cells. b Representative FACS profiles and gating strategy of Vwf-GFP+ (Vwf+) and Vwf-GFP (Vwf) LSKFlt3CD150+CD48 HSCs at the indicated time points after platelet depletion. Numbers in gates/quadrants indicate the frequency (average of all mice analyzed) of the gated cell population among total live cells (upper panels) or among HSCs (lower panels). c, d Cell cycle analysis of Vwf+ and Vwf LSKFlt3CD150+CD48 HSCs at the indicated time points post platelet depletion. c Representative cell cycle FACS profiles of Vwf+ (left) and Vwf (right) HSCs in G0 (DAPIKi67) G1 (DAPIKi67+) or S-G2-M (DAPI+Ki67+) phases of cell cycle. Numbers in gates represent frequencies (average of all mice analyzed) of total HSCs. d Mean ± SD cell cycle phase distribution of Vwf+ (left) and Vwf (right) HSCs. Data from 5 (Day0), 5 (Day1), 3 (Day2), 5 (Day3), 5 (Day5) and 4 (Day10) mice from 6 independent experiments. ***p < 0.001; **p < 0.01 for the S-G2-M cell cycle fraction; # # #p < 0.001 for the G1 cell cycle fraction (both using 2-way ANOVA with Tukey’s multiple comparisons); e Absolute numbers of Vwf+ and Vwf HSCs (per 2 legs, see methods). Mean ± SEM data of 8 (Day0), 8 (Day1), 7 (Day2), 5 (Day3), 6 (Day5) and 5 (Day10) mice from 9 independent experiments. ***p < 0.001 for Vwf+ HSC (2-way ANOVA with Tukey’s multiple comparisons); #p < 0.05 and ###p < 0.001 for the comparison of Vwf+ vs. Vwf HSCs (2-way ANOVA with Sidak’s multiple comparisons). Time of appearance of the first Mk (f) and frequency of colonies with only Mk cells (g) in cultured single Vwfor Vwf+ HSCs isolated from mice 16 hrs post IgG or GPIbα treatment. Data from 138, 364, 147 and 451 single cell-derived colonies analyzed, respectively, from 5 biological replicates in 4 independent experiments. f Middle line represents median, box limits represent the 25–75 percentiles, whiskers mark the 5–95 percentiles. Cells outside the 5–95 percentiles are marked as outliers. P values calculated with Kruskal–Wallis test with Dunn’s multiple comparisons. g P value calculated with two-sided Fisher’s exact test. ***p < 0.001; **p < 0.01; *p < 0.05; ns, non-significant (p > 0.05). h Biotin proliferation analysis of Vwf-GFP+ HSCs 2 days post IgG or GPIbα treatment. Representative plot (left) and mean ± SD MFI (normalized for MFI of No biotin labeling control; right) from 6 mice per group in 3 independent experiments. **p < 0.01; calculated with two-sided t-test. Long-term reconstitution (16 weeks) of platelet, myeloid and lymphoid cell lineages in blood (i) and of the BM HSC compartment (j) by biotin high and biotin low Vwf-GFP+ HSC fractions 2 days post platelet depletion. 50 cells transplanted per mouse. Data represent mean ± SEM of 4 donors in 2 independent experiments. Each dot represents the mean of 2 recipient mice transplanted per donor. ns, non-significant (p > 0.05); calculated with two-sided t-tests. See also Supplementary Figs. 1 and 2.
Fig. 2
Fig. 2. Up-regulation of a pro-inflammatory gene signature in bone marrow niche cells after acute platelet depletion.
(Related to Supplementary Fig. 3). FACS analysis and gating strategies for sorting of endothelial and stromal cells in the central bone marrow (CBM; a) and bone lining (BL; b) cell compartments of mice 1 day post platelet depletion (GPIbα antibody treatment). Control mice received isotype (IgG) control antibody. Bar diagrams represent mean ± SD frequencies (%) of each cell population among total non-hematopoietic CD45Ter119 cells. Data are from 3 mice per group in 3 (a) and 2 (b) independent experiments. *p < 0.05; ns non-significant (p > 0.05); assessed by two-sided t-test. cg RNA-sequencing analysis of the endothelial/stromal cell compartments of mice 1 day post platelet depletion. c Expression (FPKM) of genes characterizing the different niche cell populations. d Principal component analysis of normalized gene expression of the different cell populations investigated. e Number of differentially expressed (DE) genes between IgG and GPIbα treated mice (adjusted p value (q)<0.05), in each niche cell population investigated. f Volcano plots and g gene ontology (GO) terms analysis of genes differentially expressed in CBM endothelial cells (EC) and Lepr+ perivascular (PV) cells. In f, red dots indicate significantly DE genes (q < 0.05. For all panels data represent mean ± SD FPKM of 3 biological replicates from 2 independent experiments. OB osteoblasts, OBP osteoblast progenitors, PαS Pdfgrα+Sca1+ mesenchymal progenitors. See also Supplementary Fig. 3.
Fig. 3
Fig. 3. Hematopoietic-extrinsic IL-1 signaling is critical for activation of platelet-biased HSCs in response to acute platelet depletion.
(Related to Supplementary Fig. 5). a Gene set enrichment analysis (GSEA) of global gene expression data from CBM-PV cells for the indicated gene sets. NES, normalized enrichment score (or scaled score). b Expression of IL-1 signaling pathway affiliated genes in CBM-PV cells 1 day post-platelet depletion. Data represent mean ± SD FPKM of 3 biological replicates from 2 independent experiments. **p < 0.01; *p < 0.05 (two-sided t-test). c Mean ± SD levels of IL-1α and IL-1β in bone marrow extracellular fluid isolated from mice at the indicated time points post platelet depletion (GPIbα antibody treatment). Control mice (Day 0) received isotype (IgG) control antibody. Data are from 3 (Day0), 4 (Day1), 4 (Day2), 3 (Day3), 3 (Day5) and 3 (Day10) mice from 4 independent experiments. *p < 0.05 (1-way ANOVA with Dunnett’s multiple comparisons). d Cell cycle analysis of Vwf+ (left) and Vwf (right) HSCs from mice 1 day post intravenous administration of the indicated amounts of IL-1β. Data are mean ± SD of 3 mice receiving 0 or 25 μg/Kg, and 4 mice receiving 50 μg/Kg IL-1β, in 2 independent experiments. Cell cycle analysis of Vwf+ (left) and Vwf (right) HSCs from Wt and Il1r1–/– mice 1 day (e) or for HSCs from Il1r1–/– mice at the indicated time points (f) post platelet depletion. e Mean ± SD data from 3 (IgG-Wt), 6 (IgG-Il1r1–/–) 7 (GPIbα -Wt) and 7 (GPIbα -Il1r1–/–) mice from 5 independent experiments. f Mean ± SD frequencies from 6 (Day0), 7 (Day1), 3 (Day3), 3 (Day5) and 3 (Day10) mice in 4 independent experiments. *p < 0.05 (in comparison to same analysis of Wt Vwf+ and Vwf HSCs in Fig. 1d). g, h Il1r1/IL-1R expression analysis (h) at RNA level by RNA-sequencing (FPKM) in Vwf+ and Vwf HSCs and (i) at protein level by flow cytometry in HSPCs subsets, isolated from mice in homeostasis or 1 day post platelet depletion. h Mean ± SD FPKM data of 3 biological replicates per condition. i Mean ± SD data of Mean fluorescence intensity (MFI) normalized to the MFI of the equivalent cell population in Il1r1–/– mice analyzed within the same experiment. Data are from 5 mice per condition, in 2 independent experiments. i Cell cycle analysis of Vwf-tdTomato+ HSCs from mice with conditional deletion of Il1r1 in all hematopoietic cells (Il1r1FL/FL Vav-CreTg/+) 1 day post platelet depletion. Controls include Vwf-tdTomato+ HSCs from Il1r1FL/+ Vav-CreTg/+, Il1r1+/+ Vav-CreTg/+ and Vav-Cre+/+ mice (representing genotypes without an IL-1R loss of function). Data represent mean ± SD frequencies of 5 (control-IgG), 5 (control-GPIbα) and 4 (Il1r1FL/FL Vav-CreTg/+-GPIbα) mice from 3 independent experiments. ***p < 0.001; **p < 0.01; *p < 0.05; ns non-significant (p > 0.05); using two-sided t-test (b, g, h) or 2-way ANOVA with Tukey’s multiple comparisons (df, i). See also Supplementary Fig. 4.
Fig. 4
Fig. 4. IL1R expression defines a population of perivascular bone marrow stromal cells implicated in the HSC response to platelet depletion.
a RNA-sequencing analysis of Il1r1 gene expression (FPKM) in different niche cells isolated from mice in homeostasis (IgG treated) or 1 day post platelet depletion (GPIbα treated). Mean ± SD FPKM data of 3 biological replicates from 2 independent experiments. b, c Flow cytometric analysis of IL-1R expression in different endothelial/stromal cell populations isolated from mice in homeostasis or 1 day post platelet depletion. Mean ± SD data of Mean fluorescence intensity (MFI) normalized to the MFI of the equivalent cell population in Il1r1–/– mice analyzed within the same experiment (b). c Frequency of Lepr+ PV cells in total IL-1R+ CBM non-hematopoietic cells isolated from mice in homeostasis. Data from 4 (IgG) and 3 (GPIbα) mice in 2 independent experiments. d RNA-sequencing analysis of CBM-PV cells isolated from Il1r1+/+ and Il1r1–/– mice in homeostasis and after platelet depletion, for the expression of CBM-PV-GPIbα treatment responsive genes. Data from 3 biological replicates per condition. e Expression of IL-1 signaling pathway affiliated genes in CBM-PV cells isolated from Il1r1–/– mice 1 day post platelet depletion. Mean ± SD FPKM data of 3 biological replicates per condition. GSEA of global gene expression data for the indicated gene set (f) and expression (FPKM; Mean ± SD) of the indicated genes (g), in CBM-PV cells from wild type and Il1r1–/– mice in homeostasis and after platelet depletion. Data from 3 mice per condition. NES, normalized enrichment score (or scaled score). *p < 0.05; **p < 0.01; ns, non-significant (p > 0.05); using two-sided t-test (a, b, e) and 2-way ANOVA with Tukey’a multiple comparisons (g).
Fig. 5
Fig. 5. IL-1-dependent activation of perivascular bone marrow stromal cells enhance Vwf + HSC activity in response to platelet depletion.
(Related to Supplementary Fig. 6). ac Analysis of mice with conditional deletion of Il1r1 in Lepr+ perivascular cells (Il1r1FL/FL Lepr-CreTg/+) mice after platelet depletion. Controls include Il1r1FL/+ Lepr-CreTg/+, Il1r1+/+ Lepr-CreTg/+, Il1r1FL/FL Lepr-CreTg/+ (IgG only) and Lepr-Cre+/+ mice. a Cell cycle analysis of Vwf+ and VWF HSCs 1 day post platelet depletion. Data represent mean ± SD frequencies of 3 (control-IgG), 5 (control-GPIbα) and 5 (Il1r1FL/FL Lepr-CreTg/+-GPIbα) mice from 3 independent experiments. b Cell cycle analysis of Vwf+ and VWF HSCs from mice 1 day post intravenous administration of 50ug/Kg of IL-1β. Data are mean ± SD of 3 (control-IgG), 6 (control-GPIbα) and 4 (Il1r1FL/FL Lepr-CreTg/+-GPIbα) mice from 3 independent experiments. c Peripheral blood analysis of platelet recovery at the indicated time points post platelet depletion. Mean ± SD platelet numbers from 6 (control) and 11 (Il1r1FL/FL Lepr-CreTg/+) mice in 3 independent experiments. dg Differential gene expression analysis in Vwf+ and Vwf HSCs isolated from wild type mice 1 day post platelet depletion (GPIbα treatment). d Volcano plots of genes differentially expressed in Vwf+ and Vwf HSCs. Red dots indicate genes with significant expression differences (adjusted p value (q)<0.05). e Venn diagram showing number of differentially expressed genes in Vwf+ and Vwf HSCs post platelet depletion and between these HSC subsets in homeostasis (IgG). f GO terms analysis of biological processes/pathways up-regulated in Vwf+ HSCs after platelet depletion. g Expression (FPKM) of genes associated with Activin/BMP signaling in Vwf+ and Vwf HSCs from Wt mice in homeostasis and 1 day post platelet depletion. All data (dg) represent mean ± SD FPKM data of 3 biological replicates per genotype and condition. *p < 0.05; **p < 0.01; ***p < 0.001; ns non-significant (p > 0.05); using 2-way ANOVA with Tukey’s multiple comparisons (a, b), 2-way ANOVA with Sidak’s multiple comparisons (c) and two-sided t-test (g). See also Supplementary Fig. 5.
Fig. 6
Fig. 6. Neuraminidase-mediated platelet depletion does not activate HSCs.
(Related to Supplementary Fig. 4). a Expression of IL-1β in platelets resting or after in vitro activation (3hrs) with thrombin or GPIbα antibody. (Left), representative FACS profiles. Numbers in plots are average frequencies from 3 independent experiments. (Right) Frequency of IL-1β+ platelets; mean ± SD of 3 biological replicates per condition in 3 independent experiments. Each biological replicate consists of platelets pooled from 2-3 mice. b Kinetics analysis of peripheral blood cell lineages following in vivo Neuraminidase (NEU) administration. Data represent mean ± SEM of 10 (Day0), 7 (Day1), 8 (Day2), 9 (Day3), 6 (Day5) and 3 (Day10) mice from 6 independent experiments. PLT platelets, WBC white blood cells, RBC red blood cells. c Expression of surface P-selectin (CD62P) on platelets measured by flow cytometry after in vitro incubation with GPIbα antibody or NEU, at the indicated concentrations. Data represent mean ± SD fold changes of % CD62P+ cells in each condition in relation to untreated (resting) platelets, of 7 (Resting), 6 (IgG), 3 (GPIbα-2,5ug), 7 (GPIbα-5ug), 7 (NEU 0.005U) and 6 (NEU 0.05U) mice in 3 independent experiments. d In vitro neuraminidase (NEU) activity in resting platelets or after 30 min treatment with NEU, analyzed by RCA-1 binding. Representative profile from 1 out of 3 biological replicates. Numbers indicate mean ± SD % RCA-1+ platelets. e Mean ± SD cell cycle phase distribution of Vwf+ (left) and Vwf (right) HSCs 1 day post platelet depletion with NEU. Data from 6 mice per condition, in 3 independent experiments. f FACS-based assessment of the HSC compartment in bone marrow of mice at the indicated time points after platelet depletion with NEU. Data represent absolute numbers of Vwf-GFP+ (Vwf+) or Vwf-GFP (Vwf) HSCs (average ±SEM) at the indicated time points after platelet depletion. Data are from 5 (Day0), 4 (Day1), 5 (Day2) and 6 (Day3) mice in 4 independent experiments. No significant changes were observed in numbers of Vwf+ or Vwf HSCs at any time point. g Mean ± SD levels (fold-increase relative to Day0) of the indicated cytokines in bone marrow extracellular fluid isolated from mice at the indicated time points post platelet depletion with Neuraminidase. Data from 3 mice per time point in 2 independent experiments. h Mice were treated with NEU at day 0, followed by GPIbα antibody administration at day 2 and analyzed at day 3 (left) for cell cycle phase distribution in Vwf+ HSCs (right). Control mice were treated only with GPIbα antibody and analyzed 1 day later. Data represent mean ± SD frequencies of 4 mice per group in 2 independent experiments. i HSCs in S-G2-M in Nbeal2–/– mice 1 day post platelet depletion (GPIbα). Data represent mean ± SD cell frequencies of 5 (Wt-IgG), 3 (Wt-GPIbα), 4 (Nbeal2–/–-IgG) and 5 (Nbeal2–/–-GPIbα) mice per condition from 3 independent experiments. j Scheme depicting the feedback mechanism proposed. While being consumed activated platelets secrete IL-1, which activates IL-1R expressing PV cells to induce HSC proliferation and differentiation toward the platelet lineage. As indicated, Mks may also contribute to the described recruitment of HSCs into proliferation in response to treatment with the anti-GPIbα antibody resulting in activation-dependent platelet depletion. For all data ***p < 0.001; **p < 0.01; *p < 0.05 (Only indicated for significant differences) using 1-way ANOVA with Tukey’s multiple comparisons (a, c, f, i), 2-way ANOVA with Sidak’s multiple comparisons (e, h) or Dunnett’s multiple comparisons (g); ns non-significant. See also Supplementary Fig. 6.

References

    1. King KY, Goodell MA. Inflammatory modulation of HSCs: viewing the HSC as a foundation for the immune response. Nat. Rev. Immunol. 2011;11:685–692. - PMC - PubMed
    1. Takizawa H, Boettcher S, Manz MG. Demand-adapted regulation of early hematopoiesis in infection and inflammation. Blood. 2012;119:2991–3002. - PubMed
    1. Wilson A, et al. Hematopoietic stem cells reversibly switch from dormancy to self-renewal during homeostasis and repair. Cell. 2008;135:1118–1129. - PubMed
    1. Baldridge MT, King KY, Boles NC, Weksberg DC, Goodell MA. Quiescent haematopoietic stem cells are activated by IFN-gamma in response to chronic infection. Nature. 2010;465:793–797. - PMC - PubMed
    1. Essers MA, et al. IFNalpha activates dormant haematopoietic stem cells in vivo. Nature. 2009;458:904–908. - PubMed

Publication types