. 2023 Sep 28;13(1):16333.
doi: 10.1038/s41598-023-43484-1.

Exploring the role of miR-200 family in regulating CX3CR1 and CXCR1 in lung adenocarcinoma tumor microenvironment: implications for therapeutic intervention

Affiliations

Exploring the role of miR-200 family in regulating CX3CR1 and CXCR1 in lung adenocarcinoma tumor microenvironment: implications for therapeutic intervention

Archana Sharma et al. Sci Rep. .

Abstract

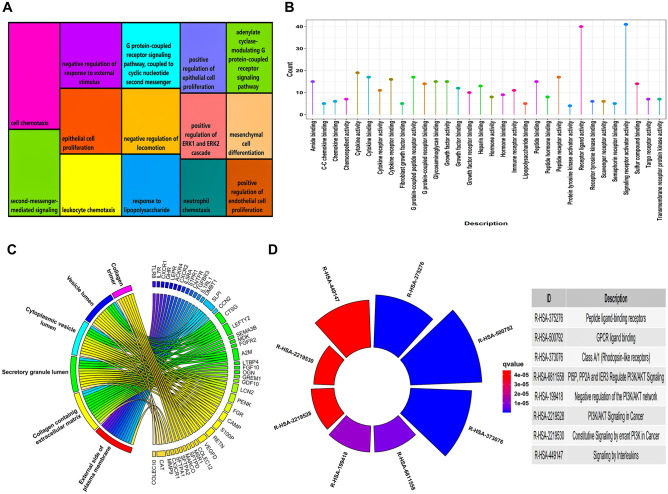
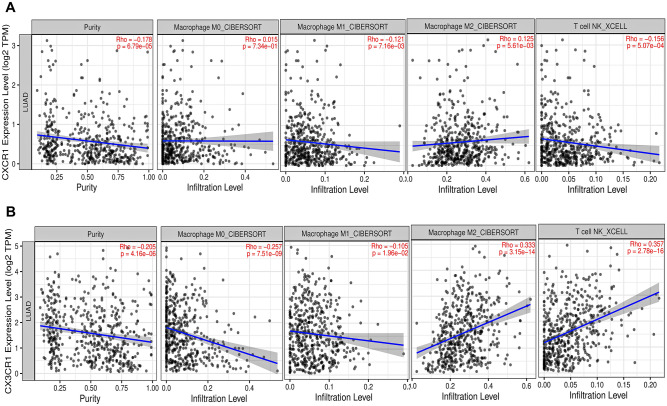
Lung adenocarcinoma (LUAD) is the most common malignant subtype of lung cancer (LC). miR-200 family is one of the prime miR regulators of epithelial-mesenchymal transition (EMT) and worst overall survival (OS) in LC patients. The study aimed to identify and validate the key differentially expressed immune-related genes (DEIRGs) regulated by miR-200 family which may serve for therapeutic aspects in LUAD tumor microenvironment (TME) by affecting cancer progression, invasion, and metastasis. The study identified differentially expressed miRNAs (DEMs) in LUAD, consisting of hsa-miR-200a-3p and hsa-miR-141-5p, respectively. Two highest-degree subnetwork motifs identified from 3-node miRNA FFL were: (i) miR-200a-3p-CX3CR1-SPIB and (ii) miR-141-5p-CXCR1-TBX21. TIMER analysis showed that the expression levels of CX3CR1 and CXCR1 were significantly positively correlated with infiltrating levels of M0-M2 macrophages and natural killer T (NKT) cells. The OS of LUAD patients was significantly affected by lower expression levels of hsa-miR-200a-3p, CX3CR1 and SPIB. These DEIRGs were validated using the human protein atlas (HPA) web server. Further, we validated the regulatory role of hsa-miR-200a-3p in an in-vitro indirect co-culture model using conditioned media from M0, M1 and M2 polarized macrophages (THP-1) and LUAD cell lines (A549 and H1299 cells). The results pointed out the essential role of hsa-miR-200a-3p regulated CX3CL1 and CX3CR1 expression in progression of LC TME. Thus, the study augments a comprehensive understanding and new strategies for LUAD treatment where miR-200 family regulated immune-related genes, especially chemokine receptors, which regulate the metastasis and invasion of LUAD, leading to the worst associated OS.


Conflict of interest statement

The authors declare no competing interests.

Figures

Figure 1
Figure 1
(A) Treemap chart illustrating significant GO-BP terms associated with DEIRGs. Each rectangular shape represents individual terms and their sizes vary according to the number of genes present in them. All the rectangles have a unique color signifying the distinct 14 BP terms. The term “cell chemotaxis” has the highest number of genes present in it, i.e., 27. While the terms “neutrophil chemotaxis” and “positive regulation of endothelial cell proliferation” has the lowest number of genes present in it, i.e., 13. (B) Lollipop plot showing the distribution of significant GO-MF terms associated with DEIRGs. The x and y axes represents the MF terms and gene count. The term “signaling receptor activator activity” has highest number of genes present in it, i.e., 41. The term “protein tyrosine kinase activator activity” has lowest number of genes present in it, i.e., 4. (C) Circos plot representing significant GO-CC terms associated with DEIRGs. Outer boundary of the circle consists of 6 CC terms (on the left) linked with the DEIRGs present in them (on the right). Each gene and pathway are denoted by unique color strips with an undirected edge showing the corresponding associations. (D) Circular barplot showing the distribution of 8 significant pathways associated with DEIRGs. The color and sizes of bars depend on the q-value and gene count, respectively.
Figure 2
Figure 2
(A) Unweighted and undirected PPIN of significantly enriched DEIRGs comprising 7 nodes and 30 edges. (B) Top-scoring PPIN cluster comprising a total of 4 nodes and 30 edges. Cyan-colored nodes signify downregulated expression status of DEIRGs. (C) Split violin plot displaying the expression intensity distribution of 4 hub DEIRGs. The normal and tumor samples are represented by magenta and sea green colors. The top and bottom of the boxes inside the splitted violin depicts the 75th and 25th percentile of the distribution, respectively. The horizontal lines within the boxes signifies the median values. Axis endpoints are labelled by the minimum and maximum values, respectively.
Figure 3
Figure 3
(A) Unweighted LUAD-specific 3-node miRNA FFL comprising 30 nodes and 30 edges. (B) miR-200 family-associated highest-order subnetwork motif comprising one miRNA (hsa-miR-200a-3p), one TF (SPIB), and one hub DEIRG (CX3CR1). (C) miR-200 family-associated second highest-order subnetwork motif comprising one miRNA (hsa-miR-141-5p), one TF (TBX21), and one hub DEIRG (CXCR1). The green, red, and magenta-colored nodes represents the TFs, hub DEIRGs, and miRNAs, respectively.
Figure 4
Figure 4
ROC curve analyses of (A) CX3CR1 and (B) CXCR1. (C) Pairwise scatter plot of miR-200 associated hub items, i.e., CX3CR1, CXCR1, hsa-miR-200a-3p, and hsa-miR-141-5p. The upper triangular section represents the Spearman’s correlation coefficients between these hub items. While the lower triangular section represents the scatterplot and histogram distribution between these hub items. The diagonal consists of kernel densities for each hub item. Significant levels at 0.05, 0.01, and 0.001 are represented by *, **, and ***, respectively.
Figure 5
Figure 5
Scatterplots showing significant correlations of (A) CXCR1 and (B) CX3CR1 mRNA expression with M0, M1, M2, NKT infiltrating levels across the TCGA-LUAD cohort. mRNA expression levels against tumor purity are demonstrated on the left panel. Spearman’s correlation and estimated statistical significance are displayed for each scatter plot.
Figure 6
Figure 6
Representative IHC images of (A) CX3CR1 and (B) CXCR1 across normal and LUAD tissues via HPA database.
Figure 7
Figure 7
KM plots showing OS of (A) CX3CR1, (B) miR-200a-3p, and (C) SPIB. The black and red colored lines corresponds to LUAD samples with lower and higher expression levels, respectively. The lower expression of all these subnetwork motif items correlates with lower OS in LUAD patients. All these motif items were highly significant (logrankp<0.05).
Figure 8
Figure 8
(A) Relative fold change in expression of CX3CR1 in M0 (unstimulated), M1 (LPS stimulated) and M2 (IL4 stimulated) macrophages. Relative fold change in the expression of (B) CX3CL1 and (C) CX3CR1 upon transfection of scrambled/ miR-200a-3p in A549 cells indirectly co-cultured in M0/M1/M2 macrophage conditioned medium as determined by qRT-PCR. (D) Percentage proliferation of scrambled/ miR-200a-3p transfected A549 cells when indirectly co-cultured in M0/M1/M2 macrophage conditioned medium, as determined by MTT assay. Relative fold change in the expression of (E) CX3CL1 and (F) CX3CR1 upon transfection of scrambled/ miR-200a-3p in H1299 cells indirectly co-cultured in M0/M1/M2 macrophage conditioned medium as determined by qRT-PCR. (G) Percentage proliferation of scrambled/ miR-200a-3p transfected H1299 cells when indirectly co-cultured in M0/M1/M2 macrophage conditioned medium, as determined by MTT assay. β-actin was used as an endogenous control. ns- Nonsignificant, *p < 0.05, **p < 0.01, ***p < 0.001.

References

    1. Shi J, et al. Somatic genomics and clinical features of lung adenocarcinoma: A retrospective study. PLoS Med. 2016;13:e1002162. - PMC - PubMed
    1. Consonni D, et al. Lung cancer prognosis before and after recurrence in a population-based setting. J. Natl. Cancer Inst. 2015;107:djv059. - PMC - PubMed
    1. Liang Y, Wakelee HA. Adjuvant chemotherapy of completely resected early stage non-small cell lung cancer (NSCLC) Transl. Lung Cancer Res. 2013;2:403–410. - PMC - PubMed
    1. Pecot CV, et al. Tumour angiogenesis regulation by the miR-200 family. Nat. Commun. 2013;4:2427. - PMC - PubMed
    1. Tejero R, et al. miR-141 and miR-200c as markers of overall survival in early stage non-small cell lung cancer adenocarcinoma. PLoS ONE. 2014;9:e101899. - PMC - PubMed

Publication types

MeSH terms