

MicroRNAs in Parkinson's disease: a systematic review and diagnostic accuracy meta-analysis
- PMID: 37770507
- PMCID: PMC10539377
- DOI: 10.1038/s41598-023-43096-9
MicroRNAs in Parkinson's disease: a systematic review and diagnostic accuracy meta-analysis
Abstract
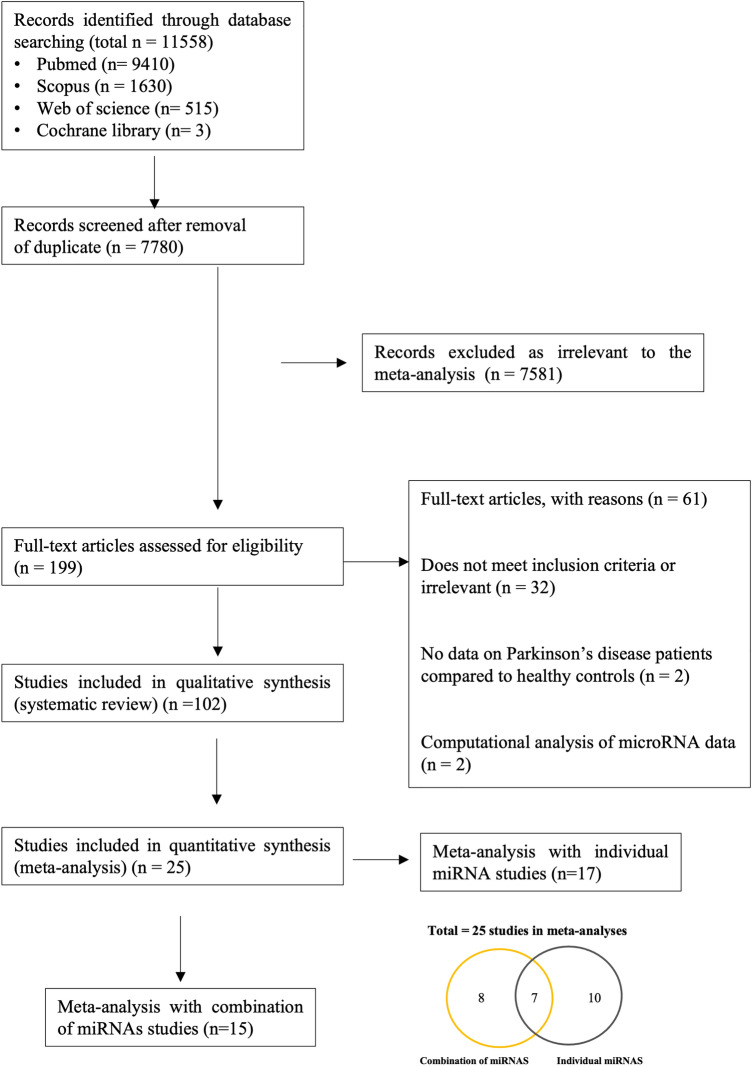
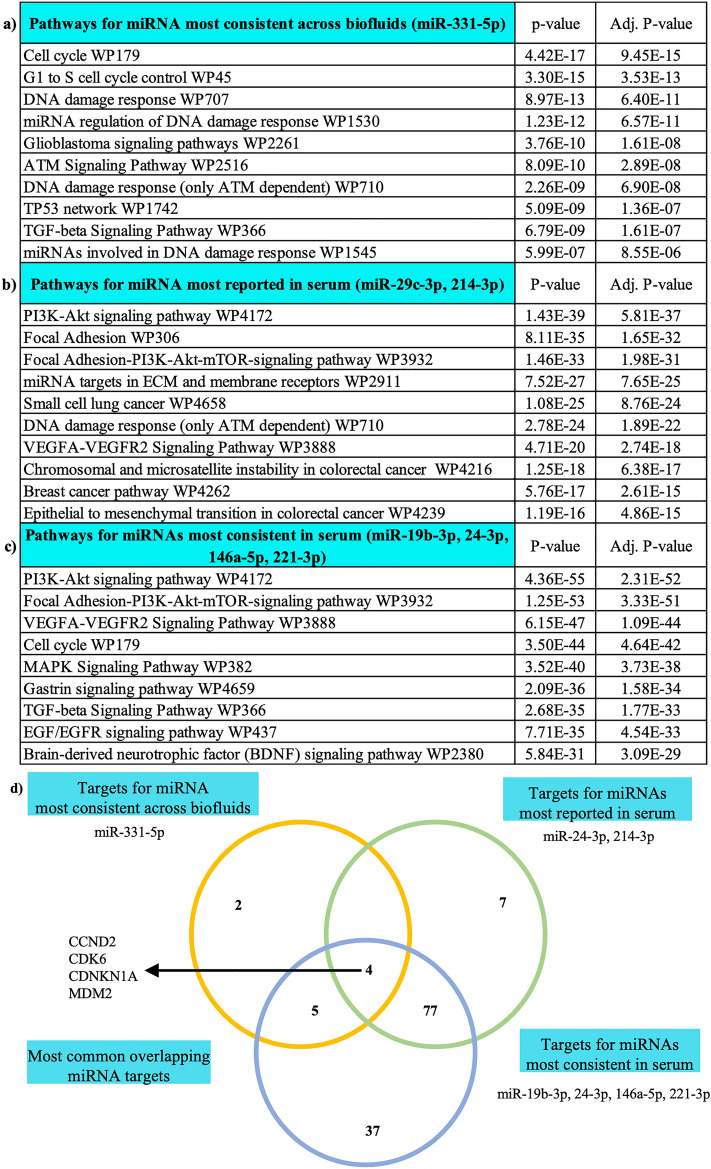
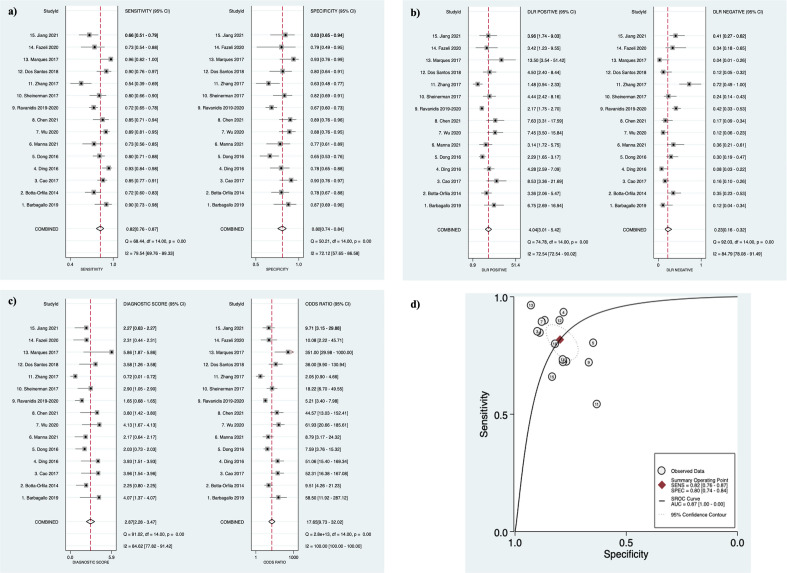
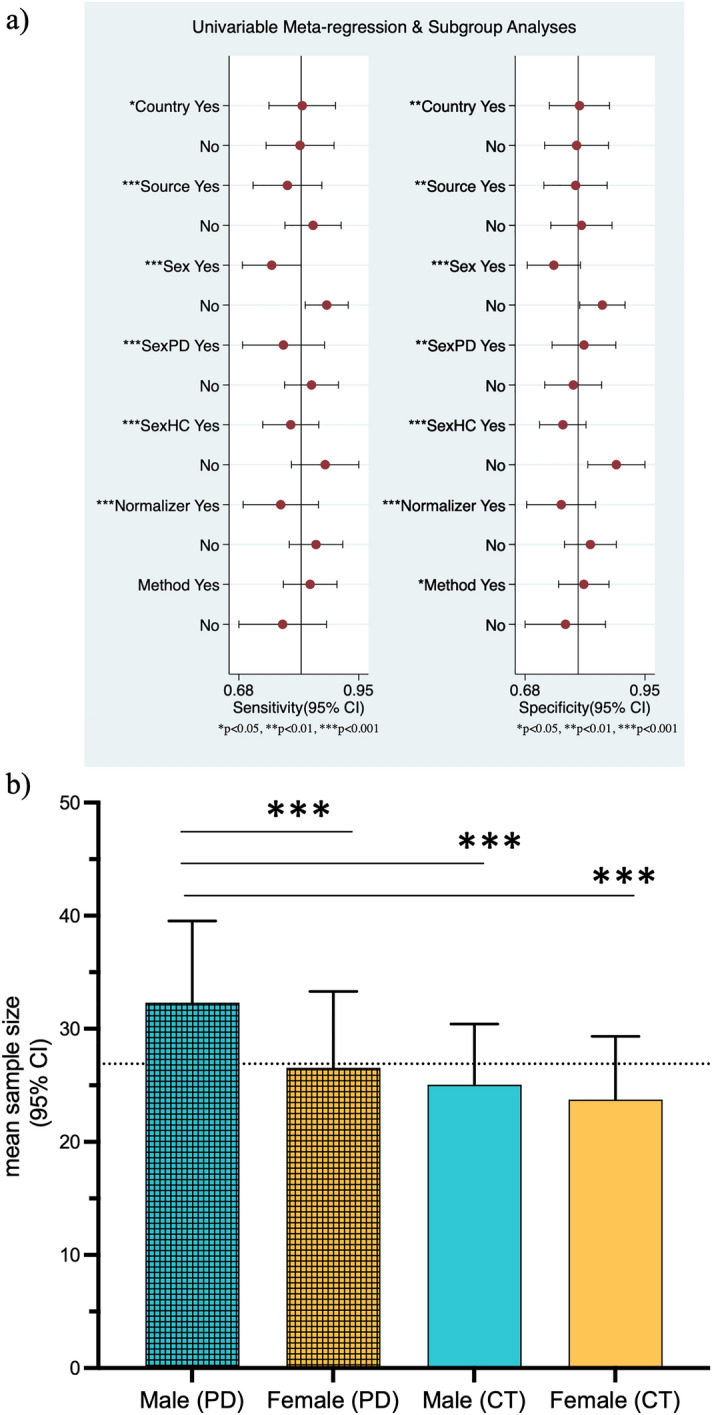
Current clinical tests for Parkinson's disease (PD) provide insufficient diagnostic accuracy leading to an urgent need for improved diagnostic biomarkers. As microRNAs (miRNAs) are promising biomarkers of various diseases, including PD, this systematic review and meta-analysis aimed to assess the diagnostic accuracy of biofluid miRNAs in PD. All studies reporting data on miRNAs expression in PD patients compared to controls were included. Gene targets and significant pathways associated with miRNAs expressed in more than 3 biofluid studies with the same direction of change were analyzed using target prediction and enrichment analysis. A bivariate model was used to calculate sensitivity, specificity, likelihood ratios, and diagnostic odds ratio. While miR-24-3p and miR-214-3p were the most reported miRNA (7 each), miR-331-5p was found to be consistently up regulated in 4 different biofluids. Importantly, miR-19b-3p, miR-24-3p, miR-146a-5p, and miR-221-3p were reported in multiple studies without conflicting directions of change in serum and bioinformatic analysis found the targets of these miRNAs to be associated with pathways important in PD pathology. Of the 102 studies from the systematic review, 15 studies reported sensitivity and specificity data on combinations of miRNAs and were pooled for meta-analysis. Studies (17) reporting sensitivity and specificity data on single microRNA were pooled in a separate meta-analysis. Meta-analysis of the combinations of miRNAs (15 studies) showed that biofluid miRNAs can discriminate between PD patients and controls with good diagnostic accuracy (sensitivity = 0.82, 95% CI 0.76-0.87; specificity = 0.80, 95% CI 0.74-0.84; AUC = 0.87, 95% CI 0.83-0.89). However, we found multiple studies included more males with PD than any other group therefore possibly introducing a sex-related selection bias. Overall, our study captures key miRNAs which may represent a point of focus for future studies and the development of diagnostic panels whilst also highlighting the importance of appropriate study design to develop representative biomarker panels for the diagnosis of PD.
© 2023. Springer Nature Limited.
Conflict of interest statement
The authors declare no competing interests.
Figures
Similar articles
-
Identification of plasma microRNA expression changes in multiple system atrophy and Parkinson's disease.Mol Brain. 2019 May 14;12(1):49. doi: 10.1186/s13041-019-0471-2. Mol Brain. 2019. PMID: 31088501 Free PMC article.
-
Differential expression and significance of miRNAs in plasma extracellular vesicles of patients with Parkinson's disease.Int J Neurosci. 2022 Jul;132(7):673-688. doi: 10.1080/00207454.2020.1835899. Epub 2020 Oct 26. Int J Neurosci. 2022. PMID: 33045885
-
Several miRNAs derived from serum extracellular vesicles are potential biomarkers for early diagnosis and progression of Parkinson's disease.Transl Neurodegener. 2021 Jul 28;10(1):25. doi: 10.1186/s40035-021-00249-y. Transl Neurodegener. 2021. PMID: 34315539 Free PMC article.
-
MicroRNA expression in osteoarthritis: a meta-analysis.Clin Exp Med. 2023 Nov;23(7):3737-3749. doi: 10.1007/s10238-023-01063-8. Epub 2023 Apr 7. Clin Exp Med. 2023. PMID: 37027064
-
Diagnostic performance of microRNAs in the detection of heart failure with reduced or preserved ejection fraction: a systematic review and meta-analysis.Eur J Heart Fail. 2022 Dec;24(12):2212-2225. doi: 10.1002/ejhf.2700. Epub 2022 Oct 27. Eur J Heart Fail. 2022. PMID: 36161443 Free PMC article.
Cited by
-
Bibliometric analysis of microRNAs and Parkinson's disease from 2014 to 2023.Front Neurol. 2024 Sep 25;15:1466186. doi: 10.3389/fneur.2024.1466186. eCollection 2024. Front Neurol. 2024. PMID: 39385824 Free PMC article.
-
Dataset of miRNA-disease relations extracted from textual data using transformer-based neural networks.Database (Oxford). 2024 Aug 5;2024:baae066. doi: 10.1093/database/baae066. Database (Oxford). 2024. PMID: 39104284 Free PMC article.
-
Differences in Blood and Cerebrospinal Fluid Between Parkinson's Disease and Related Diseases.Cell Mol Neurobiol. 2024 Dec 27;45(1):9. doi: 10.1007/s10571-024-01523-z. Cell Mol Neurobiol. 2024. PMID: 39729132 Free PMC article. Review.
-
Circulating MiRNAs as diagnostic biomarkers of lupus nephritis in patients with systemic lupus erythematosus: a systematic review and meta-analysis.Sci Rep. 2025 Jul 1;15(1):21714. doi: 10.1038/s41598-025-07860-3. Sci Rep. 2025. PMID: 40596596 Free PMC article.
-
miR-146a Regulates Neuroinflammation and Immune Cell Function in Neurodegenerative Diseases.Curr Med Sci. 2025 Aug;45(4):725-744. doi: 10.1007/s11596-025-00080-w. Epub 2025 Jul 9. Curr Med Sci. 2025. PMID: 40632438 Review.
References
-
- Nussbaum RL, Ellis CE. Alzheimer’s disease and Parkinson’s disease. N. Engl. J. Med. 2003;348:1356–1364. - PubMed
-
- Dauer W, Przedborski S. Parkinson’s disease. Neuron. 2003;39:889–909. - PubMed
-
- Singh A, Sen D. MicroRNAs in Parkinson’s disease. Exp. Brain Res. 2017;235:2359–2374. - PubMed
-
- da Silva F, et al. MicroRNAs involved in Parkinson’s disease: A systematic review. Mol. Med. Rep. 2016;14:4015–4022. - PubMed
Publication types
MeSH terms
Substances
LinkOut - more resources
Full Text Sources
Medical
Research Materials
