. 2023 Sep 28;14(1):6073.
doi: 10.1038/s41467-023-41848-9.

Global mapping of RNA-chromatin contacts reveals a proximity-dominated connectivity model for ncRNA-gene interactions

Affiliations

Global mapping of RNA-chromatin contacts reveals a proximity-dominated connectivity model for ncRNA-gene interactions

Charles Limouse et al. Nat Commun. .

Abstract

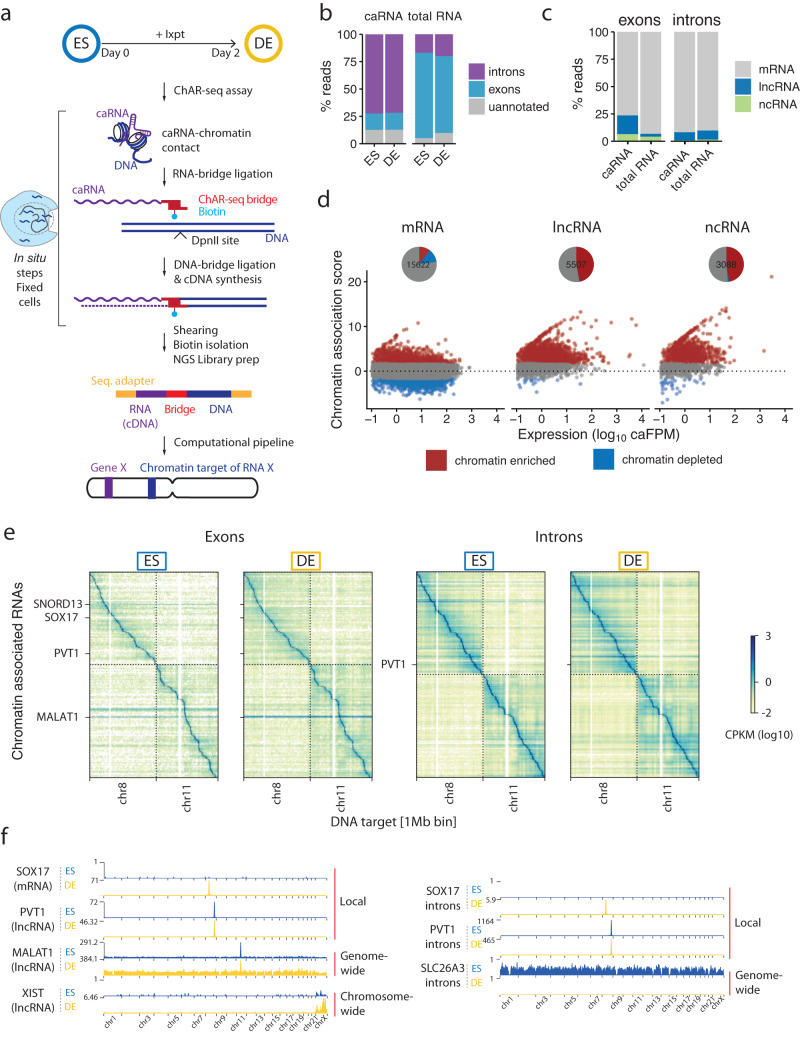
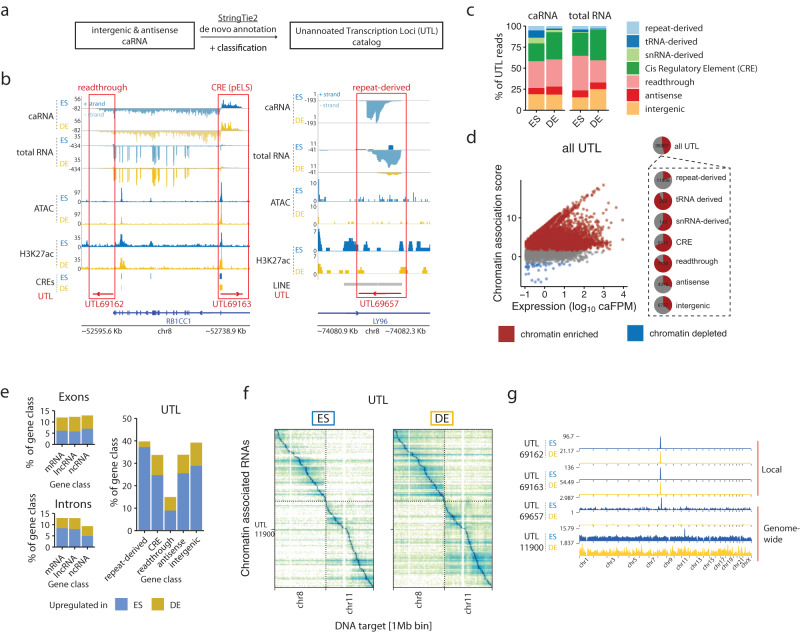
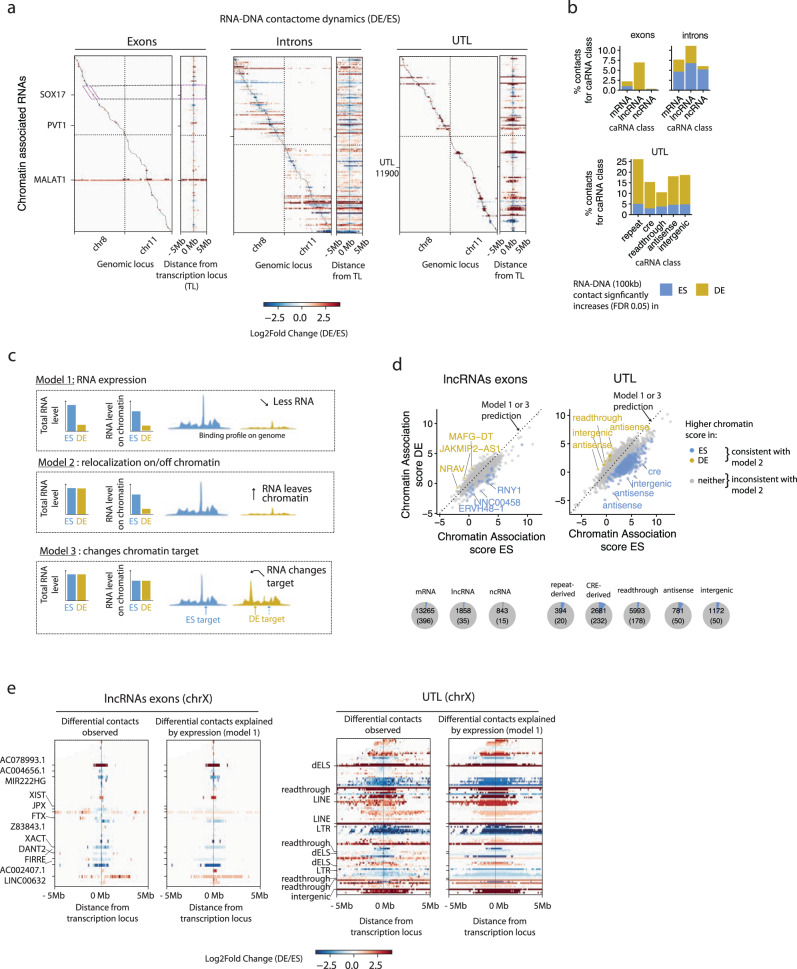
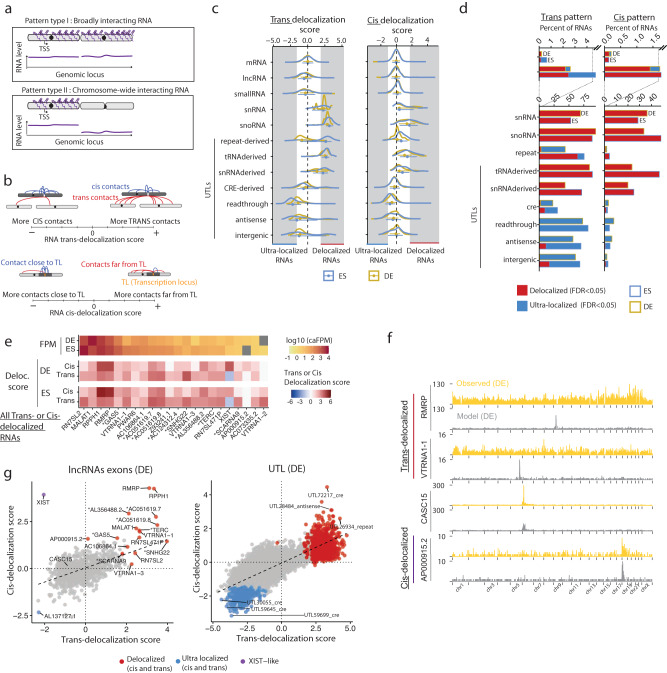
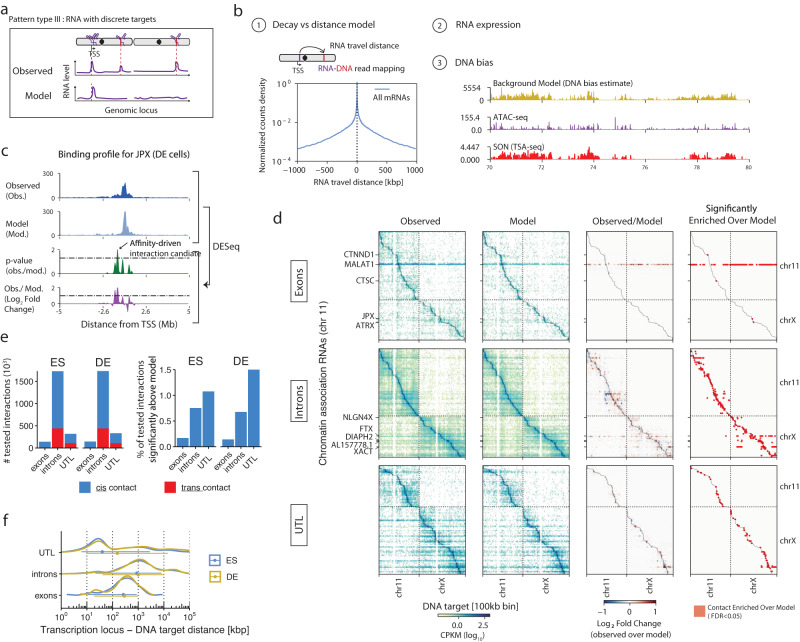
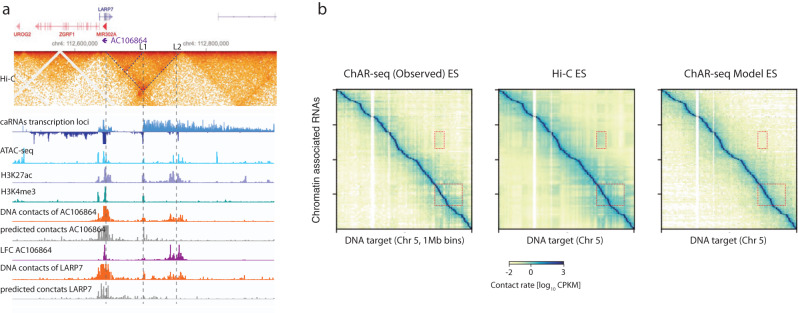
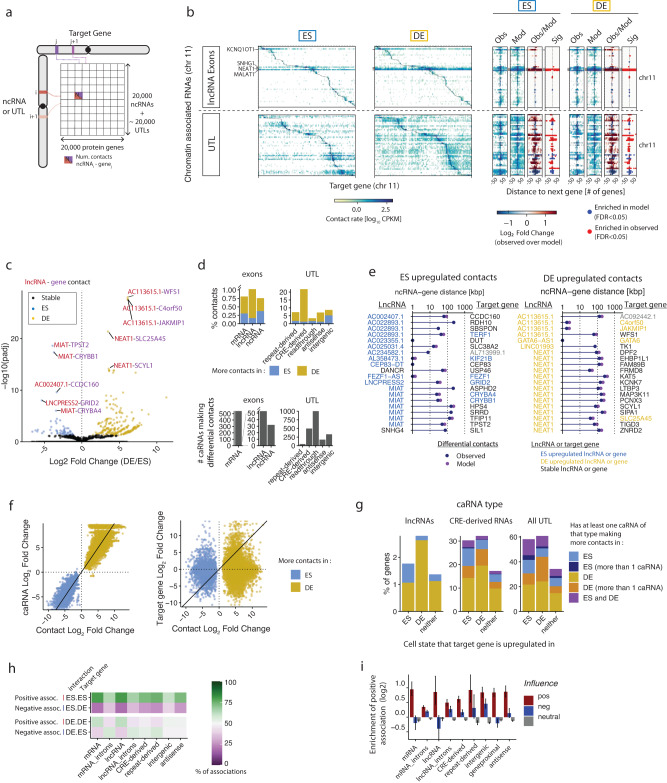
Non-coding RNAs (ncRNAs) are transcribed throughout the genome and provide regulatory inputs to gene expression through their interaction with chromatin. Yet, the genomic targets and functions of most ncRNAs are unknown. Here we use chromatin-associated RNA sequencing (ChAR-seq) to map the global network of ncRNA interactions with chromatin in human embryonic stem cells and the dynamic changes in interactions during differentiation into definitive endoderm. We uncover general principles governing the organization of the RNA-chromatin interactome, demonstrating that nearly all ncRNAs exclusively interact with genes in close three-dimensional proximity to their locus and provide a model predicting the interactome. We uncover RNAs that interact with many loci across the genome and unveil thousands of unannotated RNAs that dynamically interact with chromatin. By relating the dynamics of the interactome to changes in gene expression, we demonstrate that activation or repression of individual genes is unlikely to be controlled by a single ncRNA.


Conflict of interest statement

W.J.G. is a consultant and equity holder for 10x Genomics, Guardant Health, Quantapore and Ultima Genomics, Lamar Health, and cofounder of Protillion Biosciences, and is named on patents describing ATAC-seq. A.F.S and O.K.S are named on patents describing DiMeLo-seq. All other authors declare no competing interests.

Figures

Fig. 1
Fig. 1. Global mapping of RNA-chromatin interactions during stem-cell differentiation.
a Schematic of the strategy used to map RNA-DNA contacts across the transcriptome and genome using ChAR-seq, highlighting the key steps of the workflow. b, c Composition of the caRNAs identified by ChAR-seq compared to the total RNA population determined by total RNA sequencing. d Scatter plots showing the chromatin association scores for individual RNAs originating from annotated exons as a function of the RNA level in the caRNA population. Chromatin-enriched and depleted RNAs were determined using DESeq2 (FDR 0.05, fold change threshold 3x). Pie charts summarize the fraction of chromatin-enriched and chromatin-depleted RNA in each functional RNA type. The numbers within each pie chart indicate the total number of RNAs in that category. e RNA-DNA contact maps in ES and DE cells for the top 200 most abundant caRNAs (according to their mean expression in ES and DE cells) on Chr7 and Chr8. Maps are displayed at a resolution of 1 RNA per row and 1 Mbp of genome space per column. Color represents contact density, defined as the number of contacts between an RNA and a genomic bin, normalized for sequencing-depth and size of the genomic bin (CPKM: Contacts Per Kb in target genomic region per Million reads). Contacts made by exonic and intronic RNAs are shown in the left and right maps, respectively. f Interaction profiles along the genome for SOX17, PVT1, MALAT1 and XIST exons, and for SOX17, PVT1 and SLC26A3 introns, illustrating 3 major classes of interaction profiles: RNAs localized predominantly near their transcription locus (SOX17, PVT1 exons and introns), spreading across a single chromosome (XIST), and across the genome (MALAT1, SLC26A3 introns).
Fig. 2
Fig. 2. Cell-state-specific unannotated RNAs make up a large fraction of the caRNAs.
a Schematic of the method used to catalog unannotated RNAs by identifying transcription units using StringTie2. b Genome tracks showing the chromatin context of 3 representative unannotated transcription loci (UTL). Left panel: UTL69162 and UTL69163, respectively, downstream and antisense to RB1CC1, are classified as readthrough RNA and CRE-derived RNAs. Right panel: UTL69657 is classified as a repeat-derived RNA due to its overlap with a LINE element. In both left and right panels, the top 2 tracks display the strand-specific genome coverage of the RNA-derived side of the ChAR-seq reads in ES and DE replicate 1 (+ strand ES in dark blue, − strand ES in light blue, + strand DE in dark yellow, − strand ES in light yellow). The next two tracks display the strand-specific genome coverage of the total RNA-seq data. c Relative composition of the chromatin-associated UTLs in the 7 annotation classes. d Scatter plots showing the chromatin association scores for individual UTLs and their abundance in the caRNA population. Chromatin-enriched and depleted UTLs were determined using DESeq2 (FDR 0.05, fold change threshold 3x). Pie charts summarize the fraction of chromatin-enriched and chromatin-depleted UTLs in each category. Numbers within each pie chart indicate the total number of RNAs in that category. e Percentage of genes upregulated and downregulated in DE vs ES cells in the caRNA transcriptome and for each RNA category. Up- and downregulated RNAs were identified using DESeq2 (FDR 0.05, fold change threshold 3x). f RNA-DNA contact maps in ES and DE cells for the top 200 most abundant UTLs on Chr7 and Chr8, displayed at a resolution of 1 RNA per row and 1 Mbp of genome space per column. g Genome-scale chromatin interaction profiles of 4 UTLs showing similar localization patterns as annotated RNAs.
Fig. 3
Fig. 3. The RNA-DNA interactome dynamics are controlled at the transcription level.
a Differential contact maps showing the changes in the RNA-DNA interactome on Chr8 and Chr11 during cellular differentiation for the same top 200 most abundant exonic RNAs, intronic RNAs, and UTLs as those shown Figs. 1e and 2f. For each RNA category, the left map shows the log2 fold change (LFC) in the frequency of each RNA-DNA contact, as computed by DESeq2 (shrunken LFC estimates, see “Methods”). x-axis resolution is 1 Mb as in Figs. 1e and 2f. The right map shows a zoom-in of the left differential map in a 10 Mb window centered at the Transcription Locus (TL) of each caRNA and displayed with an x-axis resolution of 100 kb. b Quantification by RNA class of the percentage of interactions upregulated in DE or ES cells among all interactions tested in that class (interactions with >10 counts in at least one replicate in ES or DE) at 100 kb resolution (bottom panel). c Schematic of 3 models that can explain changes in the DNA contact profile of an RNA during differentiation. d Scatter plot showing the chromatin association score for individual lncRNAs exons (left panel) and UTLs (right panel) in ES versus DE cells. All of the caRNAs with an expression level above 0.1 FPM in both ES and DE cells are shown. Pie charts summarize the fraction of RNAs with significantly higher chromatin association in ES or DE cells (fold change >3, FDR 0.05) and for each RNA class. Numbers within the pie charts indicate the total number of RNAs in that class (FPM > 0.1) and the number of RNAs with differential chromatin association. e Differential contact maps observed versus those explained by transcription dynamics only for the 50 most abundant lncRNAs (left) and UTL (right) on ChrX. Labeled genes are the top 12 most abundant genes. x-axis resolution is 100 kb and a 10 Mb window centered around each RNA TL is shown.
Fig. 4
Fig. 4. A select population of caRNAs interacts with the genome broadly.
a Schematic of the two types of binding patterns identified in this analysis: type I RNAs localized across the genome (trans-delocalized RNAs), type II RNAs localized throughout their source chromosome but absent on other chromosomes (cis-delocalized RNAs). b Schematic definition of the trans- and cis-delocalization scores. The trans-delocalization score quantifies the number of DNA contacts an RNA makes on chromosomes other than its source chromosome (trans-contacts) relative to the number of contacts on its source chromosome (cis-contacts). The cis-delocalization score quantifies the number of DNA contacts an RNA makes over 10 Mb away from its transcription locus (TL) relative to the number of contacts within 10 Mb of its TL. c Distribution of trans- (left) and cis- (right) delocalization scores (geometric mean over 2 independent replicates per cell state) and by class of RNA for exons (n = 23,436 RNAs) and UTLs (n = 19,069 RNAs). Error bars represent the median and 25–75% quartiles. d Fraction of RNAs within each class identified as either delocalized or ultralocalized in regard to its trans- (left) or cis-chromosomal contacts (right). e List of all lncRNAs identified as cis or trans-delocalized in either ES or DE cells and candidate RNAs for type I or type II patterns. Heat maps show the RNA cis and trans-delocalization scores in ES and DE cells and their abundance in the caRNA population. f Chromatin interaction profiles for two examples of cis-delocalized RNAs (RMRP, VTRNA1-1), one example of cis-delocalized RNAs (AP000915.2), and one non-delocalized RNA (CASC15). The yellow track shows the observed ChAR-seq signal. The gray track shows the predicted interaction profile based on the generative model with trans-contact rate prediction, as described in Fig. 5 and Supplementary Note 4. g Scatter plot showing the cis- versus trans-delocalization score for individual lncRNAs in ES cells (left) and UTLs in DE cells (right, excludes tRNA-derived and snRNA-derived UTLs). Colored data points indicate RNAs classified as delocalized (in either cis or trans), ultralocalized (in both cis and trans), and RNAs with XIST-like behavior. The black line shows the linear regression output.
Fig. 5
Fig. 5. RNA expression and genomic distance determine the RNA-DNA interactome.
a Schematic of the type of binding patterns identified in this analysis. An RNA may localize at one or more discrete loci distinct from its transcription site (Pattern type III, top track) or remain in a diffusion-constrained region around its locus (neutral RNA, bottom track). b Components of the generative model used to predict the ChAR-seq maps. The number of contacts observed for an RNA at a DNA locus is proportional to (1) an RNA-DNA distance-dependent contact frequency, (2) the abundance of the RNA on chromatin, (3) a target locus-dependent bias (DNA-bias, yellow track), which correlates with both ATAC-seq signal (purple track) and nuclear speckle proximity signal (TSA-seq, red track). c Example of a type III pattern with a candidate affinity-driven interaction for the lncRNA JPX in DE cells. The observed and predicted localization of JPX (top two tracks) at 10 kb resolution and are compared using DESeq2, yielding a Log2 fold change (observed over model) and an adjusted p-value track (bottom two tracks). Interactions with an LFC greater than 1.3 and an adjusted p-value smaller than 0.05 are labeled as candidate affinity-driven interaction. d Observed contact maps, predicted contact maps, and observed over model LFC maps computed using DESeq2 for the top 200 most abundant RNAs originating from exons (top), introns (middle) and UTLs (bottom). x-axis resolution is 100 kb per bin; y-axis resolution is 1 RNA per bin. Only interactions with at least 10 counts in at least two samples were tested for differences with the model and are shown in the LFC maps. e Number of interactions tested for enrichment over model and proportion of identified candidate affinity-driven interactions by RNA class, in relation to the total number of tested interactions in that RNA class. f Distribution of the RNA-DNA travel distance for interactions significantly above model (n = 33,653 interactions). Error bars represent the median and 25–75% quartiles. The RNA-DNA travel distance is calculated using the mapping coordinates of the RNA and DNA side of the ChAR-seq read (“Methods”).
Fig. 6
Fig. 6. The 3D genome organization enables long-distance RNA-DNA contacts.
a Example of long-range RNA-DNA contacts across a chromatin loop at the LARP7 & AC106864 locus in ES cells. ICE normalized Hi-C map (2 kb resolution) is shown at the top. Transcription of LARP7 (expressed from the positive strand) and AC106864 (expressed from the negative strand, shown as negative values) are detected by ChAR-seq (top 2 tracks). The observed (dark orange) and predicted localization pattern (dark gray) of AC106864 on chromatin are shown with the log fold difference between observed and predicted (purple). The observed and predicted localization patterns for LARP7 are shown in light orange and light gray. ATAC-seq, H3K27ac and H3K4me3 tracks are also shown and indicate that L2 has enhancer-like chromatin properties. b Comparison between ChAR-seq and Hi-C at the chromosome scale. Dashed boxes highlight two example regions where the A/B compartments plaid pattern is clearly visible in both Hi-C and ChAR-seq maps.
Fig. 7
Fig. 7. The caRNA-gene interactome preferentially links upregulated caRNAs to upregulated genes.
a Representation of the caRNA-gene interactome as a matrix containing the number of contacts between an ncRNA (row) and the proximal regulatory region (PRR) of a protein-coding gene (column). Only cis interactions are shown for simplicity. b caRNA-gene interactome in ES and DE cells for the 50 most abundant lncRNAs (top) and UTLs (bottom) on Chr11 (left). Expanded view of the interactome for 50 protein-coding genes upstream and downstream of each caRNA PRR (right). Expanded maps are shown for the true interactome signal (Obs), the generative model prediction (Mod), the log2 fold change of the observed over model (Obs/Model), and the interactions significantly enriched in the observed over the model (Sig, p-value < 0.05 and LFCobs, model > 0)as described in Fig. 5c, d (“Methods”). c Volcano plot showing the differential lncRNA-gene contacts is ES versus DE cells. Each data point is a contact between a lncRNA and the PRR of a protein-coding gene. log2 Fold Change of contact rate in DE versus ES cells (LFC_ES, DE) and False Discovery Rate adjusted p-values were computed with DESeq2 as in Fig. 3a, and colored contacts are those with an adjusted p-value < 0.05. d Quantification of the percentage of cell-state-specific contacts for each class of caRNA relative to the number of contacts tested for that class (top) and number of distinct caRNAs involved in these contacts (bottom). Cell-specific contacts were defined as those with an adjusted p-value < 0.05 and LFCES,DE > 1.3 by DESeq2. e Top 20 lncRNA-gene contacts upregulated in ES (left) and DE cells (right) in the observed data (blue circles). Most of these contacts are also predicted to be among the 20 most upregulated contacts by the generative model (purple circles). f Scatter plots showing for each differential contact the relationship between the change in contact rate during differentiation (LFCES,DE) and the change in the chromatin levels of the involved caRNA (left) and in the expression of the cognate protein-coding gene (right). Differential contacts were defined as in (d). Only differential contacts involving exons of lncRNAs or UTLs are shown. g Percent of protein-coding genes targeted by one or more dynamic contact with a lncRNA (left panel), a CRE-derived RNA (middle panel), or any UTL (right panel, excluding tRNA- and snRNA-derived NARs). Protein-coding genes are grouped (x-axis) according to whether their expression is upregulated in ES, DE, or stable during differentiation as measured by total RNA-seq (DEseq2, FDR 0.05, fold change threshold 3x). Colors indicate whether the protein-coding gene is targeted by a single (light colors) or several (dark colors) caRNAs with which the interaction is upregulated in ES (blue shade) or DE (yellow shade). Some genes are targeted by several caRNAs, which include both ES and DE upregulated interactions (purple). h Top two rows: Percentage of interactions upregulated in ES targeting a protein-coding gene upregulated in ES (positive association) or targeting a protein-coding gene upregulated in DE (negative association). Bottom two rows: similarly, for interactions upregulated in DE cells. i Fold enrichment of the fraction of positive associations in the observed interactome, compared to a randomized interactome, where the differential expression state of the target genes is shuffled. All 54,642 gene-gene interactions where the gene of origin was differentially expressed (p = 0.05) were used. Error bars indicate 95% confidence intervals by bootstrap (10,000 bootstrap). Error bars not overlapping with x-axis indicate p-value < 0.05 by bootstrap.

References

    1. FANTOM Consortium and the RIKEN PMI and CLST (DGT). A promoter-level mammalian expression atlas. Nature. 2014;507:462–470. - PMC - PubMed
    1. Engreitz JM, Ollikainen N, Guttman M. Long non-coding RNAs: spatial amplifiers that control nuclear structure and gene expression. Nat. Rev. Mol. Cell Biol. 2016;17:756–770. - PubMed
    1. Statello L, Guo C-J, Chen L-L, Huarte M. Gene regulation by long non-coding RNAs and its biological functions. Nat. Rev. Mol. Cell Biol. 2021;22:96–118. - PMC - PubMed
    1. Yin Y, et al. U1 snRNP regulates chromatin retention of noncoding RNAs. Nature. 2020;580:147–150. - PMC - PubMed
    1. Engreitz JM, et al. RNA-RNA interactions enable specific targeting of noncoding RNAs to nascent pre-mRNAs and chromatin sites. Cell. 2014;159:188–199. - PMC - PubMed

Publication types