

Inequity in mortality rates and potential years of life lost caused by COVID-19 in the Greater Santiago, Chile
- PMID: 37770515
- PMCID: PMC10539509
- DOI: 10.1038/s41598-023-43531-x
Inequity in mortality rates and potential years of life lost caused by COVID-19 in the Greater Santiago, Chile
Abstract
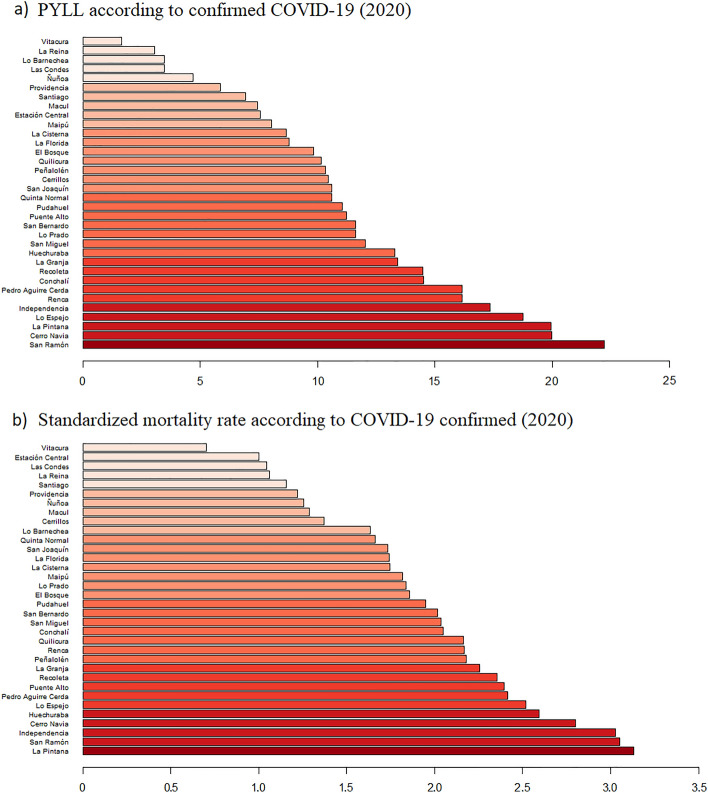
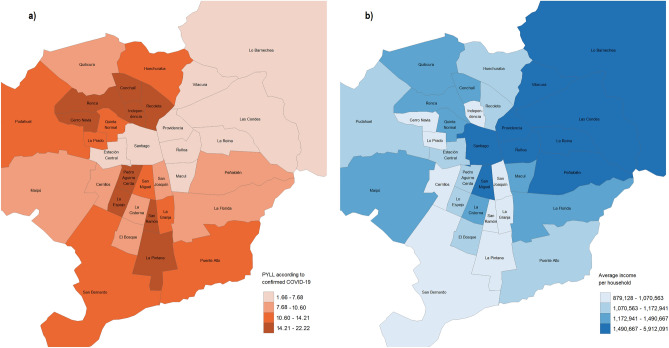
Several studies have shown that, in Chile, income inequality is relevant in explaining health inequities. The COVID-19 pandemic has also had a negative impact, with higher mortality rates in those municipalities of Greater Santiago with lower socioeconomic status. We study inequity in mortality based on Potential Years of Life Lost (PYLL) in 34 urban municipalities of the Metropolitan Region (Greater Santiago) and analyze its evolution between 2018 and 2021 and by COVID-19 waves. To compare the results obtained for PYLL, we also computed the mortality rates adjusted by direct standardization. In addition, we used the concentration index (CI) to measure the health inequalities between municipalities. In the first year of the pandemic, the absolute PYLL and the standardized mortality rate for all causes of death showed an increase of 13.6% and 18.9%, respectively. Moreover, 409,086 years of life were prematurely lost in 2020, one-fifth of them due to COVID-19. The concentration indices confirm inequality in both mortality rates and PYLL, where it is more pronounced when calculating the latter measure. Results show that the deaths due to the COVID-19 pandemic affected the most economically disadvantaged municipalities, and particularly young people in those places.
© 2023. The Author(s).
Conflict of interest statement
The authors declare no competing interests.
Figures
Similar articles
-
Inequities in mortality and potential years of life lost (PYLL) in greater Santiago, Chile, during and after the COVID-19 pandemic.Int J Equity Health. 2025 Jul 10;24(1):201. doi: 10.1186/s12939-025-02575-3. Int J Equity Health. 2025. PMID: 40640858 Free PMC article.
-
Socioeconomic status determines COVID-19 incidence and related mortality in Santiago, Chile.Science. 2021 May 28;372(6545):eabg5298. doi: 10.1126/science.abg5298. Epub 2021 Apr 27. Science. 2021. PMID: 33906968 Free PMC article.
-
Excess Mortality during the COVID-19 Pandemic in Cities of Chile: Magnitude, Inequalities, and Urban Determinants.J Urban Health. 2022 Oct;99(5):922-935. doi: 10.1007/s11524-022-00658-y. Epub 2022 Jun 10. J Urban Health. 2022. PMID: 35688966 Free PMC article.
-
Unequal impact of the COVID-19 pandemic in 2020 on life expectancy across urban areas in Chile: a cross-sectional demographic study.BMJ Open. 2022 Aug 19;12(8):e059201. doi: 10.1136/bmjopen-2021-059201. BMJ Open. 2022. PMID: 35985781 Free PMC article.
-
COVID-19 Pandemic and Health and Social Inequalities Worldwide: Impact and Response Measures in Greece.Adv Exp Med Biol. 2023;1425:393-399. doi: 10.1007/978-3-031-31986-0_38. Adv Exp Med Biol. 2023. PMID: 37581813 Review.
Cited by
-
Final assessment of the COVID-19 pandemic impact between the different social and economic strata population of the city of Buenos Aires.Public Health Pract (Oxf). 2024 May 23;8:100511. doi: 10.1016/j.puhip.2024.100511. eCollection 2024 Dec. Public Health Pract (Oxf). 2024. PMID: 38881907 Free PMC article.
-
Estimating the prevalence of persistent symptoms after SARS-CoV-2 infection (post-COVID-19 syndrome): a regional cross-sectional study protocol.BMJ Open. 2025 May 30;15(5):e093844. doi: 10.1136/bmjopen-2024-093844. BMJ Open. 2025. PMID: 40447416 Free PMC article.
-
Inequities in mortality and potential years of life lost (PYLL) in greater Santiago, Chile, during and after the COVID-19 pandemic.Int J Equity Health. 2025 Jul 10;24(1):201. doi: 10.1186/s12939-025-02575-3. Int J Equity Health. 2025. PMID: 40640858 Free PMC article.
-
Early mutational signatures and transmissibility of SARS-CoV-2 Gamma and Lambda variants in Chile.Sci Rep. 2024 Jul 11;14(1):16000. doi: 10.1038/s41598-024-66885-2. Sci Rep. 2024. PMID: 38987406 Free PMC article.
References
-
- Ministerio de Salud, Gobierno de Chile. COVID-19 en Chile Pandemia 2020–2022. https://www.minsal.cl/wp-content/uploads/2022/03/2022.03.03_LIBRO-COVID-.... Accessed 16 Nov 2022 (2022).
-
- División de Organizaciones Sociales, Ministerio Secretaría General de Gobierno. Atención! Ministerio de Salud Anunció el Fin de la Mascarilla y Pase de Movilidad a Contar del 1 de Octubre. https://dos.gob.cl/atencion-ministerio-de-salud-anuncio-el-fin-de-la-mas.... Accessed 16 Nov 2022 (2022).
-
- Gobierno de Chile. Cifras Oficiales COVID-19. https://www.gob.cl/pasoapaso/cifrasoficiales/. Accessed 27 Nov 2022 (2021).
Publication types
MeSH terms
LinkOut - more resources
Full Text Sources
Medical
