. 2023 Oct;25(10):1453-1464.
doi: 10.1038/s41556-023-01238-1. Epub 2023 Sep 28.

Curved adhesions mediate cell attachment to soft matrix fibres in three dimensions

Affiliations

Curved adhesions mediate cell attachment to soft matrix fibres in three dimensions

Wei Zhang et al. Nat Cell Biol. 2023 Oct.

Abstract

Integrin-mediated focal adhesions are the primary architectures that transmit forces between the extracellular matrix (ECM) and the actin cytoskeleton. Although focal adhesions are abundant on rigid and flat substrates that support high mechanical tensions, they are sparse in soft three-dimensional (3D) environments. Here we report curvature-dependent integrin-mediated adhesions called curved adhesions. Their formation is regulated by the membrane curvatures imposed by the topography of ECM protein fibres. Curved adhesions are mediated by integrin ɑvβ5 and are molecularly distinct from focal adhesions and clathrin lattices. The molecular mechanism involves a previously unknown interaction between integrin β5 and a curvature-sensing protein, FCHo2. We find that curved adhesions are prevalent in physiological conditions, and disruption of curved adhesions inhibits the migration of some cancer cell lines in 3D fibre matrices. These findings provide a mechanism for cell anchorage to natural protein fibres and suggest that curved adhesions may serve as a potential therapeutic target.


Conflict of interest statement

The authors declare no competing interests.

Figures
Fig. 1
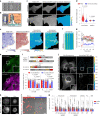
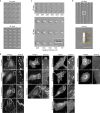
Fig. 1. Positive membrane curvature induces selective accumulation of integrin β5.
a, SEM image of nanobars viewed at a 45° angle. Scale bar, 5 µm. b, Single nanobar viewed at a 45° angle (top) and from the top (bottom). Scale bar, 1 µm. c, SEM image showing cell membrane deformation on nanobars. Scale bar, 5 µm (full size) or 1 µm (inset). d, Chart showing the integrin β-subunits probed in this study, with their respective ɑ-subunits and ECM ligands. e, Left: schematic of an ECM ligand-coated surface. Right: bright-field and fluorescence images of nanobars coated with Atto647–gelatin. Scale bar, 5 µm. GA, glutaraldehyde. f, Anti-ITGβ1 on gelatin-coated nanobar substrate does not show accumulation at nanobars visualized by a membrane marker RFP–CaaX transiently expressed in some cells. Scale bar, 10 µm (full size) or 5 µm (insets). Arrowheads indicate nanobar ends. g, Anti-ITGβ5 on vitronectin-coated nanobar substrate shows preferential accumulation at the nanobar ends (arrowheads), whereas RFP–CaaX is relatively evenly distributed along the same nanobars. Scale bar, 10 µm (full size) or 5 µm (insets). h, Fluorescence images of GFP-tagged β3, β4, β5, β6 and β8 integrins co-expressed with RFP–CaaX on nanobar substrates with their respective ECM protein coatings. Only ITGβ5–GFP shows preferential accumulation at nanobar ends (arrowheads). Scale bar, 10 µm (full size) or 5 µm (insets). More images are included in Extended Data Fig. 2a. i, Quantifications of curvature preferences of integrin β-subunits by measuring their nanobar end/side ratios, normalized by the end/side ratios of RFP–CaaX at the same nanobars. Each data point represents the mean value from a single cell having between 26 and 158 nanobars (see source data for Fig. 1). n = 12 cells, pooled from 2 independent experiments per condition. j, Probing the curvature range that induces ITGβ5 accumulation using gradient nanobar arrays. First row: bright-field (BF) image of gradient nanobars. Second row: fluorescence image of gradient nanobars coated with Cy3–vitronectin (Vn). Third and fourth rows: anti-ITGβ5 in cells expressing GFP–CaaX on vitronectin-coated gradient nanobars. Arrowheads indicate nanobar ends. Scale bar, 10 µm. k, Quantification of the end/side ratio of ITGβ5/CaaX on gradient nanobars. n = 8 images for each condition, from 2 independent experiments. P values calculated using one-way ANOVA with Bonferroni’s multiple comparison. Data are the mean ± s.d. Source numerical data are available in the source data. Source data
Fig. 2
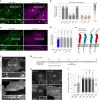
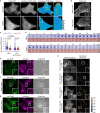
Fig. 2. Curved adhesions recruit talin-1 and bear low mechanical forces.
a, An SEM image of nanopillars. Scale bar, 1 µm. b, Left: zoom-in on a single nanopillar in a. Scale bar, 1 µm. Right: Schematic of integrin adhesion at a nanopillar. c, Fluorescence images showing that vitronectin-coated but not gelatin-coated nanopillars induce ITGβ5–GFP accumulation relative to RFP–CaaX. Ratiometric images are shown in the Parula colour scale. Scale bar, 10 µm. d, Quantifications of the normalized ITGβ5/CaaX ratio at individual nanopillars and their flat surrounding regions. Left to right, n = 926, 926, 863 and 863 pillars, from 3 independent cells. Medians (lines) and quartiles (dotted lines) are shown. e, Live-cell imaging of ITGβ5–GFP with CellMask membrane marker on vitronectin-coated nanopillars at 15 s per frame for 80 min. Ratiometric images at 0 min and 80 min are shown. Scale bar, 10 µm. f, Kymograph of the rectangular box in e. Scale bar, 1 µm. g, Example trajectories of ITGβ5 nanopillar accumulations showing that most curved adhesions persist, with a few that slowly assemble (pillar 1) or disassemble (pillar 2). h, On vitronectin-coated substrates, endogenous ITGβ5 and talin-1 colocalize in both curved adhesions at nanopillars (arrows) and focal adhesions between nanopillars on flat areas (arrowheads). Scale bar, 10 µm (full size) or 5 µm (insets). i, Top: schematic of talin-1 tension sensors. mCh, mCherry. Bottom: quantification of the normalized average FRET ratio (in arbitrary units (a.u.)) at focal adhesions and curved adhesions. Left to right, n = 13, 12, 10, 10, 15 and 11 cells, from 2 independent experiments. j, Fluorescence (YPet) and ratiometric FRET images (in the Parula colour scale) of the low-force FL-TSM sensor and the high-force HPst-TSM sensor. In the zoom-in window of the HPst-TSM sensor, curved adhesions exhibit higher FRET values, and thus lower tensions, than focal adhesions. Scale bar, 10 µm (full size) or 5 µm (insets). k, ITGβ5 accumulates at vitronectin-coated nanopillars within 30 min after seeding. Scale bar, 10 µm. l, Early-stage cell spreading (30 min after plating) on vitronectin-coated nanopillar and flat areas in the same image. Scale bar, 50 µm. m, Quantification of the cell spreading area. n are as follows (left to right): n = 69, 68, 79, 53, 45 and 48 (vitronectin) and n = 76, 64, 57, 55, 45 and 42 (fibronectin) cells, from 3 independent experiments; n = 38 and 44 (gelatin), n = 35 and 38 (PLL) and n = 42 and 34 (BSA) cells, from 2 independent experiments. Data are the mean ± s.d. (i,m). P values calculated using Kruskal–Wallis test with Dunn’s multiple comparison (d,m (vitronectin, fibronectin)), one-way ANOVA with Tukey’s multiple comparison (i), Mann–Whitney test (m, gelatin) or two-tailed t-test (m, PLL, BSA). Source numerical data are available in the source data. Source data
Fig. 3
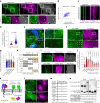
Fig. 3. Curved adhesions involve a subset of adhesion proteins and require the juxtamembrane region of ITGβ5 cytoplasmic tail.
a, Vinculin colocalizes with ITGβ5 in focal adhesions (arrowheads) on flat areas but is absent from curved adhesions (arrows) at nanopillars. Scale bar, 10 µm (full size) or 5 µm (insets). b, Spearman’s correlation coefficients between ITGβ5 and focal adhesion proteins (grey bars) or between ITGβ5 and clathrin-mediated endocytic proteins (orange bars) at nanopillars. Each cell covers between 102 and 769 nanopillars (see source data for Fig. 3). n = 12 cells, pooled from 2 independent experiments per condition. c, Both ITGβ5 and AP2-ɑ preferentially localize at nanopillars but their intensities are not correlated. Zoom-in images show that nanopillars with high AP2 intensities often have lower ITGβ5 intensities. Scale bar, 10 µm (full size) or 5 µm (insets). d, Quantification of ITGβ5 accumulation in curved adhesions (end/side ratio at nanobars) following shRNA knockdown of different endocytic proteins. Left to right, n = 17, 15, 12, 14 and 15 cells, from 2 independent experiments. e, Illustration of the construction of chimeric Exβ5/Inβ3 and Exβ3/Inβ5 proteins. f, Exβ5/Inβ3 forms prominent focal adhesions but does not accumulate at the ends of nanobars, whereas Exβ3/Inβ5 shows curvature preference for nanobar ends. Scale bar, 10 µm (full size) or 5 µm (insets). g, Sequence of the ITGβ5 cytoplasmic domain and the truncation sites. h, Fluorescence images of GFP-tagged ITGβ5 truncations β5(1–779), β5(1–769), β5(1–759) and β5(1–749) on vitronectin-coated nanobars. All truncations, except β5(1–749), show curvature preference for nanobar ends. Scale bar, 10 µm (full size) or 1 µm (insets). i, Quantification of the curvature preferences of chimeric, wild-type (WT) and truncated ITGβ5 by measuring their nanobar end/side ratio. Left to right, n = 19, 14, 15, 12, 14, 15 and 18 cells, from 2 independent experiments. Data are the mean ± s.d. P values calculated using one-way ANOVA with Bonferroni’s multiple-comparison (d,i, WT versus truncations) or two-tailed t-test (i, Exβ5/Inβ3 versus Exβ3/Inβ5). Source numerical data are available in the source data. Source data
Fig. 4
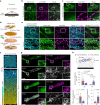
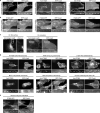
Fig. 4. Curved adhesions require a curvature-sensing protein, FCHo2.
a, RFP–FCHo2 positively correlates with ITGβ5–GFP in curved adhesions (arrows) at vitronectin-coated nanopillars. In the same image, FCHo2 is absent in focal adhesions (arrowheads) and clathrin-containing adhesions (thin arrows). Scale bar, 10 µm (full size) or 5 µm (insets). b, Scatter plot of RFP–FCHo2 intensity against the ITGβ5/membrane ratio at n = 353 nanopillars from the cell shown in a. See g for the correlation between ITGβ5 and FCHo2 at nanopillars, analysed in multiple cells. c, Kymographs of ITGβ5–GFP and RFP–FCHo2 at vitronectin-coated nanopillars imaged at 15 s per frame for 20 min. Scale bar, 1 µm. d, The temporal standard deviations of RFP–FCHo2 for 20 min at n = 104 high β5 and 313 low β5 nanopillars, from 2 independent cells. For each cell, nanopillars were divided into two groups based on ITGβ5 intensities: high-β5 nanopillars (top 25%) and low-β5 nanopillars (bottom 75%). Standard deviation values are normalized to the initial intensities. Medians (lines) and quartiles (dotted lines) are shown. e, FCHo2 knockdown significantly reduces nanopillar-induced ITGβ5 accumulation. BFP expression is a marker of shRNA transfection. Scale bar, 10 µm (full size) or 5 µm (insets). f, ITGβ5 does not colocalize with FCHo1 at nanopillars. Scale bar, 10 µm (full size) or 5 µm (insets). g, Quantification showing that FCHo2 knockdown significantly reduces nanopillar-induced ITGβ5 accumulation, but FCHo1 knockdown cannot. Left to right, n = 68, 43, 44 and 30 cells, from 2 independent experiments. h, Illustration of FCHo2 domain organization and truncations. i, Representative images showing that FCHo2_ΔIDR correlates with ITGβ5 in curved adhesions at nanopillars, but FCHo2_F-BAR does not. FCHo2_F-BAR overexpression also reduces ITGβ5 accumulation at nanopillars. Scale bar, 10 µm. j, Spearman’s correlation coefficients of FCHo1, FCHo2 and truncated FCHo2 with ITGβ5 at vitronectin-coated nanopillars. Left to right, n = 17, 48, 29, 29, 31, 22, 20 and 17 cells, from 2 independent experiments. k, Illustration of the engineered proteins GFP–β5(715–769) and GFP–β5TM, and the cytosolic protein FCHo2_µHD–RFP. l, Top: FCHo2_µHD-RFP is cytosolic and diffusive when co-expressed with GFP–β5TM. Bottom: when co-expressed with GFP–β5(715–769), FCHo2_µHD–RFP colocalizes with GFP–β5(715–769) in the perinuclear Golgi region. Scale bar, 10 µm. m, Qualitative analysis of GFP–β5(715–769)-induced membrane re-localization of FCHo2 variants. n, Immunoblots of co-immunoprecipitation assay confirms the interaction between the ITGβ5 juxtamembrane region and FCHo2_µHD. Data are the mean ± s.d. (g,j). P values calculated using Mann–Whitney test (d) or one-way ANOVA with Bonferroni’s multiple comparison (g,j). Source numerical data and unprocessed blots are available in the source data. Source data
Fig. 5
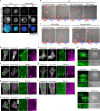
Fig. 5. Curved adhesions are prevalent in physiologically relevant environments.
a, Schematic of a cell growing on ECM-coated 2D flat surfaces. b, ITGβ5 and vinculin strongly colocalize on vitronectin-coated flat surfaces. Scale bar, 10 µm (full size) or 5 µm (insets). c, ITGβ5 and FCHo2 do not colocalize on vitronectin-coated flat surfaces. Scale bar, 10 µm (full size) or 5 µm (insets). d, Schematic illustrating the generation of cell-derived ECM fibres. e, IMR-90-derived ECM fibres have vitronectin incorporated as shown by anti-vitronectin staining. U2OS cells form both curved adhesions (arrows, colocalization of anti-ITGB5 with FCHo2–GFP) and focal adhesions (arrowheads, anti-ITGB5 devoid of FCHo2–GFP) on these fibres. Scale bar, 10 µm. f, Representative 3D images of a thick layer of matrices made of vitronectin fibres. Scale bar, 10 µm. g, Curved adhesions, marked by the colocalizations of ITGβ5 and FCHo2, are abundant on vitronectin fibres in 3D matrices (top), whereas focal adhesions marked by the colocalization of ITGβ5 and vinculin are sparse (bottom). Scale bar, 10 µm (full size) or 1 µm (insets). h, Quantification of the number and size of focal adhesions and curved adhesions on 2D flat surfaces and in 3D matrices of vitronectin fibres. Left to right, n = 19, 18, 12 and 9 cells, from 2 independent experiments. Data are the mean ± s.d. P values calculated using two-tailed t-test (h, adhesion size) or Kruskal–Wallis test with Dunn’s multiple-comparison (h, adhesion number). Source numerical data are available in the source data. Source data
Fig. 6
Fig. 6. Curved adhesions facilitate cell migration in 3D ECMs.
a, Representative images of U2OS cells expressing GFP–CaaX in 3D matrices after 72 h of culture. Cells are colour-coded according to z depth in x–y projections. Cells are coloured in green and merged with ECM in magenta in xz projections. WT cells infiltrated into matrices made of vitronectin fibres, but not matrices made of pure collagen fibres. The shRNAs of FCHo2, ITGβ5 or both, but not scramble shRNA, inhibited the cell infiltrations. Scale bar, 100 µm. b, Western blots show that shRNAs are able to effectively reduce the expression of FCHo2, ITGβ5 or both in U2OS, A549 and Hela cells. These results support the knockdown efficiencies supplied by the company (Supplementary Table 3). c, Quantification of the cell infiltration depth for U2OS, A549 and Hela cells in 3D pure collagen matrices or 3D vitronectin matrices with the knockdown of FCHo2, ITGβ5 or both. Left to right, n = 244, 509, 348, 279, 251 and 211 U2OS cells, n = 164, 134, 100, 238, 92 and 177 A549 cells and n = 142, 236, 277,189, 241 and 204 Hela cells, from 2 independent experiments. Medians (lines) and quartiles (dotted lines) are shown. P values calculated using Kruskal–Wallis test with Dunn’s multiple comparison. d, Illustration of ITGβ5 interacting with FCHo2 in curved adhesions. e, Schematic comparison of focal adhesion and curved adhesion architectures. Note that the models only depict proteins investigated in this work. Source numerical data and unprocessed blots are available in the source data. Source data
Extended Data Fig. 1
Extended Data Fig. 1. SEM characterization of nanostructures and integrin activation on ECM protein-coated substrates.
a, Representative SEM images show a 200 nm-wide vertical nanobar array. The same sample was viewed either from the top (top) or at a 45° angle (bottom). Scale: 5 µm. b, Fluorescence images of integrin β subunits on flat surfaces coated with different ECM proteins (gelatin, laminin, fibronectin or vitronectin). Endogenous β1 was immunolabelled, while β3, β4, β5, β6, and β8 were tagged with GFP and transiently expressed. Scale: full-size, 10 µm; insets, 5 µm. c, Representative SEM images of a gradient bar array with designed end curvature diameters ranging from 100 to 5000 nm. The sample was tilted 45°. Scale: 10 µm. Inset: the top view of a 100 nm-wide nanobar. Scale, 1 µm. d, Representative SEM images show a vertical nanopillar array. The sample was tilted 45°. The zoom-in image shows a single nanopillar. The top, middle, and bottom diameters of each nanopillar were measured. Scale: full-size and inset, 1 µm. Statistical analysis of the geometrical dimensions of the nanostructures (in a, c, d) is provided in Supplementary Table 1.
Extended Data Fig. 2
Extended Data Fig. 2. Positive membrane curvature induces the preferential accumulation of integrin β5 but not other integrin β isoforms.
a and b, Fluorescence images of endogenous integrin β1 (a) and transiently expressed GFP-tagged integrin β3, β6, and β8 (b) in U2OS cells expressing a plasma membrane marker RFP-CaaX on 200-nm nanobar arrays coated with different ECM proteins (fibronectin, vitronectin or laminin). All of them show no preference for the nanobar ends. Quantifications of their curvature preferences are presented in Fig. 1i. Scale: full-size, 10 µm; insets, 5 µm. c, Fluorescence images showing that anti-ɑvβ5 in U2OS cells localizes to focal adhesions on vitronectin-coated flat surfaces (left), and preferentially accumulates at the ends of vitronectin-coated nanobars in U2OS cells expressing RFP-CaaX (right). Scale: full-size, 10 µm; insets, 5 µm. d, Fluorescence images showing that anti-ITGβ5 preferentially accumulates at the ends of vitronectin-coated nanobars in HT1080, A549, U-251 MG, MCF7, HeLa, and human mesenchymal stem cells. Scale: full-size, 10 µm; insets, 5 µm. e, Fluorescence images showing that ITGβ5-GFP preferentially accumulates at the ends of vitronectin-coated nanobars in mouse embryonic fibroblasts. Scale: full-size, 10 µm; insets, 5 µm.
Extended Data Fig. 3
Extended Data Fig. 3. Integrin β5 preferentially accumulates at nanopillars in a ligand-dependent manner and recruits talin-1.
a, Fluorescence images of ITGβ5-GFP and plasma membrane marker RFP-CaaX on vitronectin-coated (top) and gelatin-coated (bottom) flat surfaces. Ratiometric images of ITGβ5/membrane (normalized by its mean per cell) are shown in the Parula colour scale. Scale: full-size, 10 µm; insets, 5 µm. b, Ethylenediaminetetraacetic acid (EDTA) treatment induces a dramatic reduction of ITGβ5-GFP accumulation at nanopillars in a live U2OS cell. Scale: full-size, 10 µm; insets, 5 µm. c, Quantification of the normalized ITGβ5/CaaX ratio at nanopillars and their surrounding flat regions. n = 994/711/994/711 nanopillars and their surrounding flat regions, from three independent cells. Medians (lines) and quartiles (dotted lines) are shown. P values calculated using paired Kruskal-Wallis test with Dunn’s multiple-comparison. d, Time-lapsed images of ITGβ5-GFP and CellMask Orange at Pillar 1 and 2 in Fig. 2e. At Pillar 1, the curved adhesion gradually assembles. At Pillar 2, the curved adhesion gradually disassembles. Scale: 1 µm. e, Fluorescence and bright-field images showing that immunolabelled ITGβ1 does not accumulate at vitronectin-coated nanopillars, while immunolabelled talin-1 does. Scale: full-size, 10 µm; insets, 5 µm. f and g, Fluorescence and bright-field images of immunolabelled talin-1 together with immunolabelled ITGβ1 (f) or ITGβ5 (g) on gelatin-coated nanopillar substrates. Talin-1 colocalizes with ITGβ1 in focal adhesions but does not accumulate at nanopillars. ITGβ5 appears mostly diffusive on gelatin-coated substrates. These results indicate that nanopillar-induced talin accumulation depends on ITGBβ5 and its ligands. Scale: full-size, 10 µm; insets, 5 µm. h, Fluorescence (YPet) and normalized ratiometric FRET images (in Parula colour scale) of the talin tension sensor N-terminal and C-terminal controls. Scale: full-size, 10 µm; insets, 5 µm. Source numerical data are available in source data. Source data
Extended Data Fig. 4
Extended Data Fig. 4. Curved adhesions promote early-stage cell spreading and involve a subset of focal adhesion proteins.
a, ITGβ5 accumulates at vitronectin-coated nanopillars within 30 min after seeding. Cells spread to a larger area on nanopillars compared to on flat areas on the same substrate. Knockdown of ITGβ5 with shRNAs largely abolished the nanopillar-induced early cell spreading. Scale: 10 µm. b, Overlay of bright-field and fluorescence images of wild type (WT) U2OS cells stably expressing GFP-CaaX on both nanopillars and flat surfaces in the same imaging fields. The cells were seeded on substrates and cultured for 30 min before imaging. Scale: 50 µm. c, Overlay of bright-field and fluorescence images of U2OS cells transduced with ITGβ5 or scramble shRNAs and stably expressing GFP-CaaX on both nanopillar arrays and flat surfaces in the same imaging fields. The cells were seeded on substrates and cultured for 30 min before imaging. Scale: 50 µm. d to g, Fluorescence images showing that ITGβ5-GFP colocalizes with focal adhesion proteins paxillin (d), vinculin (e), pFAK (Tyr397) (f), and zyxin (g) at focal adhesion-like patches in U2OS cells on vitronectin-coated flat surfaces. Scale: full-size, 10 µm; insets, 5 µm. h to j, Representative fluorescence images showing that ITGβ5-GFP accumulation at vitronectin-coated nanopillars spatially correlates with paxillin (i) and zyxin (j), but not with pFAK (Tyr397) (h) in U2OS cells. The cell membrane was marked with transiently expressed surface SNAP-tag conjugated with AF647. The normalized ITGβ5/membrane was used to measure ITGβ5 accumulation for the correlation quantification in Fig. 3b. Scale: full-size, 10 µm; insets, 5 µm. Endogenous paxillin, vinculin, and pFAK (Tyr397) were immunolabelled. Zyxin was tagged with RFP and transiently expressed (d-j). k, Fluorescence images of cells cultured on nanobars showing that GFP-talin and zyxin-GFP preferentially accumulate at the nanobar ends. However, anti-vinculin shows no accumulation at nanobar locations. Scale: full-size, 10 µm; insets, 5 µm.
Extended Data Fig. 5
Extended Data Fig. 5. Curved adhesions are linked to a stable population of actin filaments at nanopillars.
a, On flat areas, actin stress fibres (F-actin labelled by LifeAct-RFP) are anchored to ITGβ5-marked focal adhesion patches. Scale: full-size, 10 µm; insets, 5 µm. b, On nanopillar areas, both ITGβ5 and F-actin accumulate at nanopillars. However, nanopillars with high β5 accumulations usually do not have high levels of F-actin. A previous study shows that the membrane curvature around gelatin-coated nanopillars induces actin accumulation, but the accumulation is highly dynamic with a lifetime of 1-2 minutes. As curved adhesions are stable and do not form on gelatin-coated nanopillars, we hypothesize that curved adhesions involve a different population of F-actin. Scale: full-size, 10 µm; insets, 5 µm. c, Dynamic correlation between ITGβ5-GFP and LifeAct-RFP in cells cultured on vitronectin-coated nanopillars. There are two distinct populations of the F-actin that accumulate at nanopillars: a stable population of F-actin at high-β5 nanopillars, and a dynamic population F-actin at low-β5 nanopillars. The F-actin intensity of the dynamic population is usually brighter than that of the stable population. Scale: 10 µm. d, On gelatin-coated nanopillars that do not induce β5 accumulation, only the highly dynamic population of F-actin was observed at nanopillars. Scale: 10 µm. e, Quantifications of time-dependent fluctuation confirm two F-actin populations: a stable population on high-β5 nanopillars and a dynamic population at low-β5 nanopillars. Nanopillars with the top 25% and bottom 25% ITGβ5 intensities were grouped as high-β5 and low-β5 nanopillars, respectively. The dynamic population of F-actin on vitronectin-coated nanopillars is similar to the dynamic F-actin on gelatin-coated nanopillars. Therefore, curved adhesions involve a stable subpopulation of F-actin at nanopillars. n = 103/103/153 nanopillars, from two independent cells. Medians (lines) and quartiles (dotted lines) are shown. P values calculated using Kruskal-Wallis test with Dunn’s multiple-comparison. Source numerical data are available in source data. Source data
Extended Data Fig. 6
Extended Data Fig. 6. Curved adhesions are different from clathrin lattices.
a, Expansion microscopy showing that ITGβ5 and AP2 are not spatially correlated at the nanopillar-membrane interface. Expansion microscopy is used to increase the spatial resolution of optical imaging for the nanopillar-membrane interface (see the method section and Ref. for detailed descriptions). Both ITGβ5 and AP2-α are immunolabelled. Top: x-y images of the z projection (average). Bottom: zoom-in x-y images of the area indicated by the white boxes. x-z images showing the distribution of immunolabelled ITGβ5 and AP2-α along nanopillars at y = Y1 and y = Y2 in the zoom-in images. Even when ITGβ5 and AP2-α accumulate on the same nanopillar in the x-y image, they are not correlated in the z-dimension. Scale: full-size, 10 µm; insets, 5 µm. b, Right: Both ITGβ5-GFP and immunolabelled clathrin heavy chain (CHC) accumulate at vitronectin-coated nanopillars, but their intensities are not correlated. Nanopillars with high intensities of ITGβ5-GFP are usually not the nanopillars with high intensities of anti-CHC. Left: ITGβ5-GFP accumulates at vitronectin-coated nanopillars, but the co-transfected EPS15-RFP does not show strong accumulation or correlation with ITGβ5-GFP at these nanopillars. Scale: full-size, 10 µm; insets, 5 µm. c, Representative fluorescence images showing that the shRNA knockdown of AP2-μ, clathrin heavy chain (CHC), EPS15/R, or ITSN1/2 does not affect the accumulation of ITGβ5-GFP accumulation at the ends of vitronectin-coated nanobars in U2OS cells expressing RFP-CaaX membrane marker. BFP expression is a marker of shRNA transfection. Quantifications of the β5-GFP curvature preference under these conditions are presented in Fig. 3d. Scale: full-size, 10 µm; insets, 1 µm. d, Validation of AP2 knockdown by immunofluorescence. Immunofluorescence showing that the transfection of AP2-μ shRNAs (indicated by BFP expression) can reduce the appearance of AP2 complexes and the accumulation of AP2 complex at the ends of vitronectin-coated nanobars in U2OS cells. Scale: full-size, 10 µm; insets, 5 µm.
Extended Data Fig. 7
Extended Data Fig. 7. FCHo2, but not FCHo1, is correlated with ITGβ5 in curved adhesions.
a, Left: Representative fluorescence images showing that knockdown of FCHo1/2 reduces the β5-GFP accumulation at vitronectin-coated nanobar ends. Scale: full-size, 10 µm; insets, 1 µm. Right: Quantifications of the β5-GFP curvature preference in U2OS cells transfected with scramble or FCHo1/2 shRNAs. n = 17/13 cells, from two independent experiments. Data are presented as the mean ± s.d. P values calculated using two-tailed t-test. b, Representative fluorescence images showing that compared with scramble shRNA transfection (right), shRNA knockdown of ITGβ5 (left) reduces the FCHo2-GFP accumulation at the ends of vitronectin-coated nanobars in U2OS cells. Scale: full-size, 10 µm; insets, 5 µm. c, Quantifications of the FCHo2-GFP curvature preference in wild-type, scramble shRNA-transfected, or ITGβ5-knockdown U2OS cells. n = 29/34/36 cells, from two independent experiments. Data are presented as the mean ± s.d. P values calculated using one-way ANOVA with Tukey’s multiple comparison. d, Representative fluorescence images showing that neither shRNA knockdown of FCHo1 (left) nor scramble shRNA transfection (right) affects ITGβ5 accumulation at vitronectin-coated nanopillars. Scale: full-size, 10 µm; insets, 5 µm. e, Representative fluorescence images showing that compared with scramble shRNA transfection (right), shRNA knockdown of FCHo1/2 (left) does not affect membrane wrapping around vitronectin-coated nanopillars in U2OS cells expressing GFP-CaaX membrane marker. BFP expression is a marker of shRNA transfection. Scale: full-size, 10 µm; insets, 5 µm. Source numerical data are available in source data. Source data
Extended Data Fig. 8
Extended Data Fig. 8. GFP-β5(715-769) induces dramatic redistribution of μHD-containing FCHo2 variants to the plasma membrane and the Golgi apparatus.
a, GFP-β5(715-769) is located on the plasma membrane with some accumulations around the perinuclear region that colocalizes with Golgi apparatus marker Golgi-RFP. Scale: full-size, 10 µm; insets, 5 µm. b, When co-expressed with GFP-β5(715-769), three μHD domain-containing FCHo2 variants (RFP-FCHo2, FCHo2_ΔF-BAR-RFP, and FCHo2_ΔIDR-RFP) are redistributed to the plasma membrane and colocalize with GFP-β5(715-769) in the perinuclear region. Scale: full-size, 10 µm; insets, 5 µm. c, When co-expressed with GFP-β5(715-769), three FCHo2 variants that don’t contain μHD domain (FCHo2_ΔµHD-RFP, FCHo2_F-BAR-RFP and FCHo2_IDR-RFP) are highly diffusive in the cytosol. d, When co-expressed with the negative control GFP-β5TM, RFP-FCHo2 shows cytosolic diffusive pattern with small puncta (left) and FCHo2_µHD is highly cytosolic (right and in Fig. 4l). Scale: full-size, 10 µm; insets, 5 µm.
Extended Data Fig. 9
Extended Data Fig. 9. Cell plasma membranes are deformed by 3D ECM fibres.
a, Anti-vitronectin staining illustrates the fibre morphology of IMR-90 lung fibroblast-derived ECM. Z-depth is colour-coded. Scale: 10 µm. b, In 3D ECM made of vitronectin fibres, colocalization of AF647-collagen with immunolabelled vitronectin confirmed the incorporation of vitronectin in ECMs. Scale: full-size, 50 µm; insets, 25 µm. c, 3D super-resolution reconstruction of AF647-labelled collagen fibres. Top left: the widefield diffraction-limited image. Right: the z projection of the 3D super-resolution reconstruction. Yellow arrows point to some individual collagen fibres. Colour encodes the z position. Scale: 5 µm. d, Extracting the diameter of individual fibres. (i) The image shows an example of a resolved individual fibre. Transverse line profiles are taken across the fibre to estimate its diameter. (ii) Localizations from the line profile are binned into a histogram which is then fit to a Gaussian function (orange line). The full width at half maximum is extracted to estimate the diameter. Scale: 1 µm. e, Top and side views (3D projection) of a thick 3D ECM made of AF647-labelled pure collagen fibres. Z depth is colour coded. Scale: 10 µm. f, Representative 3D images (x-z projection) of U2OS cells expressing GFP-CaaX, 72 hrs after being plated on the top of a matrix made of pure collagen fibres (left) or vitronectin fibres (right). Scale: 10 µm. g, x-y image (Z0 plane) and x-z image (Y0 plane) of z-stack images showing the U2OS cells expressing GFP-CaaX in vitronectin fibres, presented in f (right side). Scale: 10 µm. h, Zoom-in x-y images of the area indicated in g showing plasma membrane folding along vitronectin fibres at the middle (z = Z0), bottom (z = Z1), and top (z = Z2) of cells. This result suggests that cell plasma membranes are deformed by 3D ECM fibres. Scale: 10 µm.
Extended Data Fig. 10
Extended Data Fig. 10. Curved adhesions in 3D ECMs facilitate cell migration in 3D ECMs.
a, x-y view (Z0 plane) and x-z view (Y0 plane) of z-stack images of immunolabelled ITGβ5 in U2OS cells expressing FCHo2-GFP. The cells are embedded in 3D ECM made of vitronectin fibres labelled with AF647-collagen. Zoom-in x-y images of the yellow-box area show abundant curved adhesions indicated by the colocalization of FCHo2 and ITGβ5. Curved adhesions form along vitronectin fibres at the middle (Z0 plane), bottom (Z1 plane), and top (Z2 plane) of cells. A zoom-in of the x-y slide at the Z0 plane has been shown in Fig. 5g (top). Scale: 10 µm. b, x-y view (Z0 plane) and x-z view (Y0 plane) of z-stack images of immunolabelled vinculin and ITGβ5 in U2OS. The cells are embedded in 3D ECM made of vitronectin fibres labelled with AF647-collagen. Zoom-in x-y images of the yellow-box area do not show clear focal adhesions indicated by the colocalization of vinculin and ITGβ5. Examination of different imaging planes, the middle (Z0 plane), bottom (Z1 plane), and top (Z2 plane) of cells, shows that the colocalization of vinculin and ITGβ5 is sparse. A zoom-in of the x-y slide at the Z0 plane has been shown in Fig. 5g (bottom). Scale: 10 µm. c, Representative 3D images of A549 cells (top) and HeLa cells (bottom) in 3D matrices after 72-hr culture. Cells were transduced to express GFP-CaaX via lentiviral infection. In the x-y projections, cells are colour-coded according to the z depth. In the x-z projections, cells are coloured in green and merged with the ECM (magenta). Cells can infiltrate into 3D matrices of vitronectin fibres, but not into 3D matrices of pure collagen fibres. The shRNA knockdown of FCHo2, ITGβ5, or both significantly inhibit cell infiltrations into 3D ECMs. Scale: 100 µm.

Update of

Similar articles

Cited by

References

    1. Geiger B, Spatz JP, Bershadsky AD. Environmental sensing through focal adhesions. Nat. Rev. Mol. Cell Biol. 2009;10:21–33. doi: 10.1038/nrm2593. - DOI - PubMed
    1. Kechagia JZ, Ivaska J, Roca-Cusachs P. Integrins as biomechanical sensors of the microenvironment. Nat. Rev. Mol. Cell Biol. 2019;20:457–473. doi: 10.1038/s41580-019-0134-2. - DOI - PubMed
    1. Moser M, Legate KR, Zent R, Fässler R. The tail of integrins, talin, and kindlins. Science. 2009;324:895–899. doi: 10.1126/science.1163865. - DOI - PubMed
    1. Klapholz B, Brown NH. Talin—the master of integrin adhesions. J. Cell Sci. 2017;130:2435–2446. - PubMed
    1. Sun Z, Costell M, Fässler R. Integrin activation by talin, kindlin and mechanical forces. Nat. Cell Biol. 2019;21:25–31. doi: 10.1038/s41556-018-0234-9. - DOI - PubMed

Publication types

MeSH terms