. 2023 Nov;25(11):1575-1589.
doi: 10.1038/s41556-023-01244-3. Epub 2023 Sep 28.

Regulators of mitonuclear balance link mitochondrial metabolism to mtDNA expression

Affiliations

Regulators of mitonuclear balance link mitochondrial metabolism to mtDNA expression

Nicholas J Kramer et al. Nat Cell Biol. 2023 Nov.

Abstract

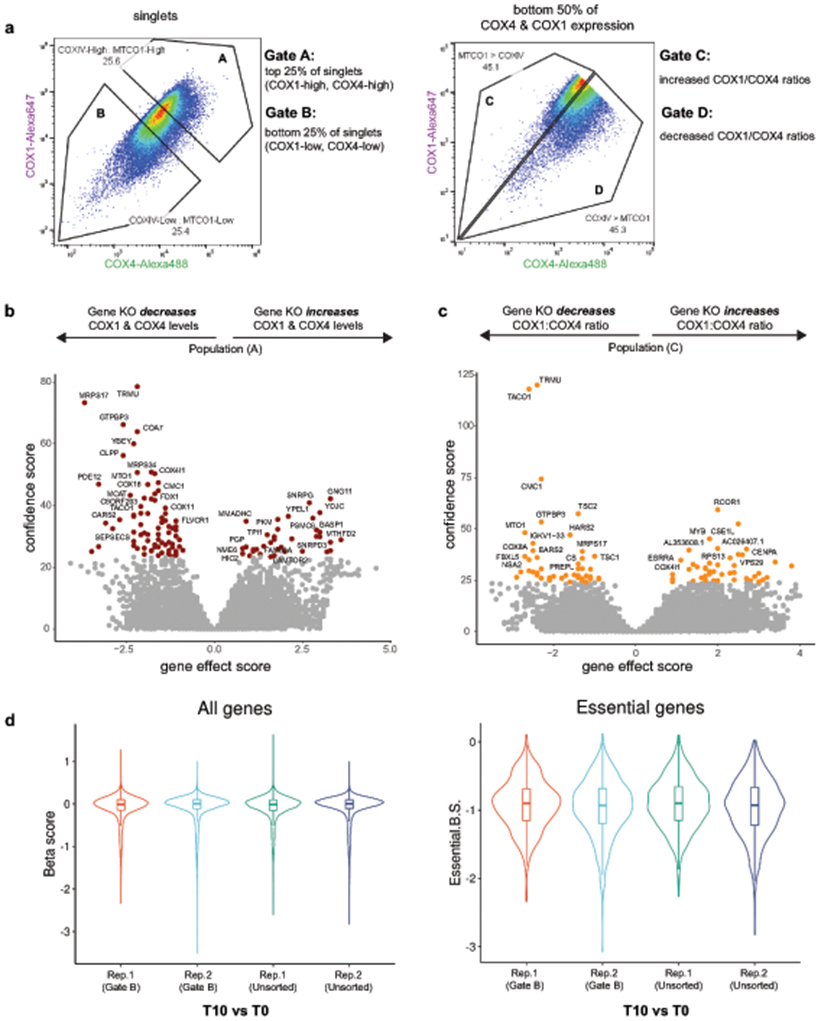
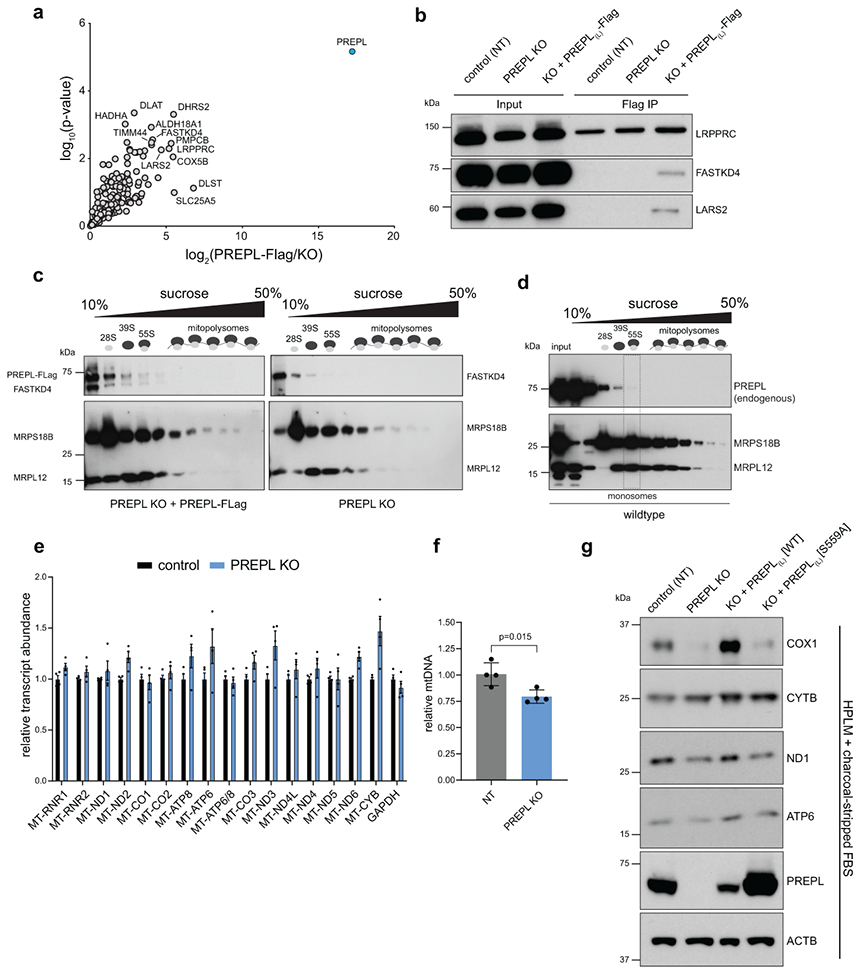
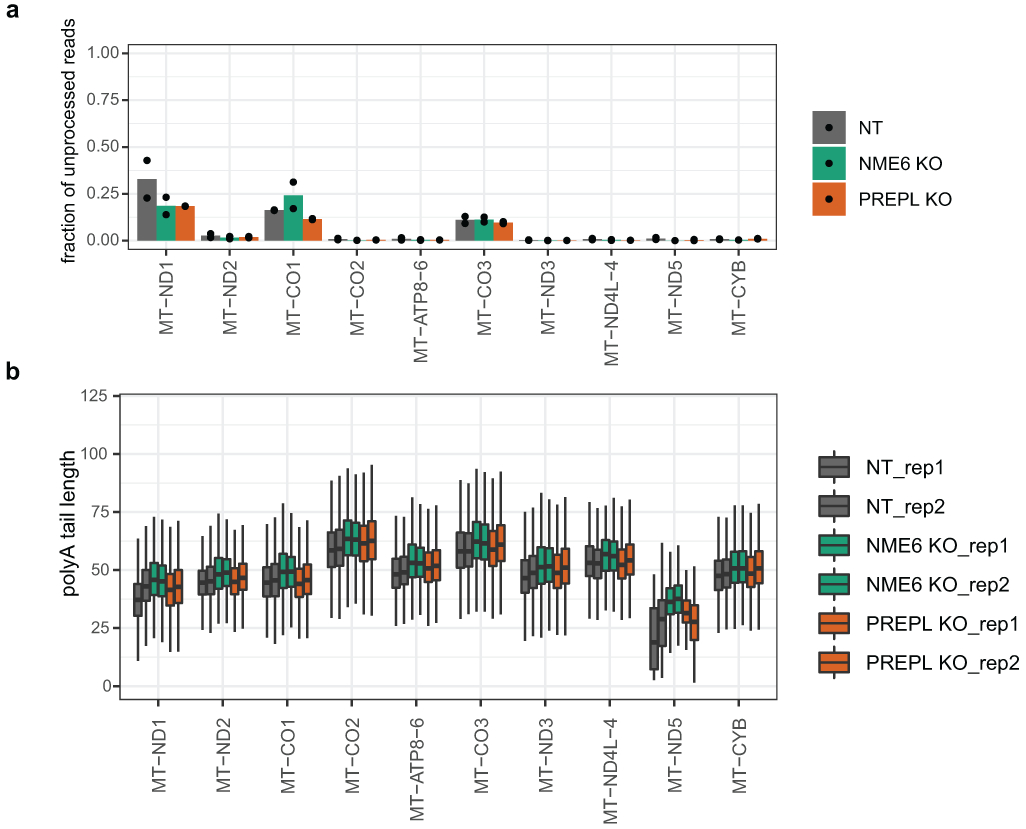
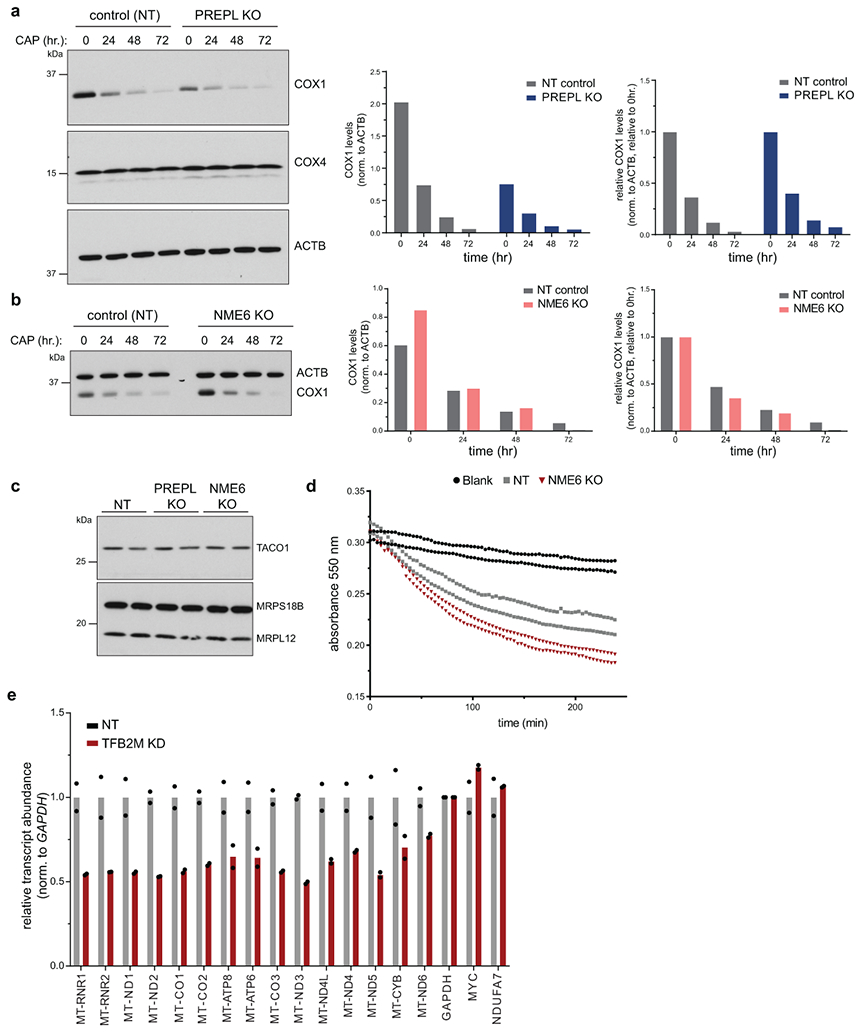
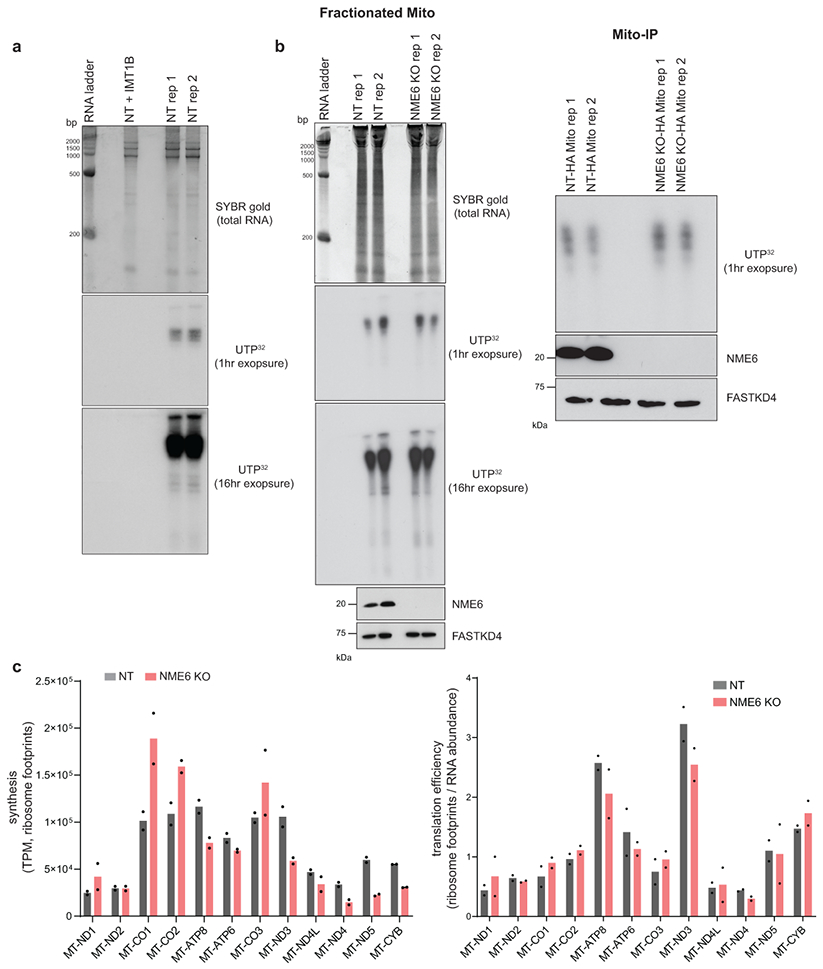
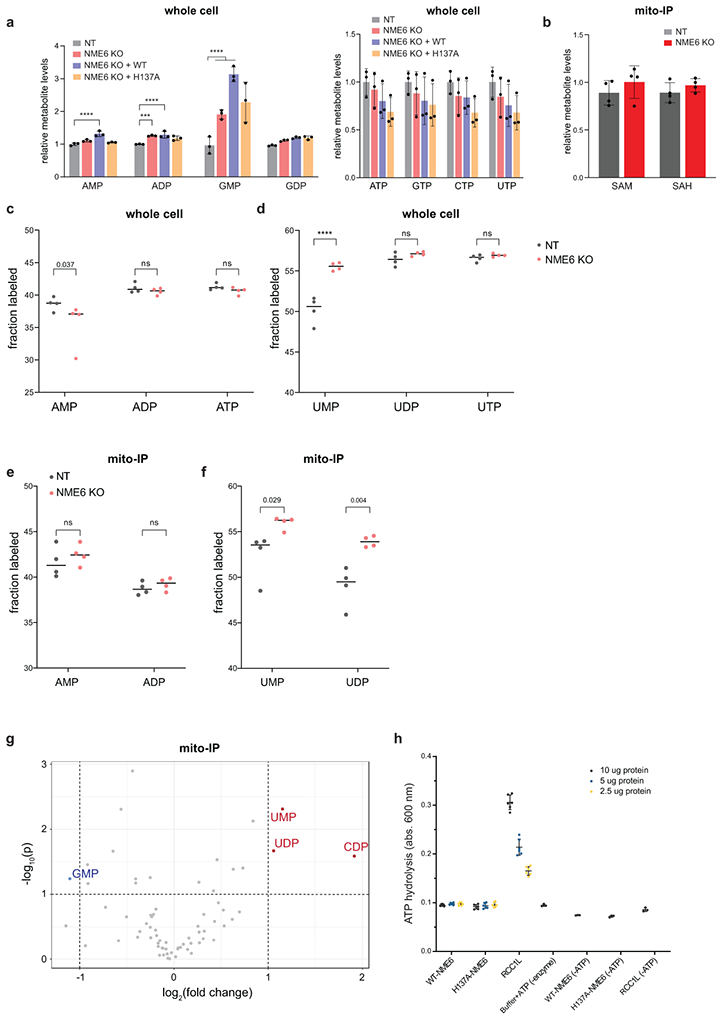
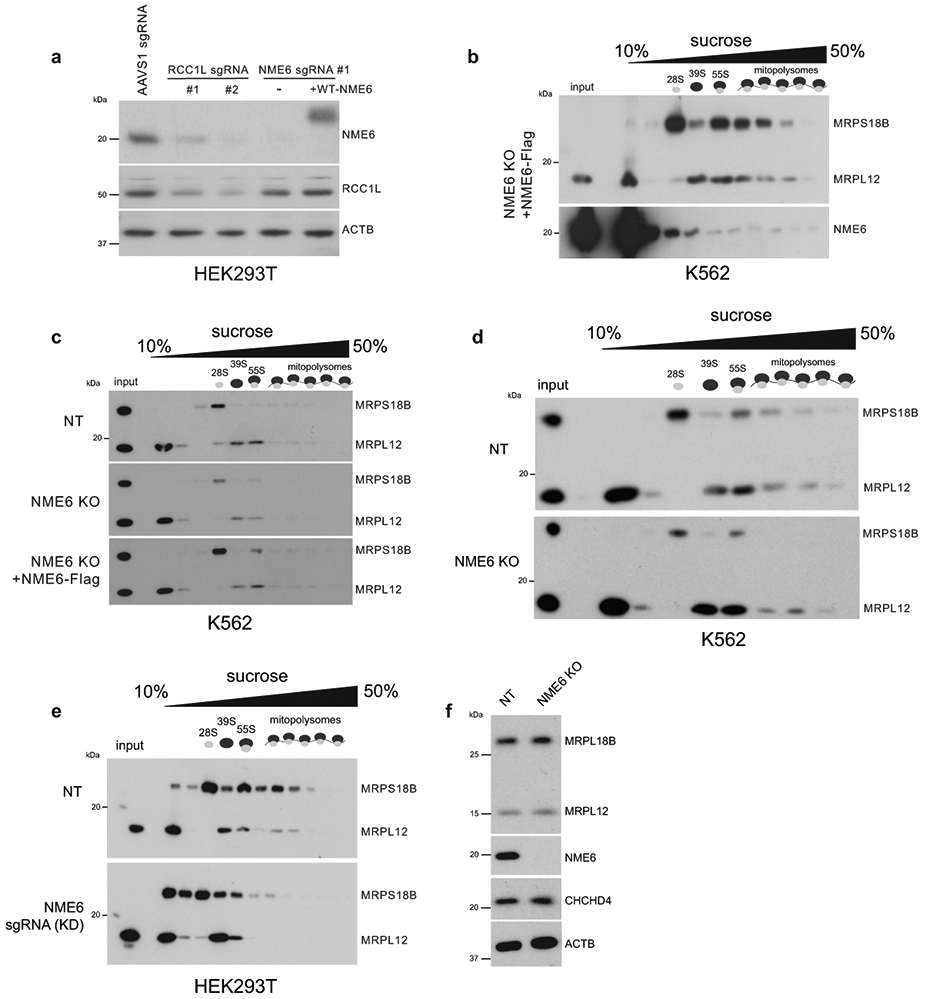
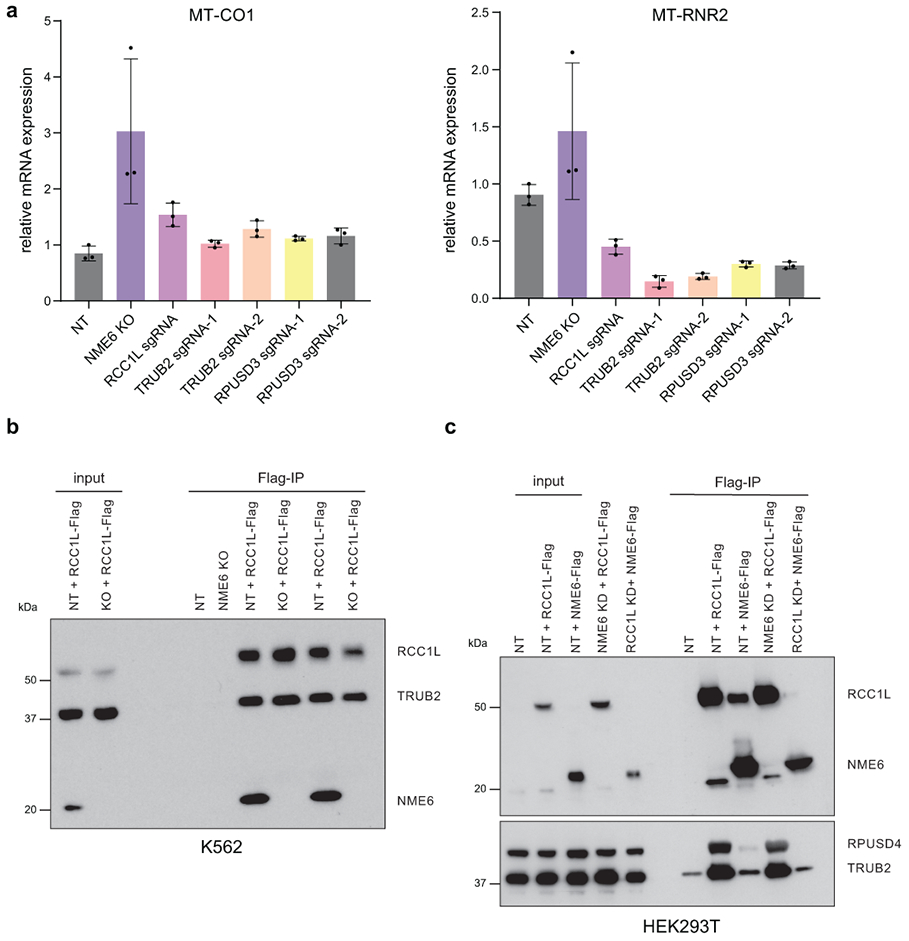
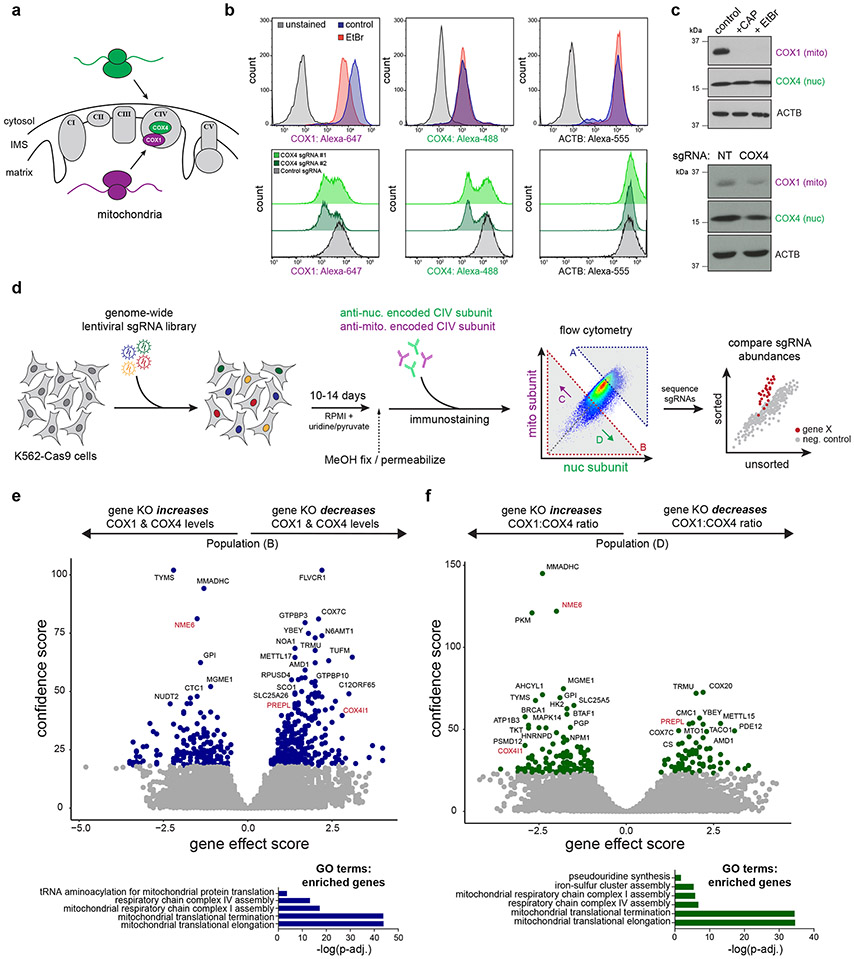
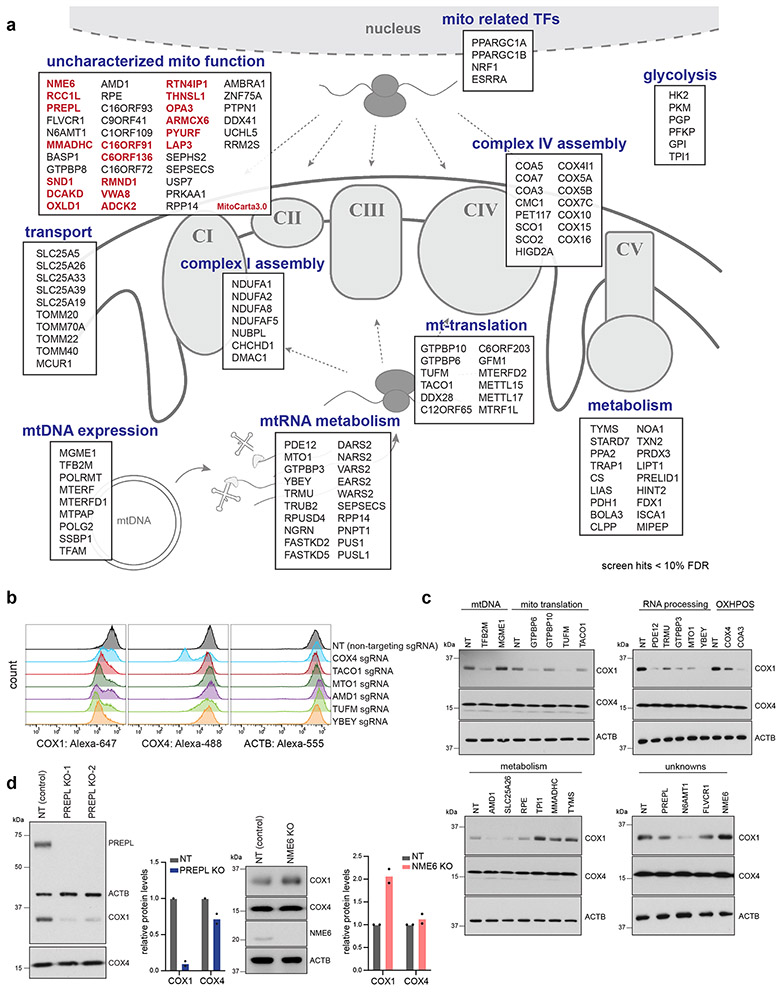
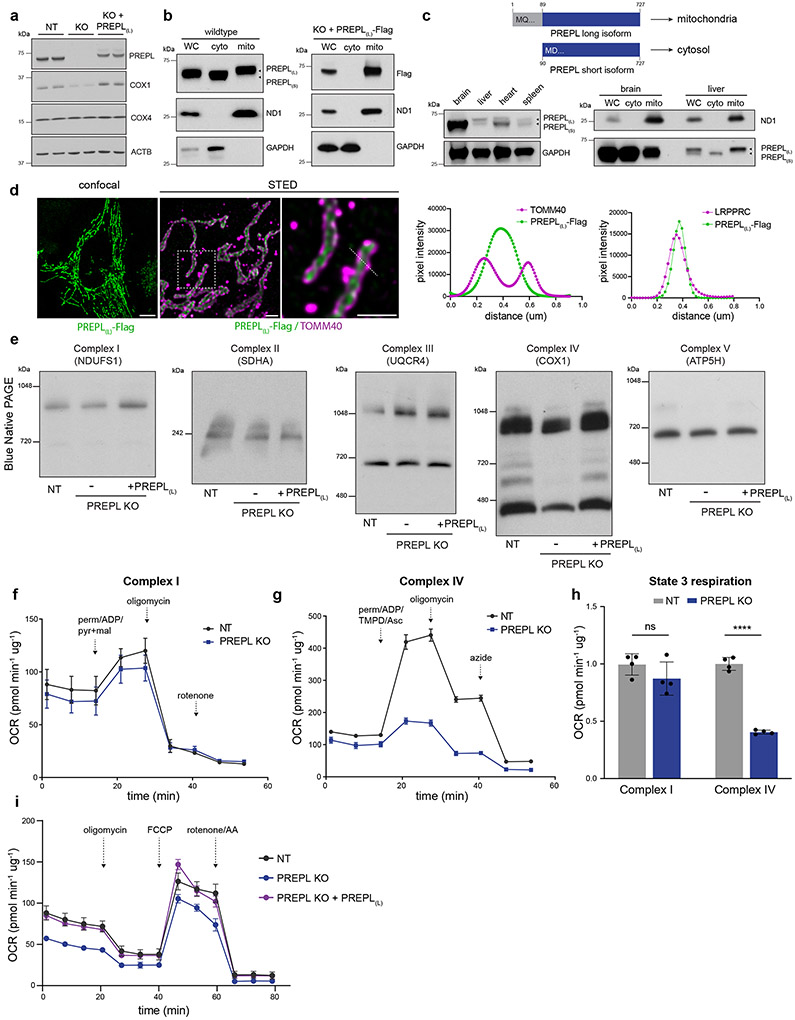
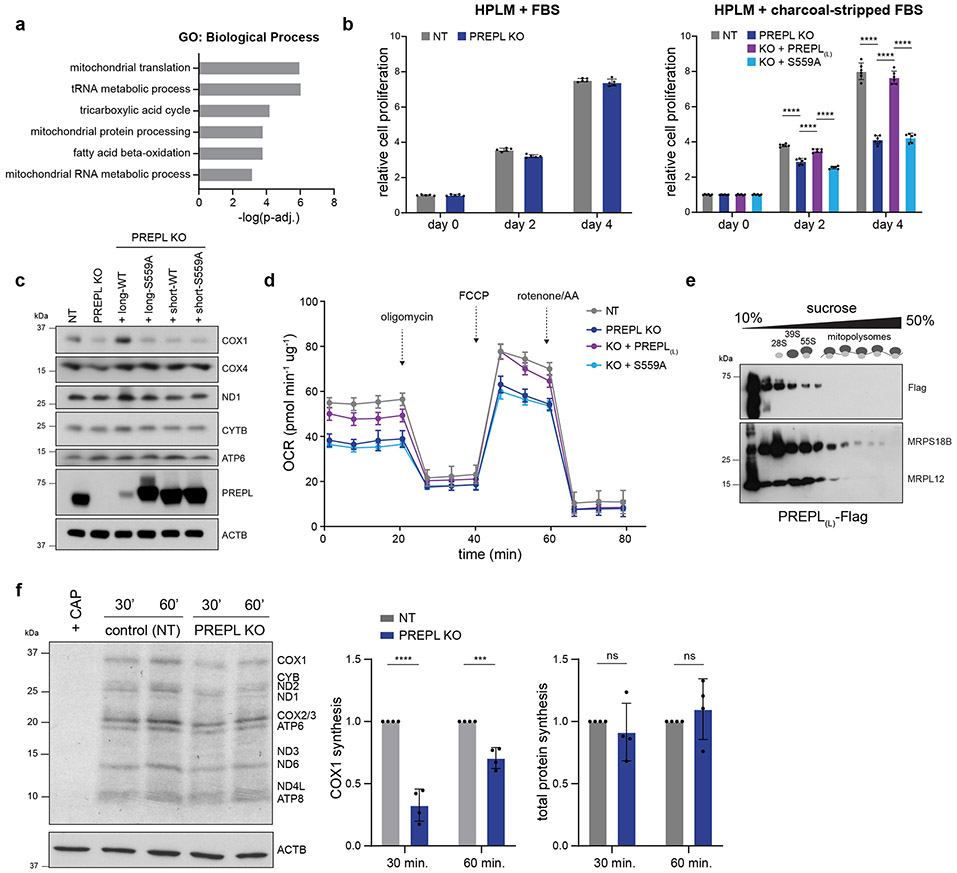
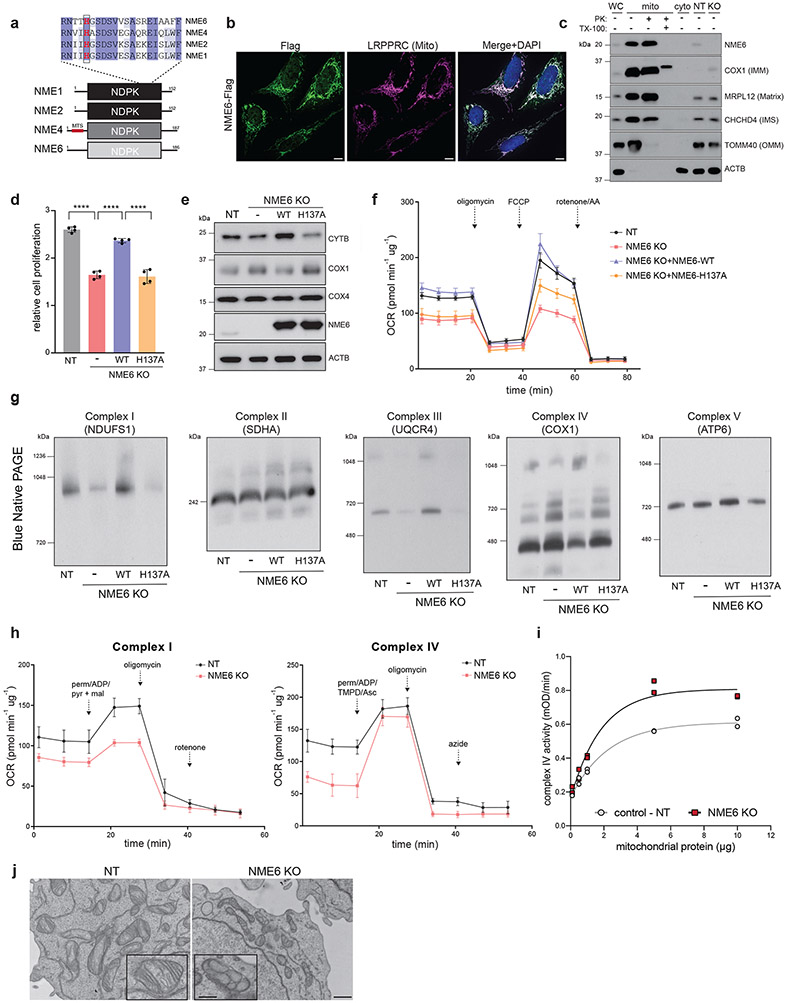
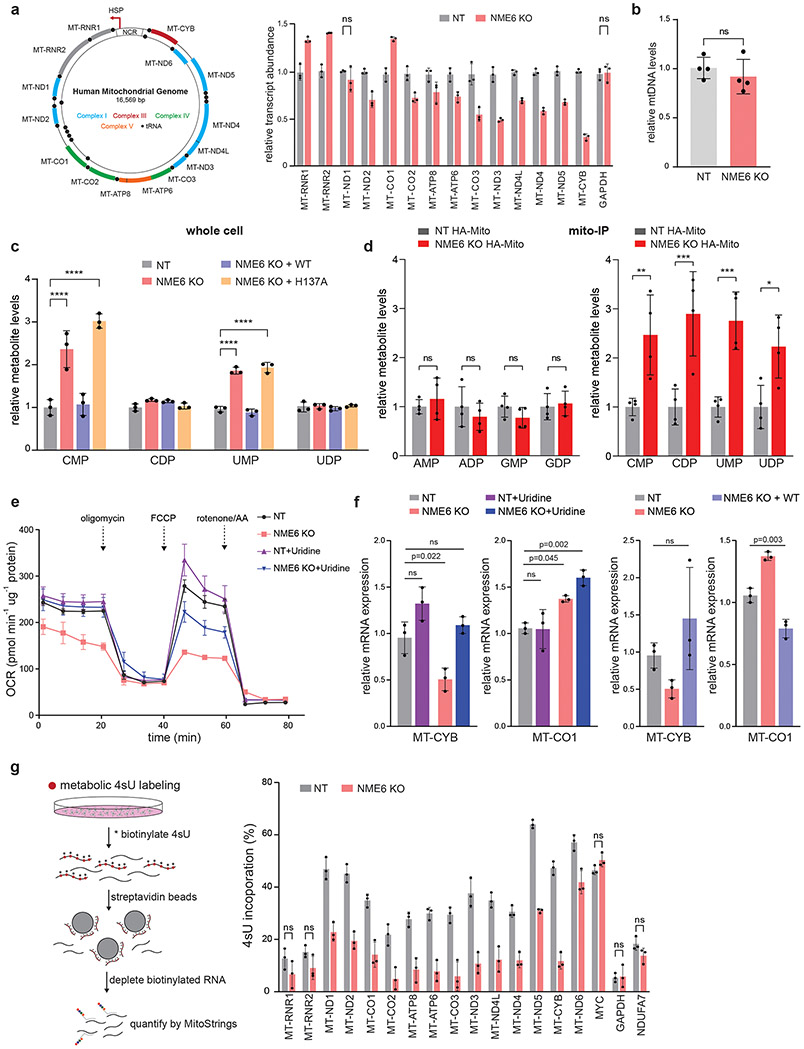
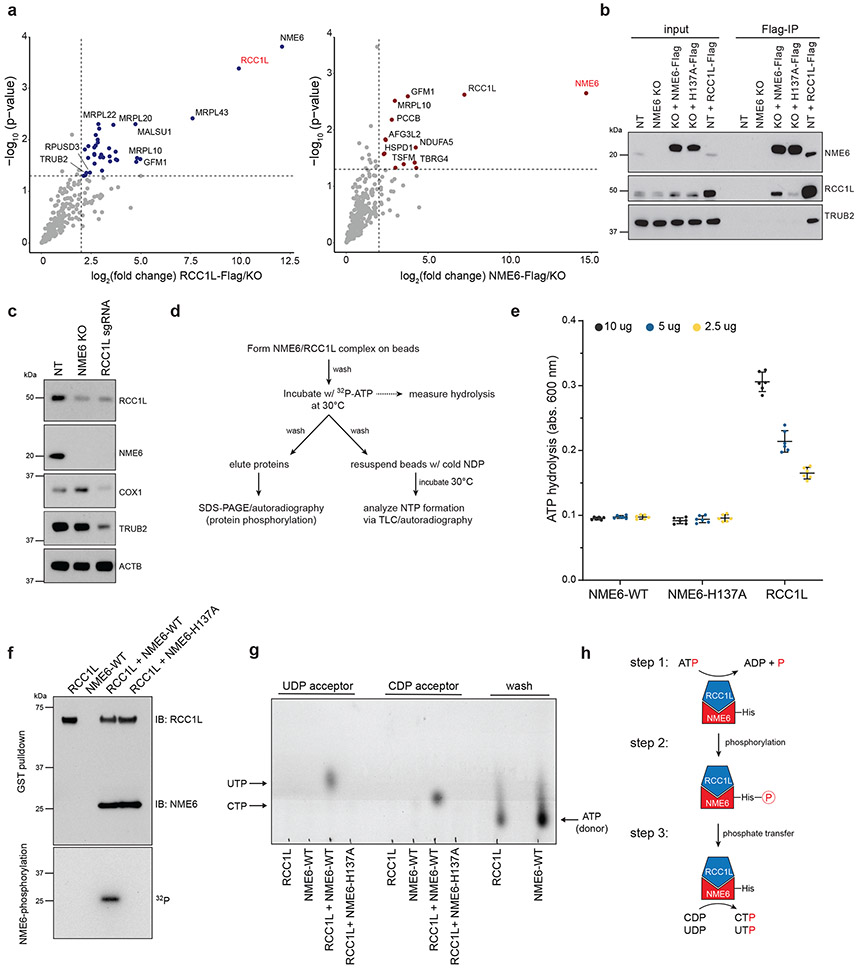
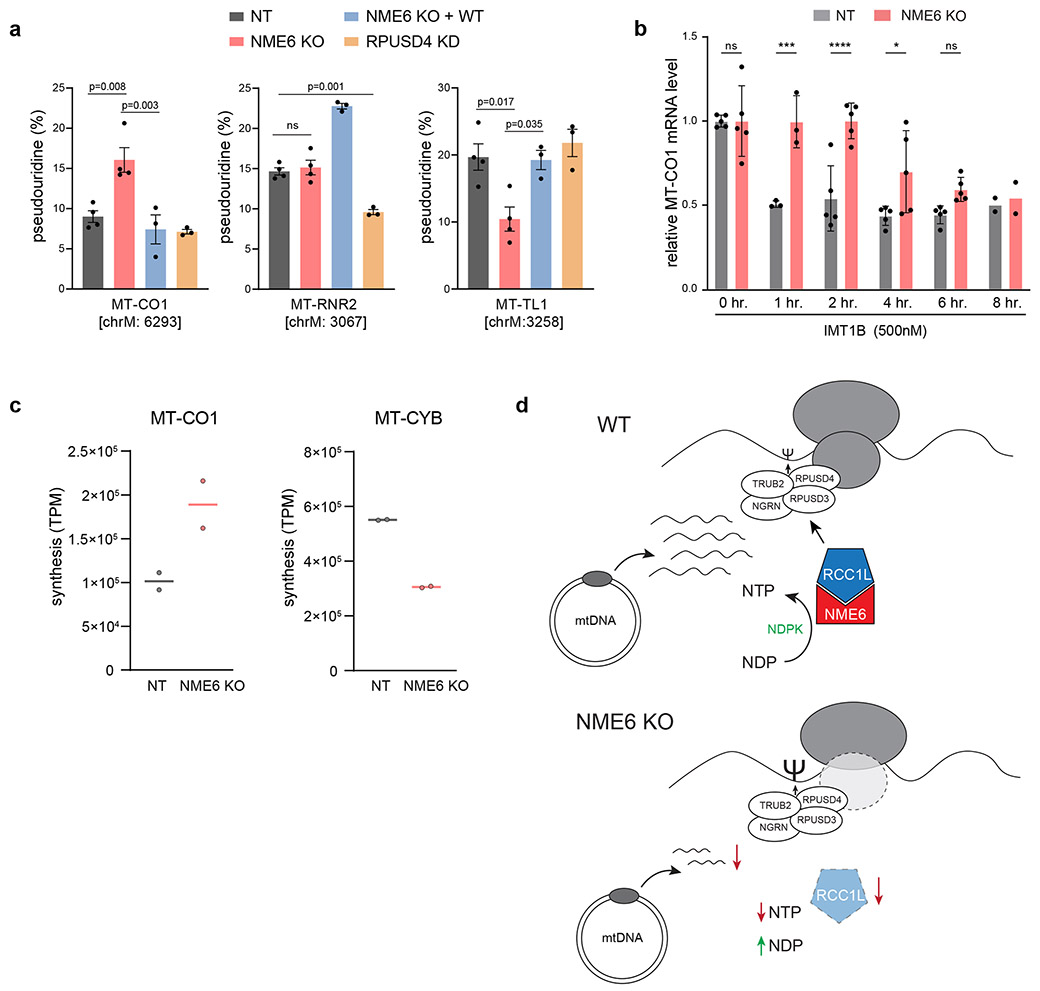
Mitochondrial oxidative phosphorylation (OXPHOS) complexes are assembled from proteins encoded by both nuclear and mitochondrial DNA. These dual-origin enzymes pose a complex gene regulatory challenge for cells requiring coordinated gene expression across organelles. To identify genes involved in dual-origin protein complex synthesis, we performed fluorescence-activated cell-sorting-based genome-wide screens analysing mutant cells with unbalanced levels of mitochondrial- and nuclear-encoded subunits of Complex IV. We identified genes involved in OXPHOS biogenesis, including two uncharacterized genes: PREPL and NME6. We found that PREPL specifically impacts Complex IV biogenesis by acting at the intersection of mitochondrial lipid metabolism and protein synthesis, whereas NME6, an uncharacterized nucleoside diphosphate kinase, controls OXPHOS biogenesis through multiple mechanisms reliant on its NDPK domain. Firstly, NME6 forms a complex with RCC1L, which together perform nucleoside diphosphate kinase activity to maintain local mitochondrial pyrimidine triphosphate levels essential for mitochondrial RNA abundance. Secondly, NME6 modulates the activity of mitoribosome regulatory complexes, altering mitoribosome assembly and mitochondrial RNA pseudouridylation. Taken together, we propose that NME6 acts as a link between compartmentalized mitochondrial metabolites and mitochondrial gene expression.


Figures

Extended Figure 1.
Extended Figure 1.
(a) Gating strategies used during flow cytometry depicting populations sorted for analysis in CRISPR screens. (b, c) Volcano plots of gene effect score (enrichment or depletion of sgRNAs in the sorted population relative to unsorted controls) vs confidence scores of genes identified in Population A and Population C. Colored points = genes passing a 10% FDR threshold. (d) Quality control metrics for CRISPR screens showing violin plots of the beta scores (degree of selection, negative values = negative selection, positive values = positive selection; MAGeCK) for all genes (left) or known essential genes (right) for each sample after 14 days in culture (T14) relative to screen day 0 (T0). sgRNAs targeting known essential genes were negatively selected over time indicating functional Cas9 activity and consistent sgRNA library behavior.
Extended Figure 2.
Extended Figure 2.
(a) Western blot validation of screen hits after individual sgRNA transductions (NT = non-targeting sgRNA). (b) TFAM and Complex V subunit levels (mito-encoded ATP6, nuclear-encoded ATP5H) levels in selected hits measured by western blotting. (c) FACS analysis of live cells transduced with individual sgRNAs and stained with MitoTracker Red CMXros (data are median fluorescence intensities from 20,000 analyzed cells).
Extended Figure 3.
Extended Figure 3.
(a) Representative STED micrograph of LRPPRC (magenta; matrix marker) and PREPL(L)-Flag (green) co-staining. Quantification of line scans (across indicated dashed line) of pixel intensity for each fluorescence channel appear in Fig. 3d. (b) STED micrograph showing raw signal compared to deconvolved images using Hyugen’s deconvolution (default parameters, Scientific Volume Imaging; scale bars = 500 nm). (c) 35S-methionine gels to analyze newly synthesized mitochondrial translation products (replicate gels used in quantification presented in Fig. 4f). (d) Immunoblot analysis of PREPL high molecular weight species (potential dimer from purified mitochondrial lysates (K562 endogenous PREPL, left ; K562 cells expressing PREPL-Flag, right). (e) Immunoblot analysis of PREPL putative dimerization after PREPL-Flag immunoprecipitation with or without cross-linking (x-link = crosslinked with 1 mM DSP (dithiobis(succinimidyl propionate, 2hr. at 4C and quenched with Tris pH7.5) and then treated −/+ reducing agent DTT (50 mM, 95C for 10 min) after immunoprecipitation.
Extended Figure 4.
Extended Figure 4.
(a) Mass spectrometry identification of proteins in anti-Flag immunoprecipitations from PREPL KO or PREPL-KO + PREPL(L)-Flag whole cell lysates (PREPL(L)-Flag = bait in blue; n = 3 replicates). (b) Co-immunoprecipitation (PREPL-Flag = bait) and western blot analysis of selected mass spectrometry-identified proteins, FASTKD4/TBRG4 and LARS2. (c-d) Sucrose gradient centrifugation and fractionation with western blot detection of mitoribosome subunits, as well as (c) PREPL(L)-Flag and FASTKD4 (MRPS18B = small mitoribosome subunit, MRPL12 = large mitoribosome subunits), and (d) endogenous PREPL. (e) MitoStrings measurements of mt-RNA abundance in control and PREPL KO cells (n = 4 replicates from 2 independent experiments). (f) qPCR measurements of mtDNA levels normalized to nuclear DNA content (mito target = MT-TL1, nuclear target = B2M; n = 4 replicates from 2 independent experiments, data are means +/− SD). (f) Western blot analysis of OXPHOS subunits in NT, PREPL KO, KO + PREPL-WT, and KO + PREPL-S559A, in HPLM media supplemented with charcoal-stripped FBS.
Extended Figure 5.
Extended Figure 5.
Direct RNA nanopore sequencing in control (NT), PREPL KO and NME6 KO cells. (a) Measurement of 5’-end processing levels for mt-mRNAs encoded on the heavy strand and (b) poly(A) tail lengths of mt-mRNAs in control, NME6 KO and PREPL KO cells. Two biological replicates are shown as dots in (a) and side-by-side in (b).
Extended Figure 6.
Extended Figure 6.
Mitochondrial protein turnover assays in (a) PREPL KO cells or (b) NME6 KO cells. Left panels: Cells were pulsed with 200 μg/mL chloramphenicol (CAP) to inhibit new mitochondrial protein synthesis for 0, 24 hr, 48 hr, or 72 hr., and proteins were detected via western blotting. Right panels: Quantifications of COX1 bands by densitometry were normalized to ACTB levels and plotted directly or normalized to time = 0 timepoints for each genotype to correct for the steady state subunit abundance levels in PREPL or NME6 KO cells. (c) Western blot analysis of TACO1 levels in PREPL KO or NME6 KO cells, MRPS18B and MRPL12 were used for loading controls. (d) Complex IV enzymatic activity measured colorimetrically by monitoring the oxidation of reduced cytochrome c over time from mitochondrial lysates immunocaptured on microplate wells coated with anti-Complex IV antibodies (related to Fig 5j). Shown here are the activities for 10 μg mitochondrial protein added per well in control and NME6 KO cells. Activities in OD/min were determined for Fig 5j by calculating the slope between 2 time points within the linear range of activity. (e) MitoStrings quantifications of RNA transcript abundance in control (NT) or TFB2M pooled CRISPR knock down cells (n = 2 independent cultures, data are means +/− SD).
Extended Figure 7.
Extended Figure 7.
In organello mitochondrial transcription visualized by 32P-UTP labeling in purified mitochondria. RNA was visualized using TBE-urea PAGE, followed by autoradiography of newly synthesized mt-RNA. SYBR gold staining of total RNA and western blots on input mitochondrial lysates were included for controls. (a) IMT1B was used as a positive control to inhibit mitochondrial transcription in NT control cells (5uM, 2 hr. pre-treatment in culture and maintained in labeling reaction). (b) Transcription assays from fractionated or mito-IP purified mitochondria in NT and NME6 KO cells. (c) Ribosome profiling analysis plotting synthesis (TPM = transcript per million) using mitoribosome protected footprints mapped to mitochondrial RNAs (related to Fig. 8c).
Extended Figure 8.
Extended Figure 8.
(a) Metabolite levels quantified by mass spectrometry in whole cell extractions from NT, NME6 KO, and WT/H137A rescue cell lines (relative to NT; n = 3 independent cultures). (b) Metabolite levels in NT or NME6 KO mito-IP cell lines after HA-immunoprecipitation (relative to NT; n = 4 independent cultures). SAM = S-adenosylmethionine, SAH = S-adenosylhomocysteine. (c-f) Isotope tracing using 13C-labeled glucose (22 hr. labeling) and mass spectrometry detection of labeling efficiency for plotted metabolites (c-d = whole cell lysates, e-f = mito-IP lysates). (g) Volcano plot for all confidently detected metabolites in mito-IP extracts comparing fold change in metabolites (NME6 KO/NT) vs significance values. (h) Malachite green phosphate assay showing background control values for data presented in Fig. 7e. Data are all means +/− SD; * p< 0.05, ** p< 0.01, *** p < 0.001, **** p < 0.0001.
Extended Figure 9.
Extended Figure 9.
(a) Western blot analysis of HEK293T cells transduced with indicated sgRNAs (AAVS1 = control sgRNA). (b-e) Sucrose gradient centrifugation and fractionation followed by western blotting. (b) NME6 co-sedimentation with mitoribosomes in K562 cells expressing NME6-Flag. (c-e) Mitoribosome assembly phenotypes detected by western blotting after sucrose gradient centrifugation and fractionation using antibodies for small (MRPS18B) and large (MRPL12) mitoribosome subunits to monitor mitoribosome assembly in (c, d) NME6 KO K562 cells and (e) NME6 sgRNA-transduced pooled knockdown (KD) HEK293T cells.
Extended Figure 10.
Extended Figure 10.
(a) qRT-PCR for MT-CO1 levels (left) or MT-RNR2 levels (right) in NT (control), NME6 KO, or K562 pooled CRISPR knockdown cells with the indicated sgRNAs targeting TRUB2, RCC1L, or RPUSD3. (b, c) Western blot analysis of RCC1L-Flag immunoprecipitations in NT (control) or NME6 KO cell backgrounds in K562 and HEK293T, respectively.
Figure 1.
Figure 1.
Genome-wide CRISPR screens identify regulators of mitonuclear balance. (a) Dual genome-encoded Complex IV biogenesis initiates with synthesis of mito-encoded COX1 and nuclear-encoded COX4. (b) FACS immunostaining of COX1, COX4, and ACTB levels after mitochondrial transcriptional inhibition with ethidium bromide (EtBr; 2 μg/mL, 3 days) or with sgRNAs targeting nuclear-encoded COX4I1 in K562-Cas9 cells. (c) Western blot analysis after ethidium bromide treatment (2 μg/mL, 5 days), chloramphenicol treatments (CAP; 200 μg/mL, 5 days), or COX4 knockdown (COX4I1 targeting sgRNA or non-targeting (NT) control sgRNA). Representative blot of 3 independently repeated experiments. (d) Schematic of genome-wide FACS-based CRISPR screening approach to measure mito-nuclear subunit expression. sgRNA libraries include 10 sgRNAs/gene and ~10,000 negative control sgRNAs. Cells were fixed, immunostained, and sorted based on expression levels of mito- and nuclear-encoded Complex IV (CIV) subunits (COX1 and COX4, respectively) after 10-14 days. DNA was purified from sorted (Gates A - D) and unsorted control cells to determine sgRNA enrichment or depletion from populations of interest. (e, f) Volcano plots summarizing gene knockout (KO) effect (enrichment or depletion of sgRNAs in the sorted population relative to unsorted controls) vs. confidence scores (blue or green points: hits < 10% FDR; screens were performed in duplicate, independently; analyzed by MAGeCK, see methods). COX4I1 and hits studied in more detail are shown in red. Significantly enriched gene ontology terms for positively selected genes (GO Biological Process, PANTHER: Fisher’s exact test with FDR) are shown below. Source numerical data and unprocessed blots are available in source data.
Figure 2.
Figure 2.
Summary of OXPHOS biogenesis regulators identified by CRISPR screens. (a) Schematic of selected genes (FDR < 10%) grouped by subcellular localization and reported functions. Genes predicted to localize to mitochondria (present in MitoCarta3.0), but with uncharacterized functions in mitochondrial biology are highlighted in red (TFs = transcription factors). (b) FACS validation of individual sgRNAs in methanol-fixed K562 cells, 10 days post-transduction (NT = non-targeting control sgRNA). (c) Western blot validation of individual sgRNAs, 10 days post-transduction. Representative blot of 3 independently repeated experiments. (d) Western blot analysis and quantification of COX1 and COX4 levels in PREPL and NME6 homozygous KO K562 cells (2 independently generated clonal KO lines quantified each; normalized to ACTB levels). Source numerical data and unprocessed blots are available in source data.
Figure 3.
Figure 3.
PREPL, a brain-enriched, dual-localized protein, regulates Complex IV biogenesis. (a) Representative western blots of COX1 and COX4 subunit levels in NT (non-targeting control sgRNA), PREPL KO, and PREPL KO rescue cells (PREPL(L) = PREPL-Flag, long isoform). Representative blot of 3 repeated experiments. (b) Subcellular fractionation and western blotting for endogenous PREPL or exogenous PREPL(L)-Flag (WC = whole cell, cyto = cytosol fraction, mito = mitochondrial fraction, PREPL(s) = PREPL-short isoform). Representative blot of 3 repeated experiments. (c) Schematic representation of short and long PREPL protein isoforms and representative western blot detection of PREPL expression and isoform usage across mouse tissues (C57BL/6, 8 week-old, males; Representative blot of 2 independently repeated experiments). (d) Left: Representative micrographs of confocal and STED microscopy in U2OS cells transduced with PREPL(L)-Flag, immunostained with anti-Flag and anti-TOMM40 (outer mitochondrial membrane marker) antibodies. Right: pixel intensity line scans of fluorescence channels across the indicated dashed line (green = FLAG, magenta = TOMM40 or LRPPRC, matrix marker, Fig. ED3a for micrograph; scale bars = 10 μm confocal panel, 500 nm STED panels; experiment repeated twice). (e) Blue-native PAGE (BN-PAGE) followed by western blot detection (indicated antibody above) of native OXPHOS Complexes I-V. Representative blots of 3 independent experiments. (f-h) Seahorse extracellular flux assays to measure OCR linked to Complex I (f) or Complex IV (g) in permeabilized K562 cells supplemented with indicated substrates. (h) Quantification of state 3 respiration defined as the difference between maximal respiratory capacity after addition of substrates specific for Complex I or Complex IV and respiratory capacity after complete inhibition of the respective complex (OCR = oxygen consumption rate, ns = non-significant, **** p < 0.0001, n = 4 independent cultures, 2-way ANOVA with Sidak’s multiple comparisons correction, data are means +/− standard deviation (SD)). (i) Seahorse assay measuring OCR in live cells with mitochondrial stressors (FCCP = carbonyl cyanide-p-trifluoromethoxyphenylhydrazone, AA = antimycin A, perm = XF Plasma Membrane Permeabilizer, ADP = adenosine diphosphate, pyr+mal = pyruvate and malate, TMPD/Asc = N,N,N,N-tetramethyl-p-phenylenediamine/ascorbate; n = 4 (control and KO+PREPL) or 5 (PREPL KO) independent cultures). Source numerical data and unprocessed blots are available in source data.
Figure 4.
Figure 4.
PREPL thioesterase activity mediates Complex IV biogenesis. (a) Gene ontology terms for proteins identified by immunoprecipitation(IP)/mass spectrometry and significantly enriched in PREPL(L)-Flag IPs relative to control IPs (Panther: GO Biological Process, Fisher’s exact test with FDR). (b) Cell proliferation measured by CellTiter-Glo in human plasma like media (HPLM) supplemented with standard FBS (left) or charcoal-stripped FBS (right); S559A = PREPL(L) with serine 559 mutated to alanine (left, n = 5 independent cultures; right, n = 6 independent cultures, 2-way ANOVA with Tukey’s multiple comparisons correction, **** p < 0.0001). (c) Representative western blot analysis of OXPHOS subunits in control (NT), PREPL KO, and KO cells transduced with long or short PREPL isoforms with or without S559A mutation. Experiments repeated twice. (d) Seahorse assay measuring OCR in live cells grown in HPLM + charcoal-stripped FBS with mitochondrial stressors (FCCP = carbonyl cyanide-p-trifluoromethoxyphenylhydrazone, AA = antimycin; n = 5 independent cultures). (e) Western blotting in PREPL-Flag expressing K562 cells on fractions collected from 10-50% sucrose gradients after ultracentrifugation (MRPS18B = small mitoribosome subunit, MRPL12 = large mitoribosome subunit). Representative blot of 2 independent experiments. (f) Left: 35S-methionine metabolic labeling for 30 or 60 min. in the presence of anisomycin (100 ug/mL) followed by autoradiography of mitochondrial translation products and western blotting of ACTB to control for loading. Right: Quantification of COX1 synthesis or total protein synthesis (summed intensity of all bands) normalized to loading controls and plotted relative to NT control samples for each gel (CAP = chloramphenicol, 50 ug/mL; n = 4 independent experiments; Fig ED3 for replicate gels, 2-way ANOVA with Sidak’s multiple comparisons correction, 30 min: ****p<0.0001, 60 min: ***p=0.003). Data are means +/− SD for all plots; ns = non-significant. Source numerical data and unprocessed blots are available in source data.
Figure 5.
Figure 5.
Loss of NME6 disrupts OXPHOS biogenesis and mitochondrial respiration. (a) Schematic of NDPK family members and protein sequence alignment indicating the highly conserved active-site histidine 137 in NME6 (shading represents level of conservation by percent identity using Clustal Omega NME1–NME2 = 88%, NME1–NME4 = 55%, NME1–NME6 = 25%). (b) Representative micrographs of U2OS cells transduced with NME6-Flag, immunostained with anti-Flag and anti-LRPPRC antibodies (green = Flag, magenta = LRPPRC, blue = DAPI; scale bar = 10 μm). Experiment repeated twice. (c) Subcellular fractionation and Proteinase K (PK) digestion of mitochondria in the presence or absence of Triton X-100 (TX-100) detergent followed by western blotting with indicated antibodies (WC = whole cell, cyto = cytosol fraction, mito = mitochondrial fraction, NT= non-targeting sgRNA, KO = NME6 KO). Representative blot of 2 independently repeated experiments. (d) Cell proliferation measurements at day 4 relative to day 0 in control (NT) and NME6 KO cells measured by CellTiter-Glo in HPLM media (n = 4 independent cultures, one-way ANOVA with Tukey’s multiple comparisons correction, **** p < 0.0001). (e) Representative western blots of COX1, COX4 (Complex IV) and CYTB (Complex III) subunit levels in control (NT), KO, and WT/H137A rescue cells. (f) Seahorse assay assessing OCR in live cells using mitochondrial stressors (FCCP = carbonyl cyanide-p-trifluoromethoxyphenylhydrazone, AA = antimycin A; n = 5 independent cultures). (g) Blue-native PAGE (BN-PAGE) followed by western blot detection (indicated antibody above) of native OXPHOS Complexes I-V in control, NME6 KO, or KO cells expressing WT- or H137A-NME6. (h) Seahorse extracellular flux assays to measure OCR in Complex I or Complex IV in permeabilized K562 cells supplemented with indicated substrates. (perm = XF Plasma Membrane Permeabilizer, ADP = adenosine diphosphate, pyr+mal = pyruvate and malate, TMPD/Asc = N,N,N,N-tetramethyl-p-phenylenediamine/ascorbate; Complex I: n = 6 independent cultures; Complex IV: n = 3 (NT), n = 5 (NME6 KO) independent cultures). (i) In vitro Complex IV enzymatic activity with indicated mitochondrial lysate amounts (n = 2 biological replicate lysates per protein input, experiments were repeated 2 independent times; lines represent non-linear fit for the dose response curves). (j) Representative electron micrographs of mitochondrial cristae structure by transmission electron microscopy in NT and NME6 KO cells (scale bar = 800 nm, 116 nm inset; representative micrograph from 10 field of views). Data are all means +/− SD. Source numerical data and unprocessed blots are available in source data.
Figure 6.
Figure 6.
Loss of NME6 regulates mtRNA abundance due to disruption of mitochondrial pyrimidine pools. (a) Left: schematic of human mitochondrial DNA and right: mRNA abundance quantified by MitoStrings (normalized to nuclear-encoded NDUFA7; p < 0.05 unless otherwise stated, ns = non-significant; n = 3 independent cultures; experiment repeated 3 times independently). (b) qPCR measurements of mtDNA levels normalized to nuclear DNA (mito target = MT-TL1, nuclear target = B2M; n = 4 replicates across 2 independent experiments). Metabolites detected from (c) whole cell or (d) mito-IP lysates using LC-MS (data normalization detailed in methods; n = 3 (whole cell) or 4 (mito-IP) independent cultures per experiment; two-way ANOVA with Dunnett’s multiple comparisons correction, * p = 0.0205, ** p = 0.0048 , *** p = 0.0008 (UMP) , *** p = 0.0003 (CDP) ,**** p < 0.0001). (e) Seahorse assay assessing OCR in live cells using mitochondrial stressors in media supplemented with or without uridine (FCCP = carbonyl cyanide-p-trifluoromethoxyphenylhydrazone, AA = antimycin A; n = 3 independent cultures). (f) qRT-PCR measurements of MT-CO1 and MT-CYB in NT, NME6 KO, KO+NME6-WT cells supplemented with or without uridine (72hr., 50 μg/mL; n = 3 biological replicates, one-way ANOVA with Tukey’s multiple comparisons correction). (g) 4sU transcript incorporation measured by metabolic labeling in control (NT) or NME6 KO cells. Left: schematic of the experimental approach. Right: unlabeled RNAs quantified by MitoStrings (normalized to unlabeled spike-in control; p < 0.05 unless otherwise stated, ns = non-significant; n = 3 independent cultures, experiment repeated independently twice). Data are all means +/− SD. Source numerical data are available in source data.
Figure 7.
Figure 7.
NME6 and RCC1L together perform NDPK activity in vitro. (a) IP-mass spectrometry identification of proteins interacting with NME6-Flag or RCC1L-Flag in purified mitochondria (colored points = p < 0.05 and log2(fold-change) > 2 indicated by dashed lines, two-tailed Welch’s t-test). (b) Co-IP analysis of anti-Flag pulldowns in control (NT), NME6 KO, NME6 KO + WT-NME6-Flag, NME6 KO + H137A-NME6-Flag, or NT + RCC1L-Flag cells. Representative blot of 3 independently repeated experiments. (c) Western blot analysis of protein levels in NME6 KO cells or RCC1L knock-down cells (RCC1L sgRNA). Representative blot of 3 independently repeated experiments. (d) Outline of in vitro assays to test NDPK function using recombinant 6xHis-NME6 (WT or H137A) and GST-RCC1L (TLC = PEI cellulose, thin layer chromatography). (e) ATP hydrolysis assays with recombinant RCC1L, NME6-WT, or NME6-H137A using a malachite green phosphate assay to measure the liberation of free orthophosphate after the addition of ATP (monitored with absorbance at 600 nm (n = 6 wells, experiment repeated 3 independent times; data are means −/+ SD). (f) In vitro binding of RCC1L and NME6 using glutathione agarose bead pull downs and immunoblotting with indicated antibodies (top) and (bottom) protein phosphorylation analysis using SDS-PAGE and autoradiography after incubation with γ-32P ATP. Representative blot of 3 independently repeated experiments. (g) Thin layer chromatography (PEI-cellulose plates,1.2M LiCl solvent) analysis of NTP formation using autoradiography. Cold UDP or cold CDP were used as acceptor nucleotides for phosphate transfer reactions (representative TLC plate from 3 independent experiments). (h) Model of NDPK activity by NME6/RCC1L. Briefly, RCC1L is required for initial ATP hydrolysis (step 1), NME6 is phosphorylated at H137 (step 2), and phosphate is transferred from NME6-H137 to acceptor diphosphate nucleosides (step 3). Source numerical data and unprocessed blots are available in source data.
Figure 8.
Figure 8.
NME6 KO disrupts mt-RNA pseudouridylation levels increasing MT-CO1 RNA stability and synthesis. (a) CMC-sequencing of NT, NME6 KO, KO+NME6-WT, and RPUSD4 knockdown (KD) cells to measure pseudouridine levels at three high confidence modification sites in MT-CO1, RNR2 and MT-TL (n = 3 (KO+NME6-WT, RPUSD4 KD) or 4 (NT, NME6) biological replicates across 3 independent sequencing experiments and 2 independently generated clonal KO cell lines for NME6, one-way ANOVA with Tukey’s multiple comparisons corrections). (b) qRT-PCR measurements of MT-CO1 mRNA levels after treatment with IMT1B (500nM) for indicated time in NT or NME6 KO K562 cells (data normalized to ACTB and plotted relative to 0 hr. levels; n = 5 (0 hr., 2 hr., 4 hr., 6hr.), 3 (1hr.), or 2 (8hr.) independent cultures from 2 independent experiments; * p = 0.029,*** p = 0.0006, **** p < 0.0001; two-way ANOVA with Sidak’s multiple comparisons correction). (c) Ribosome profiling analysis plotting synthesis (TPM = transcript per million) representing mitoribosome protected footprints mapped to MT-CO1 or MT-CYB (n = 2 independent sequencing experiments). (d) Schematic of NME6 function linking local mitochondrial metabolites to the regulation of mitochondrial gene expression. NME6 functions as a heterodimer with RCC1L which together perform NDPK activity to regulate mitochondrial pyrimidine levels. Upon deletion of NME6, mitochondrial pyrimidine homeostasis is disrupted leading to decreased levels of most mt-RNAs, with the exception of MT-CO1. NME6/RCC1L further interact with mitoribosome associated assembly factors and alter the activity of pseudouridine synthases (Ψ = pseudouridine modified base). Bar plots all represent means +/− SD. Source numerical data are available in source data.

Update of

Similar articles

Cited by

References

    1. Ryan MT & Hoogenraad NJ Mitochondrial-nuclear communications. Annu. Rev. Biochem 76, 701–722 (2007). - PubMed
    1. Mottis A, Herzig S & Auwerx J Mitocellular communication: Shaping health and disease. Science 366, 827–832 (2019). - PubMed
    1. Isaac RS, McShane E & Churchman LS The Multiple Levels of Mitonuclear Coregulation. Annu. Rev. Genet 52, 511–533 (2018). - PubMed
    1. Chan DC Mitochondria: dynamic organelles in disease, aging, and development. Cell 125, 1241–1252 (2006). - PubMed
    1. Wallace DC A mitochondrial paradigm of metabolic and degenerative diseases, aging, and cancer: a dawn for evolutionary medicine. Annu. Rev. Genet 39, 359–407 (2005). - PMC - PubMed

Publication types

MeSH terms