. 2023 Nov;28(11):4679-4692.
doi: 10.1038/s41380-023-02248-z. Epub 2023 Sep 28.

Psychiatric risk gene Transcription Factor 4 (TCF4) regulates the density and connectivity of distinct inhibitory interneuron subtypes

Affiliations

Psychiatric risk gene Transcription Factor 4 (TCF4) regulates the density and connectivity of distinct inhibitory interneuron subtypes

Huei-Ying Chen et al. Mol Psychiatry. 2023 Nov.

Abstract

Transcription factor 4 (TCF4) is a basic helix-loop-helix transcription factor that is implicated in a variety of psychiatric disorders including autism spectrum disorder (ASD), major depression, and schizophrenia. Autosomal dominant mutations in TCF4 are causal for a specific ASD called Pitt-Hopkins Syndrome (PTHS). However, our understanding of etiological and pathophysiological mechanisms downstream of TCF4 mutations is incomplete. Single cell sequencing indicates TCF4 is highly expressed in GABAergic interneurons (INs). Here, we performed cell-type specific expression analysis (CSEA) and cellular deconvolution (CD) on bulk RNA sequencing data from 5 different PTHS mouse models. Using CSEA we observed differentially expressed genes (DEGs) were enriched in parvalbumin expressing (PV+) INs and CD predicted a reduction in the PV+ INs population. Therefore, we investigated the role of TCF4 in regulating the development and function of INs in the Tcf4+/tr mouse model of PTHS. In Tcf4+/tr mice, immunohistochemical (IHC) analysis of subtype-specific IN markers and reporter mice identified reductions in PV+, vasoactive intestinal peptide (VIP+), and cortistatin (CST+) expressing INs in the cortex and cholinergic (ChAT+) INs in the striatum, with the somatostatin (SST+) IN population being spared. The reduction of these specific IN populations led to cell-type specific alterations in the balance of excitatory and inhibitory inputs onto PV+ and VIP+ INs and excitatory pyramidal neurons within the cortex. These data indicate TCF4 is a critical regulator of the development of specific subsets of INs and highlight the inhibitory network as an important source of pathophysiology in PTHS.


Conflict of interest statement

COMPETING INTERESTS

The authors declare no competing interests.

Figures

Fig. 1
Fig. 1. Cell type-specific expression analyses and cellular deconvolution of bulk RNA-seq data predicts a reduction in PV + INs in Tcf4++/mut mice.
A. Bar plot showing the odds ratio (±S.E.M) from gene set enrichment analyses of up- or down-regulated genes in Tcf4+/mut mice with marker genes for mouse cell types identified by single cell RNA-seq. Statistically significant enrichments at FDR < 0.05 are plotted with bold-black outlines. The full numerical results are reported in Supplementary Table 5. B. Cellular deconvolution of Tcf4+/mut across different models of Tcf4 mutations estimates a decrease in PV+ INs in mutant mice. The p-value and FDR are reported for the overall effect of Tcf4 mutation across mouse lines and ages. C. Violin plots of normalized Tcf4 expression in the Allen Brain Atlas mouse single cell RNA-seq of interneuron types.
Fig. 2
Fig. 2. Dysregulation of IN specific gene expression in the PTHS mouse model.
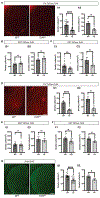
A qPCR of IN-specific gene expression in the adult cortex of WT and Tcf4+/tr mice. Expression of Gad1 (p = 0.000678), Gabra1 (p = 0.01514), Pvalb (p = 0.002031), Sst (p = 0.000191), and Tcf4 (p = 0.000537) was downregulated in the Tcf4+/tr mice compared to WT littermates. B IHC staining of GABA (green) and DAPI (blue) in the adult somatosensory cortex of WT (left) and Tcf4+/tr (right) littermates. The density of GABA+ cells was reduced in Tcf4+/tr mice (B1 WT 609.8. ± 10.55, N = 15 sections, Tcf4+/tr 509.5 ± 12.19, N = 15 sections, p < 0.0001; B2 WT 609.8 ± 18.83, N = 3 animals, Tcf4+/tr 509.5 ± 25.89, N = 3 animals, p = 0.0351). C IHC staining of PV+ cells in the adult somatosensory cortex of WT (left) and Tcf4+/tr (right) littermates. The density of PV+ cells was reduced in Tcf4+/tr mice (C1 WT 83.54 ± 2.16, N = 26 sections, Tcf4+/tr 61.46 ± 2.2, N = 26 sections, p < 0.0001; C2 WT 81.7 ± 5.14, N = 3 animals, Tcf4+/tr 59.61 ± 4.72, N = 3 animals, p = 0.0341). D IHC staining of SST+ cells in the adult somatosensory cortex of WT (left) and Tcf4+/tr (right) littermates. The density of SST+ cells was not different between genotypes (D1 WT 122.7 ± 4.29, N = 23 sections, Tcf4+/tr 125.3 ± 3.18, N = 23 sections, p = 0.6386; D2 WT 126 ± 7.61, N = 4 animals, Tcf4+/fr 126.9 ± 3.0, N = 4 animals, p = 0.9125). Stats presented as mean ± s.e.m, scale bars = 100 um.
Fig. 3
Fig. 3. Reduced density of specific subclasses of INs in the PTHS mouse cortex.
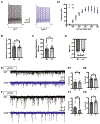
A Schematic design of Cre-dependent labeling of various cortical interneuron subclasses. B The density of PV+ INs was reduced in the somatosensory cortex of Tcf4+/tr mice (B1 WT 175.3 ± 4.55, N = 17 sections, Tcf4+/tr 128.5 ± 3.08, N = 17 sections, p < 0.0001; B2 WT 174.4 ± 9.76, N = 3 animals, Tcf4+/tr 128.4 ± 2.92, N = 3 animals, p = 0.0107). C No effect of Tcf4 loss-of-function on the density of SST+ INs in the somatosensory cortex of Tcf4+/tr mice (C1 WT 192.1 ± 5.74, N = 18 sections, Tcf4+/tr 196.8 ± 3.4, N = 17 sections, p = 0.496; C2 WT 192.1 ± 12.72, N = 3 animals, Tcf4+/tr 197.3 ± 4.8, N = 3 animals, p = 0.725). D The density of VIP+ INs was reduced in the somatosensory cortex of Tcf4+/tr mice (D1. WT 85.6 ± 3.17, N = 15 sections, Tcf4+/tr 62.92 ± 3.11, N = 15 sections, p < 0.0001; D2 WT 85.6 ± 0.59, N = 3 animals, Tcf4+/tr 62.92 ± 4.64, N = 3 animals p = 0.0083). E The density of CST+ INs was reduced in the somatosensory cortex of Tcf4+/tr mice (E1 WT 205 ± 4.79, N = 26 sections, Tcf4+/tr 162.5 ± 3.92, N = 26 sections, p < 0.0001; E2 WT 200.6 ± 11.61, N = 3 animals Tcf4+/tr 159.4 ± 7.72, N = 3 animals, p = 0.0419). F The density of PV+ INs was reduced in the medial prefrontal cortex of Tcf4+/tr mice (F1 WT 115.9 ± 8.84, N = 14 sections, Tcf4+/tr 62 ± 5.86, N = 14 sections, p < 0.0001; F2 WT131 ± 4.11, N = 3 animals, Tcf4+/tr 68.04 ± 12.25, N = 3 animals, p = 0.0082). G The density of SST+ INs was not different in the medial prefrontal cortex of Tcf4+/tr mice (G1 WT 229 ± 8.32, N = 15 sections, Tcf4+/tr 237.5 ± 6.97, N = 15 sections, p = 0.4406; G2 WT 229 ± 16.2, N = 3 animals, Tcf4+/tr 238.5 ± 22.78, N = 3 animals, p = 0.7512). H The density of VIP+ INs was not different in the medial prefrontal cortex of Tcf4+/tr mice (H1 WT 93.17 ± 3.95, N = 15 sections, Tcf4+/tr 87.86 ± 5.01, N = 14 sections, p = 0.3043; H2 WT 93.17 ± 4.64, N = 3 animals, Tcf4+/tr 87.87 ± 4.64, N = 3 animals, p = 0.4644). Stats mean ± s.e.m., scale bars B–H = 100 μm, scale bar in H = 30 μm.
Fig. 4
Fig. 4. Reduced density of specific subclasses of INs in subcortical brain regions.
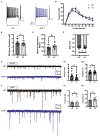
A Representative images showing PV+ INs in the striatum of WT and Tcf4+/tr mice. A1 The density of PV+ INs was reduced in the striatum of Tcf4+/tr mice (A1 WT 27.91 ± 2.03, N = 30 sections, HET 12.36 ± 1, N = 30 sections, p < 0.0001; A2 WT 27.91 ± 4.79, N = 5 animals, Tcf4+/tr 12.36 ± 2.37, N = 5 animals, p = 0.0196). B No effect of Tcf4 loss-of-function on the density of SST+ INs in the striatum of Tcf4+/tr mice (B1 WT 65.98 ± 3.35, N = 9 sections, Tcf4+/tr 74.31 ± 5.3, N = 9 sections, p = 0.2031; B2 WT 65.98 ± 4.09, N = 3 animals, Tcf4+/tr 74.31 ± 8.61, N = 3 animals, p = 0.4318). C The density of VIP+ INs was reduced in the striatum of Tcf4+/tr mice (C1 WT 0.932 ± 0.13, N = 17 sections, Tcf4+/tr 0.5235 ± 0.07, N = 16 sections, p = 0.0095; C2 WT 0.959 ± 0.232, N = 3 animals, Tcf4+/tr 0.51 ± 0.09, N = 3 animals, p = 0.1464). D Representative images showing PV+ INs in the BLA of WT and Tcf4+/tr mice. D1 The density of PV+ INs was reduced in the BLA of Tcf4+/tr mice (D1 WT 42.34 ± 4.74, N = 13 sections, Tcf4+/tr 14.42 ± 2.37, N = 13 sections, p < 0.0001; D2 WT 42.68 ± 6.26, N = 3 animals, Tcf4+/tr 14.85 ± 4.64, N = 3 animals, p = 0.0233). E No effect of Tcf4 loss-of-function on the density of SST+ INs in the BLA of Tcf4+/tr mice (E1 WT 193.3 ± 26.67, N = 12 sections, Tcf4+/tr 180.3 ± 19.83, N = 12 sections, p = 0.6995; E2 WT 193.3 ± 33.3, N = 3 animals, Tcf4+/tr 180.3 ± 27.24, N = 3 animals, p = 0.7776). F The density of VIP+ INs was reduced in the BLA of Tcf4+/tr mice (F1 WT 100.8 ± 6.32, N = 12 sections, Tcf4+/tr 79.87 ± 4.41, N = 12 sections, p = 0.0126; F2 WT 100.8 ± 8.44, N = 3 animals, Tcf4+/tr 79.87 ± 6.77, N = 3 animals, p = 0.1253). G Representative images showing ChAT+ INs in the striatum of WT and Tcf4+/tr mice. G1 The density of ChAT+ INs was reduced in the striatum of Tcf4+/tr mice (G1 WT 41.19 ± 1.47, N = 24 sections, Tcf4+/tr 31.18 ± 1.79, N = 24 sections, p < 0.0001; G2 WT 41.19 ± 2.38, N = 4 animals, Tcf4+/tr 31.18 ± 2.55, N = 4 animals, p = 0.0285). Stats mean ± s.e.m., scale bars A, G = 400 μm, scale bar D = 200 μm.
Fig. 5
Fig. 5. Intrinsic and synaptic characteristics of PV + INs in the PTHS mouse model.
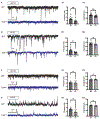
A Representative traces showing high frequency action potentials in response to current injections. A1 No effect of TCF4 loss-of-function on action potential output in PV+ INs (ANOVAfreq p = 0.3239). B Membrane capacitance is not different by genotype (WT 12.17 ± 0.9, N = 12 cells, HET 11.35 ± 0.38, N = 18 cells, p = 0.3538). C Membrane resistance is not different by genotype (WT 123 ± 11.47, N = 12 cells, HET 134.1 ± 10.76, N = 18 cells, p = 0.4994). D. Resting membrane potential is not different by genotype (WT −62.25 ± 1.81, N = 12 cells, HET −60.41 ± 1.38, N = 18 cells, p = 0.4197) E Representative traces showing sEPSCs recorded from a PV + IN in a WT and Tcf4+/tr brain slice. E1 The frequency of sEPSCs was not different by genotype (WT 3.28 ± 0.58, N = 12 cells, HET 3.11 ± 0.5, N = 13 cells, p = 0.8259). E2 The amplitude of sEPSCs was not different by genotype (WT 17.4 ± 0.87, N = 12 cells, HET 16.67 ± 0.51, N = 13 cells, p = 0.466). F Representative traces showing sIPSCs recorded from PV+ INs in brain slices from WT and Tcf4+/tr mice. F1 The frequency of sIPSCs was reduced in PV+ INs from Tcf4+/tr brain slices compared to WT PV+ INs (WT 3.79 ± 0.6, N = 19 cells, HET 1.87 ± 0.26, N = 20 cells, p = 0.0051). F2 The amplitude of sIPSCs was not different by genotype (WT 20.79 ± 0.98, N = 19 cells, HET 22.25 ± 0.9, N = 20 cells, p = 0.2819).
Fig. 6
Fig. 6. Intrinsic and synaptic characteristics of VIP + INs in the medial prefrontal cortex of the PTHS mouse model.
A Representative traces showing action potentials in response to current injections. A1 No effect of TCF4 loss-of-function on action potential output in VIP+ INs (ANOVAfreq p = 0.3149). B Membrane capacitance was not different by genotype (WT 6.05 ± 0.25, N = 24 cells, Tcf4+/tr 5.58 ± 0.17, N = 25 cells, p = 0.1125). C Membrane resistance was increased in VIP+ INs from Tcf4+/tr brain slices compared to WT VIP+ INs (WT 180 ± 9.24, N = 24 cells, Tcf4+/tr 227.1 ± 14, N = 25 cells, p = 0.0082). D Resting membrane potential was not different by genotype (WT −60.54 ± 1.04, N = 24 cells, Tcf4+/tr −61.67 ± 1.17, N = 25 cells, p = 0.4754) E Representative traces showing sEPSCs recorded from a VIP + IN in a WT (black) and Tcf4+/tr (blue) brain slice. E1 The frequency of sEPSCs was reduced in VIP+ INs from Tcf4+/tr brain slices compared to WT VIP+ INs (WT 1.09 ± 0.16, N = 32 cells, Tcf4+/tr 0.71 ± 0.09, N = 34 cells, p = 0.0415). E2 The amplitude of sEPSCs was not different by genotype (WT 10.21 ± 0.32, N = 32 cells, Tcf4+/tr 9.97 ± 0.26, N = 34 cells, p = 0.5593). F Representative traces showing sIPSCs recorded from VIP+ INs in brain slices from WT (black) and Tcf4+/tr (blue) mice. F1 The frequency of sIPSCs was not different by genotype (WT 0.82 ± 0.2, N = 9 cells, Tcf4+/tr 0.79 ± 0.16, N = 15 cells, p = 0.9079). F2 The amplitude of sIPSCs was not different by genotype (WT 32.31 ± 1.69, N = 9 cells, Tcf4+/tr 38.12 ± 2.6, N = 15 cells, p = 0.1228).
Fig. 7
Fig. 7. Excitatory and inhibitory synaptic characteristics of medial prefrontal pyramidal neurons in the PTHS mouse model.
A Representative traces showing sEPSCs recorded from a pyramidal neuron in a WT (black) and Tcf4+/tr (blue) brain slice. A1 The frequency of sEPSCs was reduced in pyramidal neurons from Tcf4+/tr brain slices compared to WT pyramidal neurons (WT 1.48 ± 0.21, N = 23 cells, Tcf4+/tr 0.72 ± 0.11, N = 29 cells, p = 0.0012). A2 The amplitude of sEPSCs was reduced in pyramidal neurons from Tcf4+/tr brain slices compared to WT pyramidal neurons (15.99 ± 0.44, N = 23 cells, Tcf4+/tr 14.02 ± 0.47, N = 29 cells, p = 0.0046). B Representative traces showing sIPSCs recorded from a pyramidal neuron in brain slices from WT (black) and Tcf4+/tr (blue) mice. B1 The frequency of sIPSCs was reduced in pyramidal neurons from Tcf4+/tr brain slices compared to WT pyramidal neurons (WT 5.53 ± 0.68, N = 26 cells, Tcf4+/tr 3.04 ± 0.36, N = 18 cells, Mann–Whitney test p = 0.0117) B2 The amplitude of sIPSCs was reduced in pyramidal neurons from Tcf4+/tr brain slices compared to WT pyramidal neurons (WT 26.37 ± 0.68, N = 26 cells, Tcf4+/tr 23.74 ± 1.22, N = 18 cells, p = 0.0491) C Representative traces showing mEPSCs recorded from a pyramidal neuron in a WT (black) and Tcf4+/tr (blue) brain slice. C1 The frequency of mEPSCs was not different by genotype (WT 4.39 ± 0.6, N = 12 cells, Tcf4+/tr 4.16 ± 0.53, N = 12 cells, p = 0.7765). C2 The amplitude of mEPSCs was not different by genotype (WT 14.9 ± 0.37, N = 12 cells, Tcf4+/tr 14.97 ± 0.23, N = 11 cells, p = 0.8701). D Representative traces showing mIPSCs recorded from a pyramidal neuron in brain slices from WT (black) and Tcf4+/tr (blue) mice. D1 The frequency of mIPSCs was reduced in pyramidal neurons from Tcf4+/tr brain slices compared to WT pyramidal neurons (WT 3.28 ± 0.44, N = 12 cells, Tcf4+/tr 1.84 ± 0.32, N = 12 cells, p = 0.0144). D2 The amplitude of mIPSCs was not different by genotype (WT 18.94 ± 0.34, N = 12 cells, Tcf4+/tr 17.89 ± 0.55, N = 12 cells, p = 0.1173).

References

    1. Teixeira JR, Szeto RA, Carvalho VMA, Muotri AR, Papes F. Transcription factor 4 and its association with psychiatric disorders. Transl Psychiatry. 2021;11:19. - PMC - PubMed
    1. Chen H-Y, Bohlen JF, Maher BJ. Molecular and cellular function of transcription Factor 4 in Pitt-Hopkins syndrome. Dev Neurosci. 2021;43:159–67. - PMC - PubMed
    1. de Winter CF, Baas M, Bijlsma EK, van Heukelingen J, Routledge S, Hennekam RCM. Phenotype and natural history in 101 individuals with Pitt-Hopkins syndrome through an internet questionnaire system. Orphanet J Rare Dis. 2016;11:37. - PMC - PubMed
    1. Zollino M, Zweier C, Van Balkom ID, Sweetser DA, Alaimo J, Bijlsma EK, et al. Diagnosis and management in Pitt-Hopkins syndrome: first international consensus statement. Clin Genet. 2019;95:462–78. - PubMed
    1. Rannals MD, Hamersky GR, Page SC, Campbell MN, Briley A, Gallo RA, et al. Psychiatric risk gene transcription factor 4 regulates intrinsic excitability of prefrontal neurons via repression of scn10a and KCNQ1. Neuron. 2016;90:43–55. - PMC - PubMed