

Reproducibility in pharmacometrics applied in a phase III trial of BCG-vaccination for COVID-19
- PMID: 37770596
- PMCID: PMC10539503
- DOI: 10.1038/s41598-023-43412-3
Reproducibility in pharmacometrics applied in a phase III trial of BCG-vaccination for COVID-19
Abstract
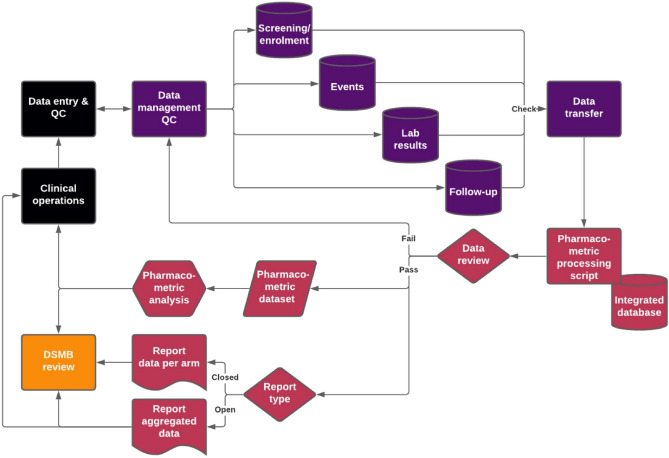
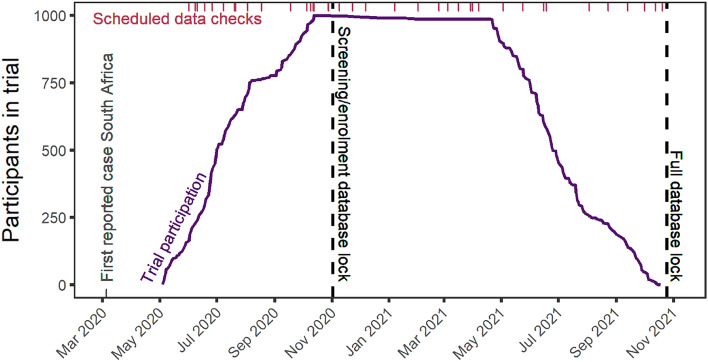
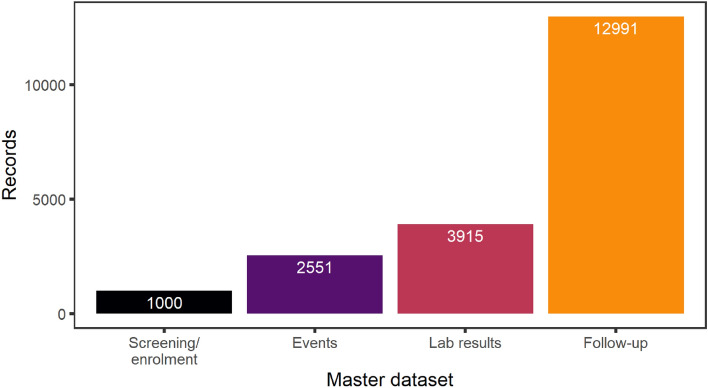
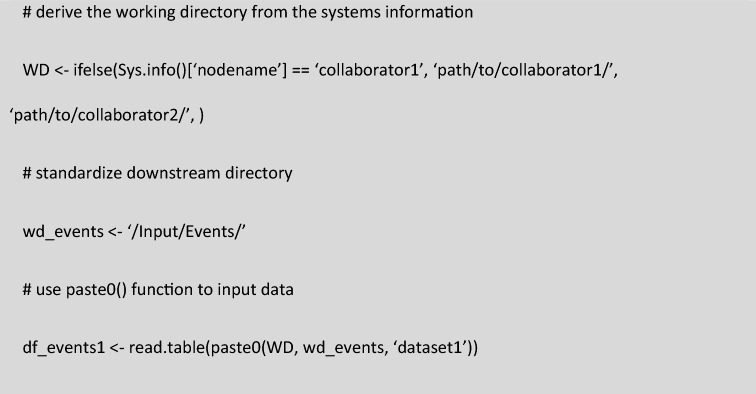
Large clinical trials often generate complex and large datasets which need to be presented frequently throughout the trial for interim analysis or to inform a data safety monitory board (DSMB). In addition, reliable and traceability are required to ensure reproducibility in pharmacometric data analysis. A reproducible pharmacometric analysis workflow was developed during a large clinical trial involving 1000 participants over one year testing Bacillus Calmette-Guérin (BCG) (re)vaccination in coronavirus disease 2019 (COVID-19) morbidity and mortality in frontline health care workers. The workflow was designed to review data iteratively during the trial, compile frequent reports to the DSMB, and prepare for rapid pharmacometric analysis. Clinical trial datasets (n = 41) were transferred iteratively throughout the trial for review. An RMarkdown based pharmacometric processing script was written to automatically generate reports for evaluation by the DSMB. Reports were compiled, reviewed, and sent to the DSMB on average three days after the data cut-off, reflecting the trial progress in real-time. The script was also utilized to prepare for the trial pharmacometric analyses. The same source data was used to create analysis datasets in NONMEM format and to support model script development. The primary endpoint analysis was completed three days after data lock and unblinding, and the secondary endpoint analyses two weeks later. The constructive collaboration between clinical, data management, and pharmacometric teams enabled this efficient, timely, and reproducible pharmacometrics workflow.
© 2023. The Author(s).
Conflict of interest statement
The authors declare no competing interests.
Figures
Similar articles
-
Using BCG vaccine to enhance non-specific protection of health care workers during the COVID-19 pandemic: A structured summary of a study protocol for a randomised controlled trial in Denmark.Trials. 2020 Sep 17;21(1):799. doi: 10.1186/s13063-020-04714-3. Trials. 2020. PMID: 32943115 Free PMC article.
-
BCG revaccination of health workers in Brazil to improve innate immune responses against COVID-19: A structured summary of a study protocol for a randomised controlled trial.Trials. 2020 Oct 26;21(1):881. doi: 10.1186/s13063-020-04822-0. Trials. 2020. PMID: 33106170 Free PMC article. Clinical Trial.
-
Two Randomized Controlled Trials of Bacillus Calmette-Guérin Vaccination to reduce absenteeism among health care workers and hospital admission by elderly persons during the COVID-19 pandemic: A structured summary of the study protocols for two randomised controlled trials.Trials. 2020 Jun 5;21(1):481. doi: 10.1186/s13063-020-04389-w. Trials. 2020. PMID: 32503602 Free PMC article.
-
The influence of vaccination against tuberculosis with the Bacillus-Calmette-Guérin(BCG) vaccine on COVID-19 incidence and mortality - review of the literature.Przegl Epidemiol. 2020;74(2):290-302. doi: 10.32394/pe.74.22. Przegl Epidemiol. 2020. PMID: 33115218 Review.
-
Bacillus calmette-guerin as a quick and temporary solution to coronavirus disease-2019.Int J Mycobacteriol. 2021 Apr-Jun;10(2):105-110. doi: 10.4103/ijmy.ijmy_86_21. Int J Mycobacteriol. 2021. PMID: 34558459 Review.
Cited by
-
Seasonal influence on respiratory tract infection severity including COVID-19 quantified through Markov Chain modeling.CPT Pharmacometrics Syst Pharmacol. 2023 Sep;12(9):1250-1261. doi: 10.1002/psp4.13006. Epub 2023 Jul 10. CPT Pharmacometrics Syst Pharmacol. 2023. PMID: 37401774 Free PMC article.
-
Risk Factors for COVID-19 and Respiratory Tract Infections during the Coronavirus Pandemic.Vaccines (Basel). 2024 Mar 19;12(3):329. doi: 10.3390/vaccines12030329. Vaccines (Basel). 2024. PMID: 38543963 Free PMC article.
-
Standards for model-based early bactericidal activity analysis and sample size determination in tuberculosis drug development.Front Pharmacol. 2023 Apr 13;14:1150243. doi: 10.3389/fphar.2023.1150243. eCollection 2023. Front Pharmacol. 2023. PMID: 37124198 Free PMC article.
References
-
- Mentré F, et al. Pharmacometrics and Systems Pharmacology 2030. CPT Pharmacomet. Syst. Pharmacol. 2020;107:76–78. - PubMed
Publication types
MeSH terms
Substances
LinkOut - more resources
Full Text Sources
Medical
