Meta-Analysis
. 2023 Oct;55(10):1651-1664.
doi: 10.1038/s41588-023-01518-4. Epub 2023 Sep 28.

Multi-ancestry genome-wide study identifies effector genes and druggable pathways for coronary artery calcification

Maryam Kavousi #  1 Maxime M Bos #  2 Hanna J Barnes #  3 Christian L Lino Cardenas #  3 Doris Wong #  4   5 Haojie Lu #  2   6 Chani J Hodonsky #  5 Lennart P L Landsmeer #  7 Adam W Turner  5 Minjung Kho  8   9 Natalie R Hasbani  10 Paul S de Vries  10 Donald W Bowden  11 Sandesh Chopade  12   13 Joris Deelen  14   15 Ernest Diez Benavente  16 Xiuqing Guo  17 Edith Hofer  18   19 Shih-Jen Hwang  20 Sharon M Lutz  21 Leo-Pekka Lyytikäinen  22 Lotte Slenders  7 Albert V Smith  23   24 Maggie A Stanislawski  25 Jessica van Setten  26 Quenna Wong  27 Lisa R Yanek  28 Diane M Becker  28 Marian Beekman  14 Matthew J Budoff  17 Mary F Feitosa  29 Chris Finan  12   13   26 Austin T Hilliard  30 Sharon L R Kardia  8 Jason C Kovacic  31   32   33 Brian G Kral  28 Carl D Langefeld  34 Lenore J Launer  35 Shaista Malik  36 Firdaus A A Mohamed Hoesein  37 Michal Mokry  7   16 Reinhold Schmidt  18 Jennifer A Smith  8   38 Kent D Taylor  17 James G Terry  39 Jeroen van der Grond  40 Joyce van Meurs  2   6 Rozemarijn Vliegenthart  41 Jianzhao Xu  11 Kendra A Young  42 Nuno R Zilhão  24 Robert Zweiker  43 Themistocles L Assimes  30   44 Lewis C Becker  28 Daniel Bos  2   45 J Jeffrey Carr  6 L Adrienne Cupples  46 Dominique P V de Kleijn  47 Menno de Winther  48 Hester M den Ruijter  16 Myriam Fornage  49 Barry I Freedman  50 Vilmundur Gudnason  24   51 Aroon D Hingorani  12   13 John E Hokanson  44 M Arfan Ikram  2 Ivana Išgum  52   53 David R Jacobs Jr  54 Mika Kähönen  55 Leslie A Lange  25 Terho Lehtimäki  22 Gerard Pasterkamp  7 Olli T Raitakari  56   57   58 Helena Schmidt  59 P Eline Slagboom  14 André G Uitterlinden  2   6 Meike W Vernooij  2   47 Joshua C Bis  60 Nora Franceschini  61 Bruce M Psaty  60   62 Wendy S Post  63   64 Jerome I Rotter  17 Johan L M Björkegren  65   66 Christopher J O'Donnell  67   68 Lawrence F Bielak  8 Patricia A Peyser  8 Rajeev Malhotra  3 Sander W van der Laan  7 Clint L Miller  69   70   71
Affiliations
Meta-Analysis

Multi-ancestry genome-wide study identifies effector genes and druggable pathways for coronary artery calcification

Maryam Kavousi et al. Nat Genet. 2023 Oct.

Abstract

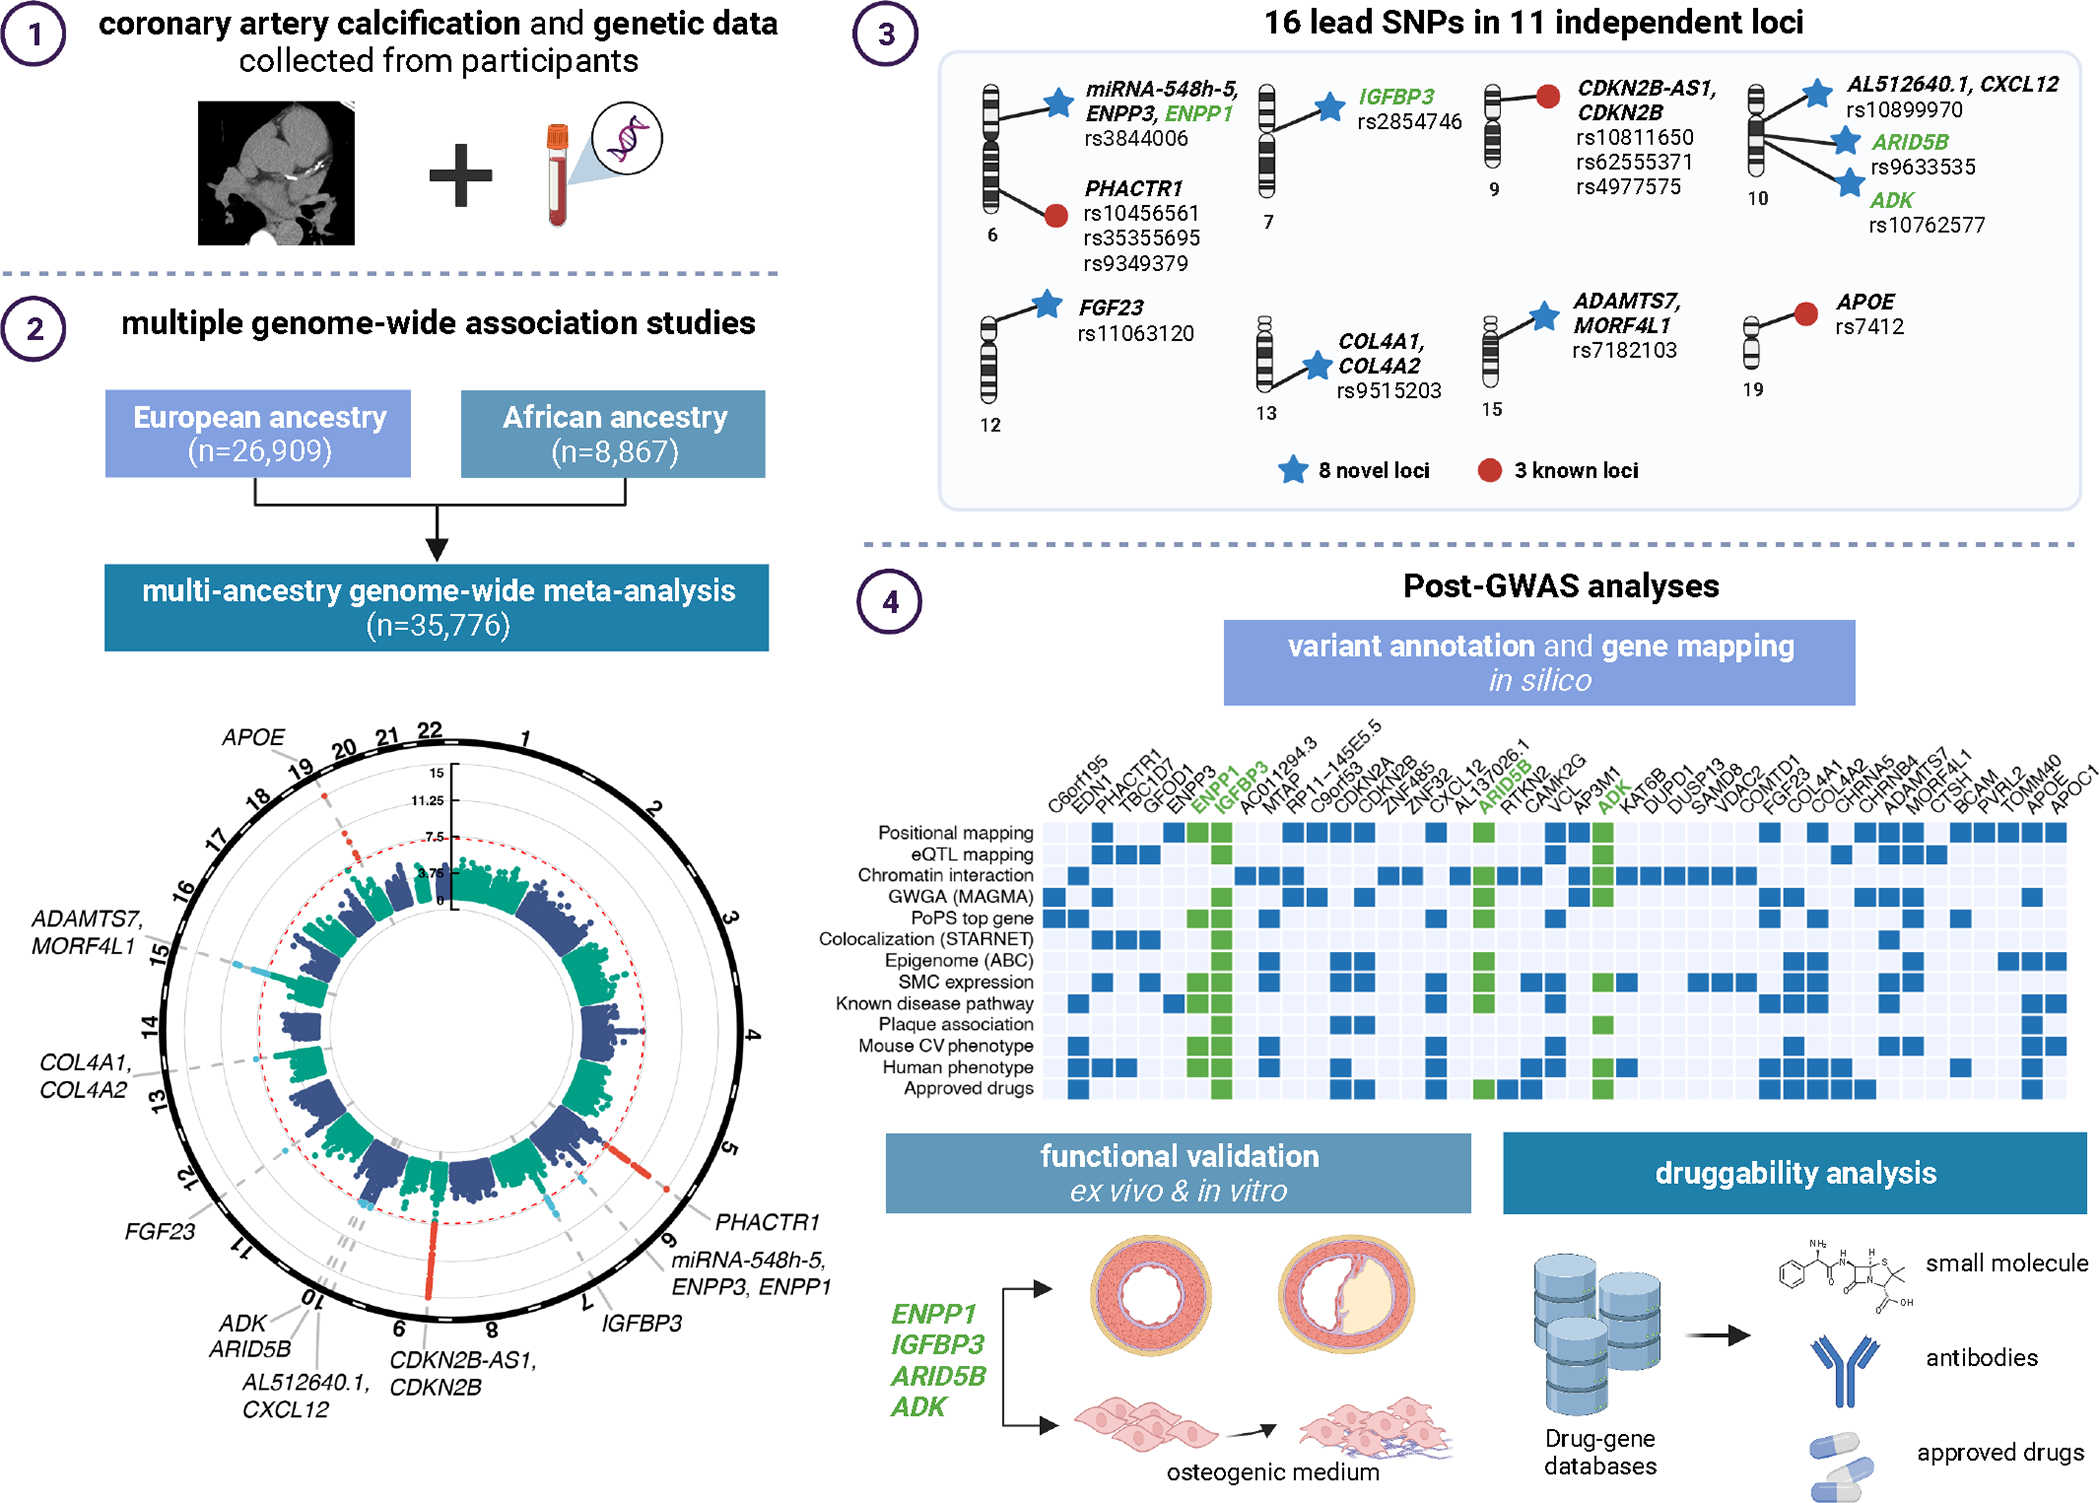
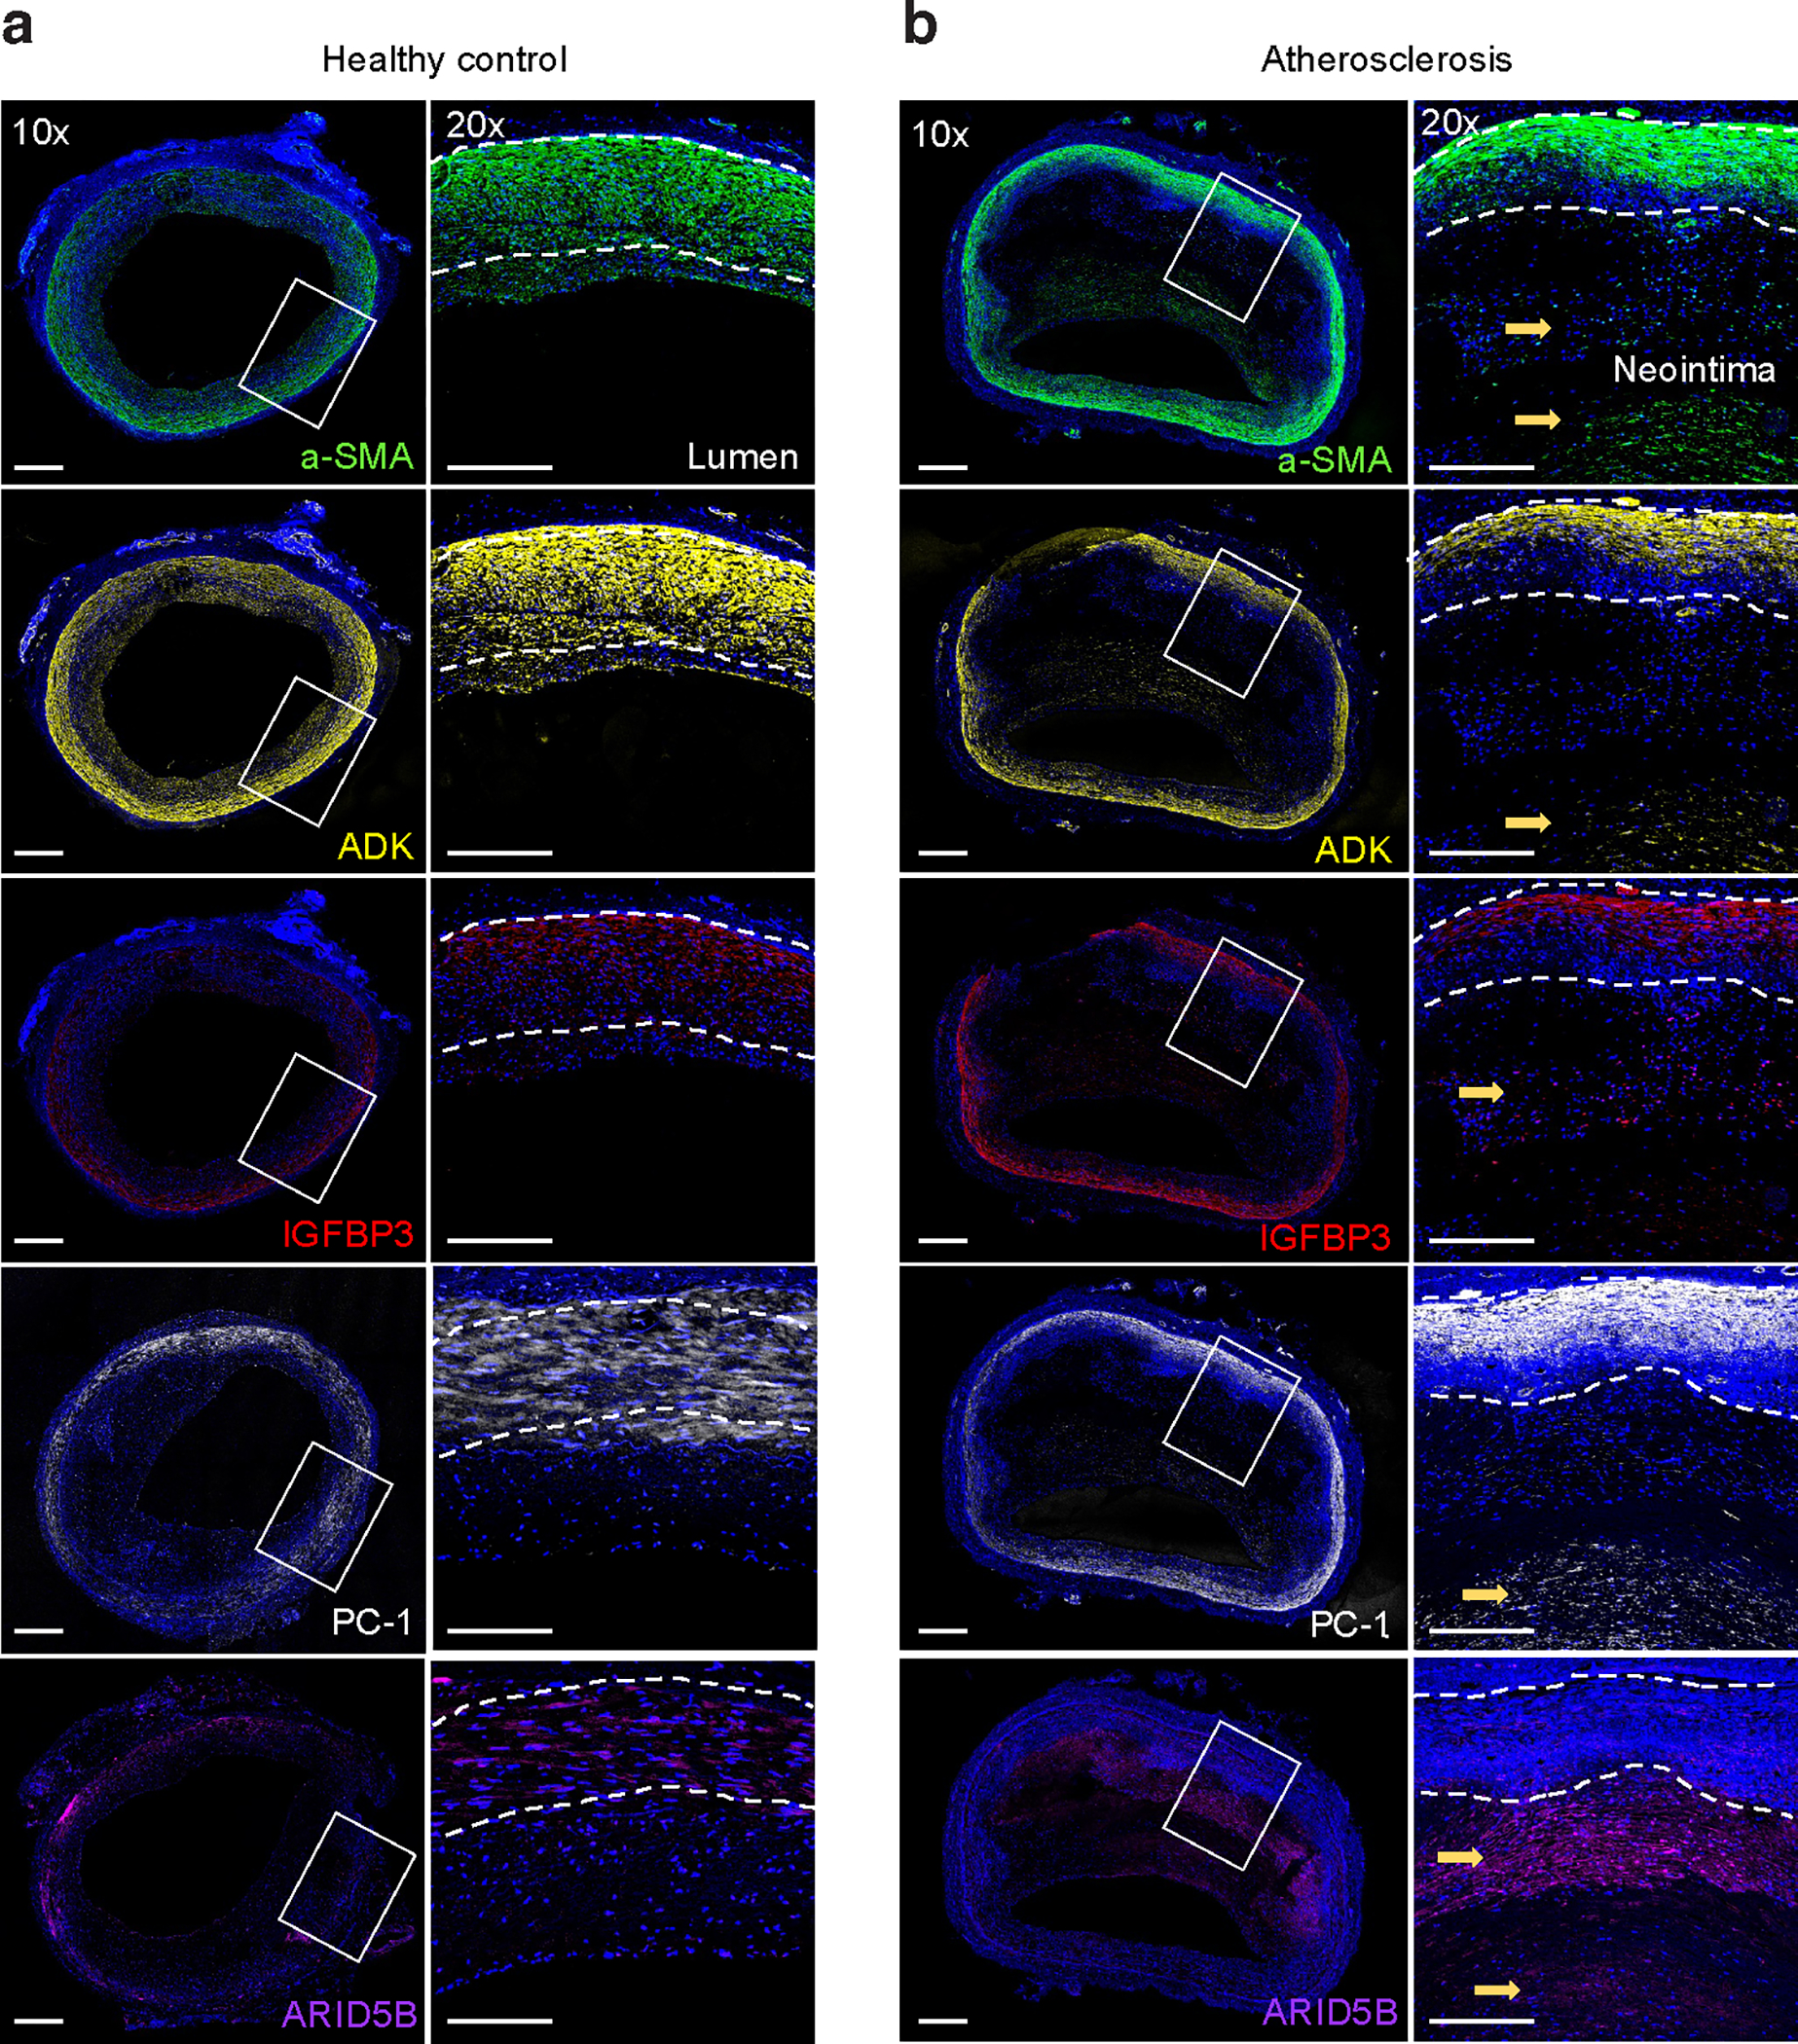
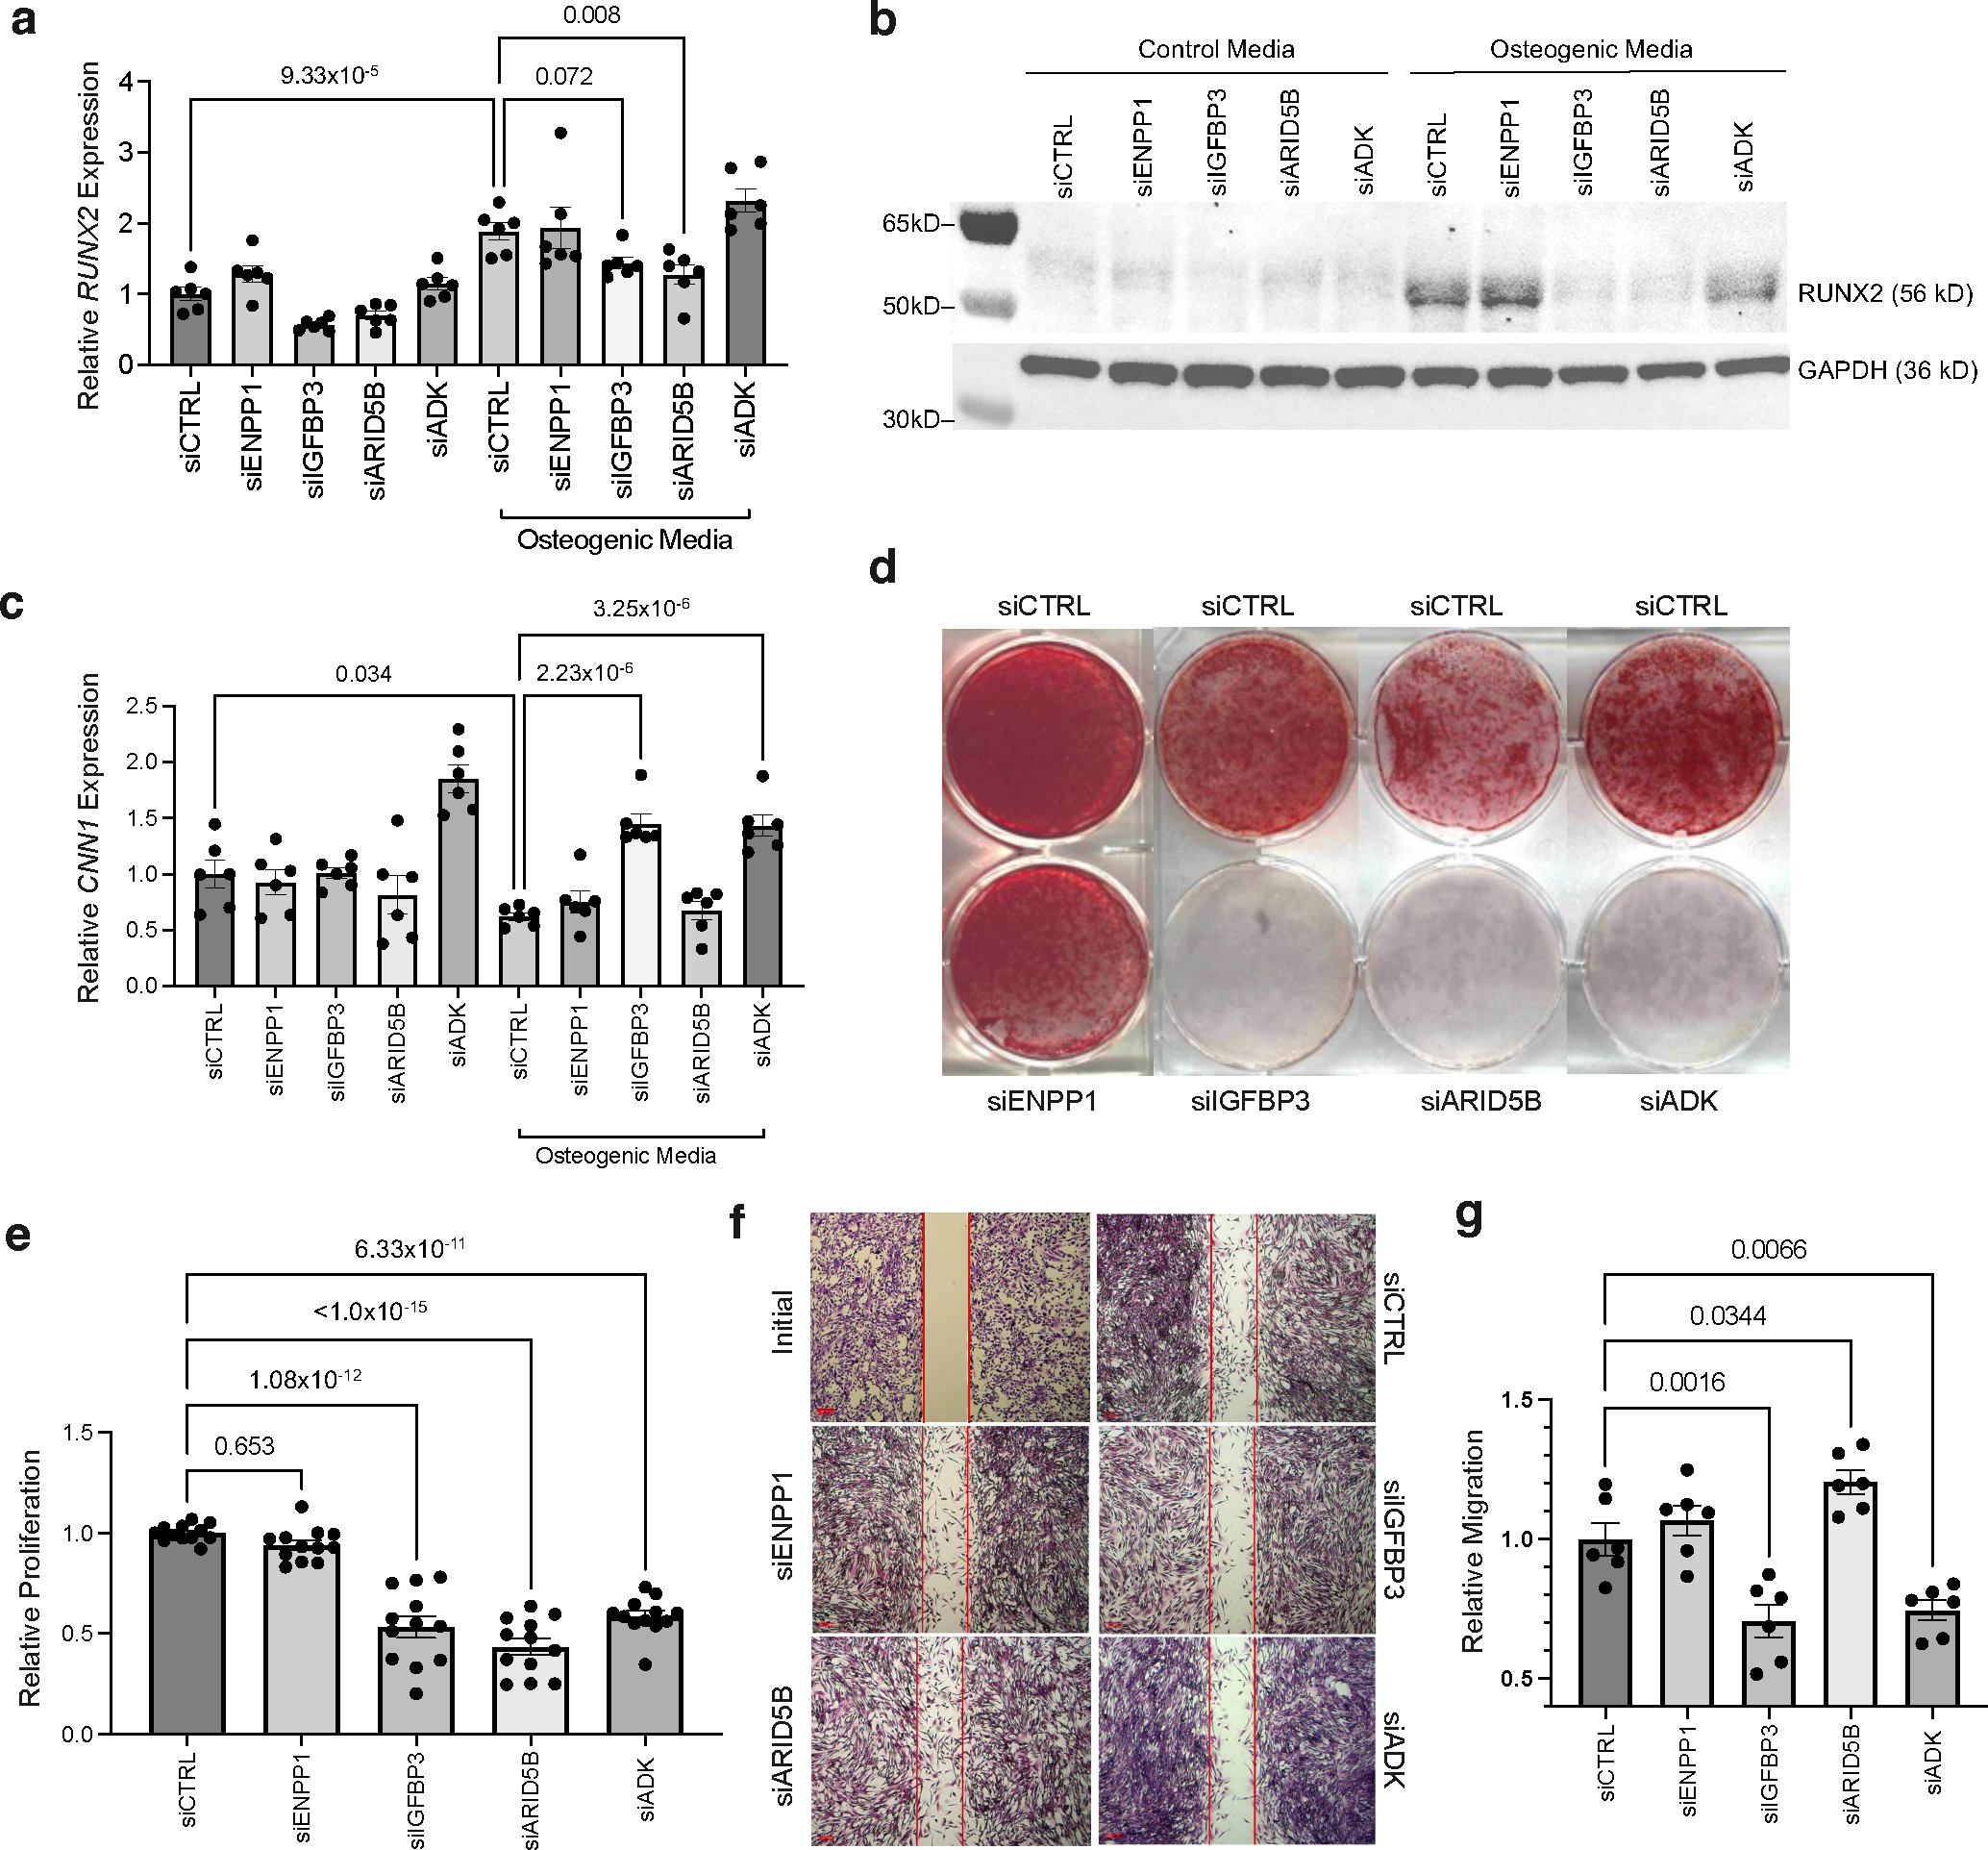
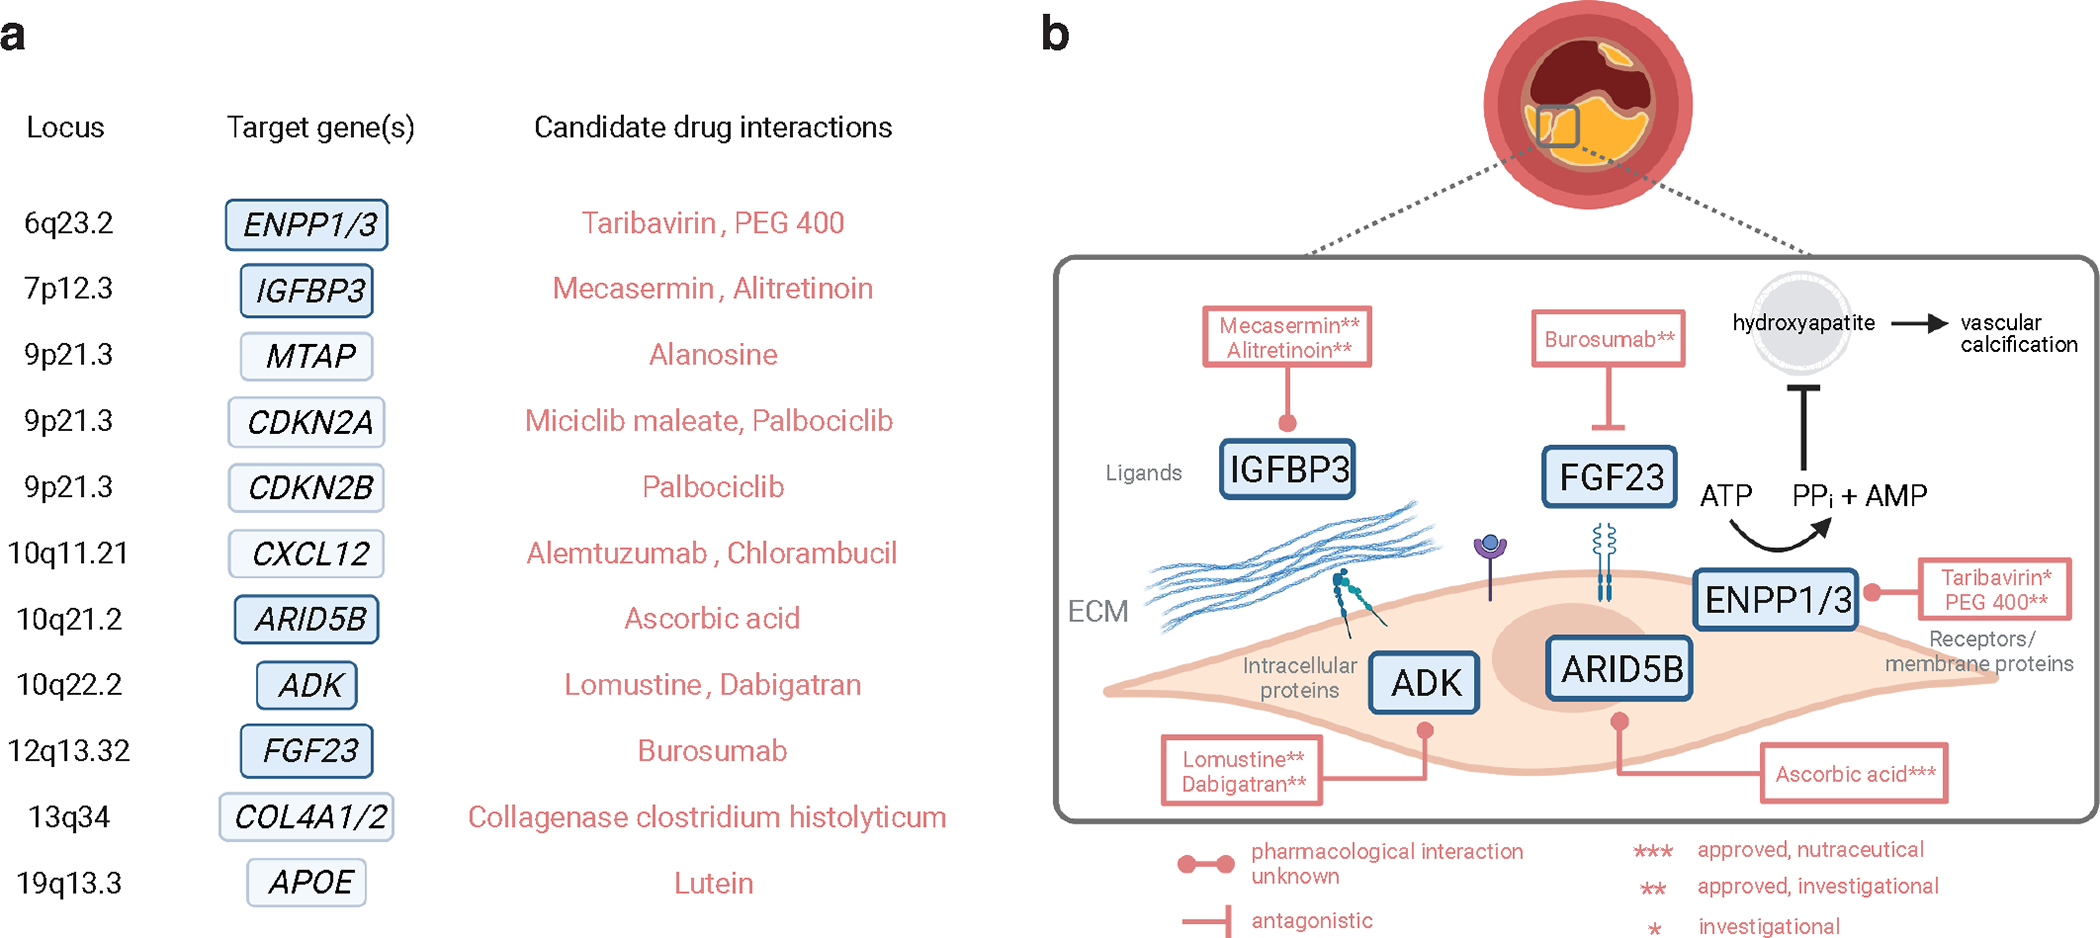
Coronary artery calcification (CAC), a measure of subclinical atherosclerosis, predicts future symptomatic coronary artery disease (CAD). Identifying genetic risk factors for CAC may point to new therapeutic avenues for prevention. Currently, there are only four known risk loci for CAC identified from genome-wide association studies (GWAS) in the general population. Here we conducted the largest multi-ancestry GWAS meta-analysis of CAC to date, which comprised 26,909 individuals of European ancestry and 8,867 individuals of African ancestry. We identified 11 independent risk loci, of which eight were new for CAC and five had not been reported for CAD. These new CAC loci are related to bone mineralization, phosphate catabolism and hormone metabolic pathways. Several new loci harbor candidate causal genes supported by multiple lines of functional evidence and are regulators of smooth muscle cell-mediated calcification ex vivo and in vitro. Together, these findings help refine the genetic architecture of CAC and extend our understanding of the biological and potential druggable pathways underlying CAC.


Conflict of interest statement

Competing Interests

S.W.v.d.L. has received Roche funding for unrelated work. B.M.P. serves on the Steering Committee of the Yale Open Data Access Project funded by Johnson & Johnson. R.M. receives research funding from Angea Biotherapeutics and Amgen and serves as a consultant for Myokardia/BMS, Renovacor, Epizon Pharma, and Third Pole, all unrelated to the current project. C.L.M. has received funding from AstraZeneca on an unrelated project. J.C.K. is the recipient of an Agilent Thought Leader Award (January 2022), which includes funding for research that is unrelated to the current manuscript. All other co-authors confirm that they have no conflicts of interest related to the presented work.

Figures

Figure 1 |
Figure 1 |. Study summary.
Schematic of study design and meta-analysis for CAC in European and African ancestry participants (1 and 2), main results identifying 16 lead SNPs in 11 loci (3), and post-GWAS analyses involving variant annotation and gene mapping in silico, functional validation in vitro, and druggability analysis (4). Figure created in BioRender.
Figure 2 |
Figure 2 |. Prioritization of CAC causal genes using STARNET eQTLs.
a,b, Summary-based Mendelian Randomization (SMR) to identify causal CAC genes using subclinical atherosclerotic mammary artery (MAM, a) and atherosclerotic aortic root (AOR, b) tissue cis-eQTLs in STARNET. Dashed black and red lines indicate SMR P-value significance thresholds for tested CAC and CAD candidate genes, respectively. Teal green dots represent significant genes for both CAC and CAD, while blue dots represent those only significant for CAC. SMR P-value determined by approximate chi-square test statistic for mediating effect of gene expression on CAC or CAD. c,d, Coloc-based colocalization analysis of CAC and CAD candidate genes using STARNET MAM (c) and AOR (d) cis-eQTLs. Dashed black lines indicate high colocalization (PP4 > 0.8) and dashed red lines indicate low colocalization (PP4 < 0.5) thresholds, respectively. Teal green dots represent high colocalized genes (PP4 > 0.8) for both CAC and CAD, whereas blue dots represent those highly colocalized for CAC (PP4 > 0.8) but not CAD (PP4 < 0.5).
Figure 3 |
Figure 3 |. Single-nucleus coronary epigenomic annotation of ARID5B and IGFBP3 CAC loci.
a,b, Top, ARID5B (a) and IGFBP3 (b) locus association plots showing CAC meta-analysis results in European and African American ancestry individuals with credible set SNPs color coded by posterior probability (red). Meta-analysis P-values determined from weighted Z-scores in fixed effects model and central association P-values determined from chi-square test statistic. Bottom, overlapping chromatin accessibility profiles in coronary artery cell types determined by bulk and single-nucleus ATAC-seq. Peak2gene links highlight predicted enhancer promoter interactions across all cell types with those overlapping CAC SNPs shown in black. Light grey box highlights lead SNP at each locus. SMC, smooth muscle cells; T/NK: T-cells or natural killer cells.
Figure 4 |
Figure 4 |. Genetic correlations for CAC and Mendelian randomization for cardiovascular disease risk factors.
a, Cross-trait LD-score regression-based genetic correlation of CAC quantity with cardiovascular disease risk factors, anthropomorphic risk factors, family history, subclinical and clinical cardiovascular disease using European ancestry CAC and UK Biobank trait associations. Vertical dashed line set at genetic covariance = 0. Values represent the genetic correlation estimates using the slope from the regression of the product of Z-scores from two GWAS studies on the LD score and error bars represent the standard error estimates of the LD score. P-values (two-tailed) are computed from chi-square test statistics. b, Mendelian randomization (MR) results showing causal effects of cardiovascular disease and anthropomorphic risk factors on CAC quantity using the inverse variance-weighted method (IVW). Values represent the mean odds ratio and error bars reflect the 95% confidence intervals. P-values (two-tailed t test) < 7.14 × 10⁻³ (0.05/7) are considered statistically significant. Vertical dashed line set at odds ratio = 1.0. c, MR results showing causal effects of CAC quantity on coronary artery disease (CAD) using either 16 independent lead SNPs at the 11 CAC loci or 5 lead SNPs from the 5 CAC-specific loci (separated by horizontal dashed line). Values represent the mean odds ratio and error bars reflect the 95% confidence intervals. P-values (two-tailed t test) < 0.05 are considered statistically significant. Different MR methods used are shown, including MR-Egger, IVW, and Weighted median. Sample sizes for a-c are provided in Supplementary Tables 15 and 16. LDL, low-density lipoprotein; HDL, high-density lipoprotein; cIMT: carotid intima-media thickness.
Figure 5 |
Figure 5 |. Immunofluorescence staining showing localization of ENPP1, IGFBP3, ARID5B and ADK in control and atherosclerotic human coronary arteries.
a,b, Transverse sections of healthy control (a) and atherosclerotic (b) human coronary arteries were stained for alpha-smooth muscle actin (α-SMA) (green), DAPI nuclei marker (blue), ENPP1/PC-1 (white), IGFBP3 (red), ARID5B (purple), and ADK (yellow). High levels of ENPP1/PC-1, IGFBP3, ARID5B, and ADK were observed in the neointimal layer of atherosclerotic diseased coronary arteries. Whole artery images were captured at 10× magnification and regions of interest were captured at 20×. Images are representative of n = 4 independent donors per group.
Figure 6 |
Figure 6 |. Functional assays of ENPP1, IGFBP3, ARID5B, and ADK in coronary artery calcification and vascular smooth muscle cell phenotype.
a, Effects of siRNA-mediated knockdown of ENPP1, IGFBP3, ARID5B, and ADK on osteogenic marker RUNX2 gene expression in human coronary artery smooth muscle cells (HCASMCs) cultured in control or osteogenic media (OM). n = 6 biological replicates per group. b, Western blot analysis of RUNX2 protein levels in HCASMCs cultured in basal control or OM and transfected with siCTRL, siENPP1, siIGFBP3, siARID5B, or siADK. GAPDH was used as a loading control. c, Effects of siRNA knockdown on CNN1 mRNA expression. n = 6 biological replicates per group. d, Calcification assessed by Alizarin Red staining in HCASMCs cultured in OM and transfected with siCTRL, siENPP1, siIGFBP3, siARID5B, or siADK. Representative images from three independent experiments. e, MTT assay-based proliferation in HCASMCs transfected with siCTRL, siENPP1, siIGFBP3, siARID5B or siADK. n = 12 biological replicates per treatment and control group; each individual sample read three times; value reported represents the mean of three technical replicates. f,g, Scratch wound-based migration assay in HCASMCs transfected with siCTRL, siENPP1, siIGFBP3, siARID5B or siADK, as quantified in g. An initial image of the assay is provided to demonstrate creation of a cell-free gap, prior to incubation with OM. n = 6 biological replicates per treatment and control group. Scale bars, 200 μm. All statistical comparisons shown were made using a two-tailed one-way ANOVA with Sidak’s test for multiple comparisons. Values in a-g represent mean ± standard error of the mean. Full-length blots are provided as Source Data.
Figure 7 |
Figure 7 |. Schematic of CAC candidate genes and approved or investigational drugs.
a, Summary of gene-drug interactions for CAC candidate genes using DGIdb and DrugBank databases. Novel CAC-specific genes are shown in blue and other genes are shown in light blue corresponding to each genomic locus. Generic names for the top interacting drugs/compounds are shown for each target in red. b, Schematic showing the cellular location of the protein targets for novel CAC genes. Names of interacting approved drugs or compounds under investigation are shown along with predicted pharmacological interaction if known. ECM, extracellular matrix; ATP, adenosine triphosphate; AMP, adenosine monophosphate; PPi, inorganic pyrophosphate; PEG, polyethylene glycol. Figure created in BioRender.

References

    1. Timmis A et al. European society of cardiology: Cardiovascular disease statistics 2017. Eur. Heart J. 39, 508–579 (2018). - PubMed
    1. Tsao CW et al. Heart Disease and Stroke Statistics-2022 Update: A Report From the American Heart Association. Circulation 145, e153–e639 (2022). - PubMed
    1. Libby P, Ridker PM & Hansson GK Progress and challenges in translating the biology of atherosclerosis. Nature 473, 317–325 (2011). - PubMed
    1. Baber U et al. Prevalence, impact, and predictive value of detecting subclinical coronary and carotid atherosclerosis in asymptomatic adults: the BioImage study. J. Am. Coll. Cardiol. 65, 1065–1074 (2015). - PubMed
    1. Polonsky TS et al. Coronary artery calcium score and risk classification for coronary heart disease prediction. JAMA 303, 1610–1616 (2010). - PMC - PubMed

Methods-only References

    1. Mägi R et al. Trans-ethnic meta-regression of genome-wide association studies accounting for ancestry increases power for discovery and improves fine-mapping resolution. Hum. Mol. Genet. 26, 3639–3650 (2017). - PMC - PubMed
    1. Winkler TW et al. EasyStrata: evaluation and visualization of stratified genome-wide association meta-analysis data. Bioinformatics 31, 259–261 (2015). - PMC - PubMed
    1. Randall JC et al. Sex-stratified genome-wide association studies including 270,000 individuals show sexual dimorphism in genetic loci for anthropometric traits. PLoS Genet. 9, e1003500 (2013). - PMC - PubMed
    1. Wang K, Li M & Hakonarson H ANNOVAR: functional annotation of genetic variants from high-throughput sequencing data. Nucleic Acids Res. 38, e164 (2010). - PMC - PubMed
    1. Storey JD & Tibshirani R Statistical significance for genomewide studies. Proceedings of the National Academy of Sciences 100, 9440–9445 (2003). - PMC - PubMed

Publication types