. 2023 Sep 28;6(1):993.
doi: 10.1038/s42003-023-05373-1.

Structure of the human ATAD2 AAA+ histone chaperone reveals mechanism of regulation and inter-subunit communication

Affiliations

Structure of the human ATAD2 AAA+ histone chaperone reveals mechanism of regulation and inter-subunit communication

Carol Cho et al. Commun Biol. .

Abstract

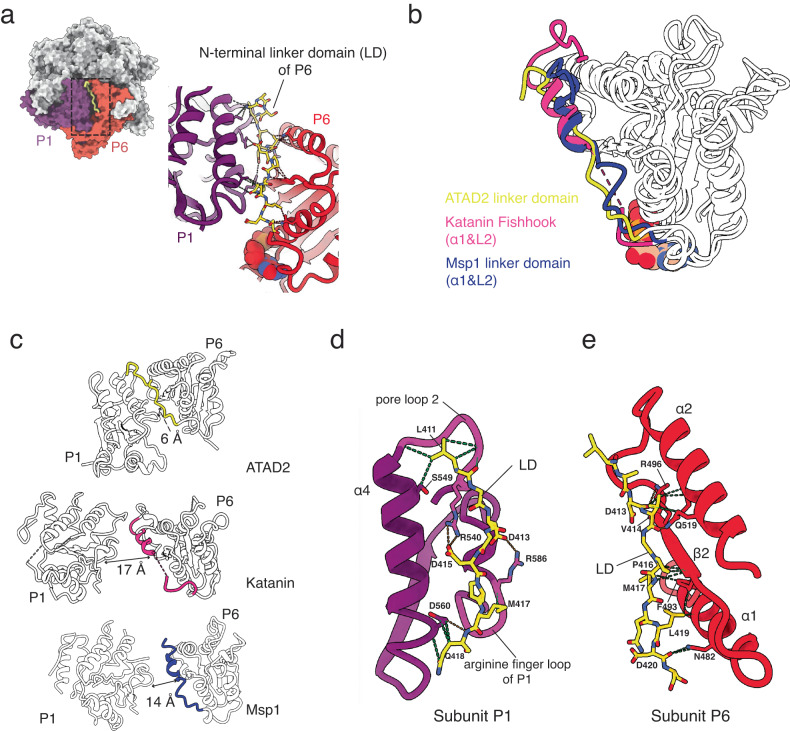
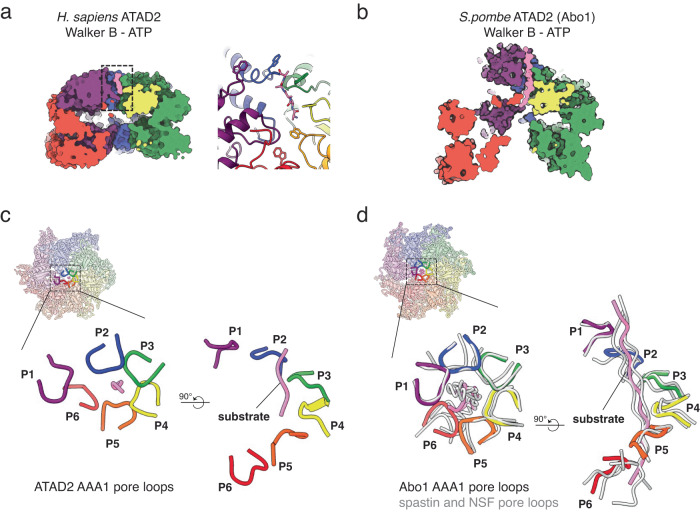
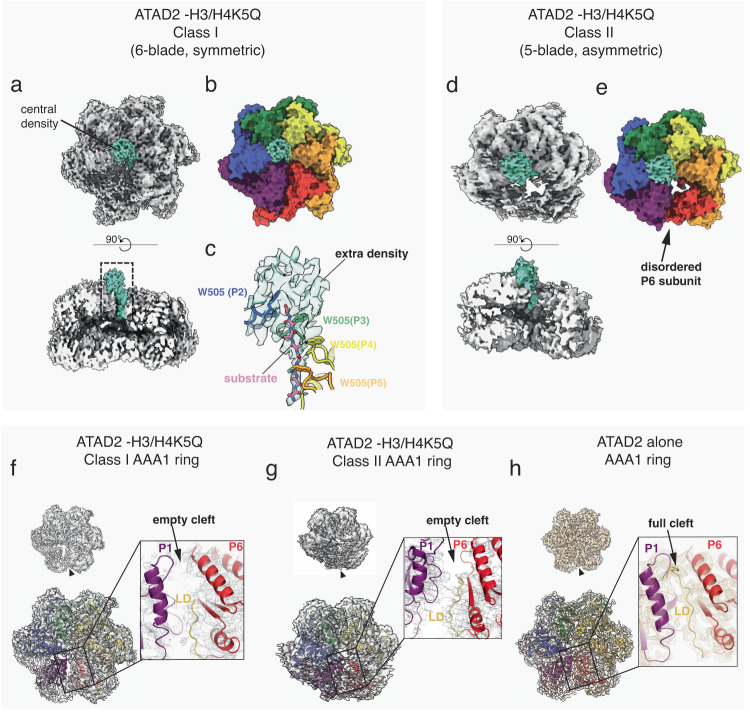
ATAD2 is a non-canonical ATP-dependent histone chaperone and a major cancer target. Despite widespread efforts to design drugs targeting the ATAD2 bromodomain, little is known about the overall structural organization and regulation of ATAD2. Here, we present the 3.1 Å cryo-EM structure of human ATAD2 in the ATP state, showing a shallow hexameric spiral that binds a peptide substrate at the central pore. The spiral conformation is locked by an N-terminal linker domain (LD) that wedges between the seam subunits, thus limiting ATP-dependent symmetry breaking of the AAA+ ring. In contrast, structures of the ATAD2-histone H3/H4 complex show the LD undocked from the seam, suggesting that H3/H4 binding unlocks the AAA+ spiral by allosterically releasing the LD. These findings, together with the discovery of an inter-subunit signaling mechanism, reveal a unique regulatory mechanism for ATAD2 and lay the foundation for developing new ATAD2 inhibitors.


Conflict of interest statement

J.-J.S. is a co-founder and CTO of Epinogen. All other authors declare no competing interests.

Figures

Fig. 1
Fig. 1. Cryo-EM structure determination of ATAD2.
a Primary structure of full-length ATAD2 and the tagged and truncated ATAD2 construct used for structure determination. b 2D class averages of ATAD2 Walker B mutant. c, d Top, side, and bottom views of the final sharpened density map of ATAD2 Walker B mutant hexameric ring contoured at σ = 5.5 (c), and color coded by domain with color scheme in Fig. 1a (d). e Surface representation of ATAD2 model colored by chain. f Schematic of ATAD2 monomer (chain A) with bound nucleotide, colored by domain. Dotted lines represent connectivity and approximate positions of domains that are unresolved in the cryo-EM map.
Fig. 2
Fig. 2. ATAD2 structure in comparison with Abo1.
ac Hexameric structures of human ATAD2 Walker B mutant with ATP (a), Abo1 Walker B mutant with ATP (b PDB ID:6JQ0), and Abo1 with ADP (c PDB ID:6JPQ) colored by subunit (P1-P6). Dotted boxes represent spiral seam and are shown as isolated views in d, e. d, e Seam subunits P1 (purple) and P6 (red) from human ATAD2 Walker B mutant (d) and Abo1 Walker B mutant (e), showing differences in inter-subunit packing. (NBD: AAA+ nucleotide binding domain, HBD: AAA+ helical bundle domain). The AAA1 HBD of P1 and P6 are indicated with lighter hues. f, g Subunits P3-P5 of ATAD2 Walker B mutant (f) and Abo1 Walker B mutant (g). Interlocking knob-holes and linker arms are highlighted in (g) with dotted circles and arrowheads. h Superimposition of ATAD2 and Abo1 subunits. ATAD2 is shown in light blue and Abo1 in gray. The AAA2-ɑ0 insert knob and linker arm of Abo1 are highlighted in magenta.
Fig. 3
Fig. 3. ATAD2 nucleotide pockets and subunits.
a Nucleotide pocket occupancy of hexameric ATAD2. b Closeup view of nucleotide binding pockets of ATAD2 showing nucleotide identity, gate loop position, and arginine fingers. Density map for nucleotide (contoured at σ = 4.5) is shown and arginine finger residues R586 and R589 are labeled. ɑ3- β4 gate loops are labeled in black with side chains of conserved residues D560 and L562 shown. Density map for gate loops are shown in Supplementary Fig. 4d. c Comparison of ɑ3-β4 gate loop conformation in ATAD2 subunits P1-P6. d Position of gate loops with respect to nucleotide binding pockets in the ATAD2 hexamer. Gate loops are colored black, with closed gate loops indicated with a red arrowhead, and open gate loops with a black arrowhead.
Fig. 4
Fig. 4. Structure of the ATAD2 N-terminal linker domain (LD).
a Position of the ATAD2 subunit P6 N-terminal LD (yellow) wedged between subunit P1 (purple) and P6 (red) in the hexameric spiral. (Density map of N-terminal LD is shown in Supplementary Fig. 4b) b Superimposition of the large nucleotide binding domains of ATAD2, katanin (PDB ID: 6UGD) and Msp1 (PDB ID: 6PE0) highlighting the position of the LD with respect to the nucleotide binding domain body in yellow, hot pink, and blue, respectively. c Comparison of distance from P6 LD to adjacent P1 subunit in ATAD2, katanin, and Msp1. Labeled distances are measured from middle of P6 LD ɑ1 helix to P1 arginine finger. d, e Detailed hydrogen (orange) and van der Waals interactions (green) of the ATAD2 P6 LD with (d) the P1 subunit ɑ4 helix, pore loop 2, and arginine finger loop (pore loop 2 and arginine finger loop highlighted in magenta), and (e) the P6 subunit ɑ1, ɑ2 helix, and β2 sheet.
Fig. 5
Fig. 5. ATAD2 substrate binding at the AAA+ pore.
a, b Cut-open side view showing a substrate (pink) bound to the pore of ATAD2 (a) and Abo1 (b). Boxed region in (a) is shown in detail at right showing ATAD2 pore loop staircase with W505A surrounding a peptide substrate (density map for substrate is shown in Supplementary Fig. 4c.). c Configuration of ATAD2 AAA1 pore loops 1 (colored by chain) surrounding a peptide substrate (pink) at the central pore of the ATAD2 hexameric ring. d Configuration of Abo1 AAA1 pore loops 1 (colored by chain, PDB ID: 6JQ0) surrounding a central peptide substrate (pink), superimposed with pore loops and peptide substrate of the AAA+ ATPases spastin (gray, PDB ID: 6PEN) and NSF (gray, PDB ID:6MDO).
Fig. 6
Fig. 6. Asymmetric structures and substrate binding of the ATAD2-H3/H4 complex.
a Density map of ATAD2 Walker B mutant-H3/H4 complex class I (contoured at σ = 3.5). Extra central density after subtraction of AAA+ domains from map is colored in teal. b Surface representation of AAA+ domains (colored by subunit) overlayed with extra central density map (teal). c Detailed view of boxed region in (a), showing the central peptide substrate surrounded by the pore loop staircase, and extra globular density connecting to the peptide substrate. d Density map of the asymmetric structure of the ATAD2 Walker B mutant-H3/H4 complex class II (contoured at σ = 3.5). Extra central density after subtraction of AAA+ domains from map is colored in teal. e Surface representation of AAA+ domains (colored by subunit) overlayed with extra central density map (teal). P6 subunit is disordered in Class II structure, with no density for AAA+ helical bundle domains (HBD). fh Density maps (contoured at σ = 3.5) and structures of AAA1 domains in ATAD2 Walker B mutant-H3/H4 complex class I (f), complex class II (g), and ATAD2 Walker B mutant alone (h). Arrowhead indicates seam (P1/P6 subunit interface). Boxed region shows detailed density map of seam and LD. LD model includes amino acids 408-423 in (h) and amino acids 414-423 in (f) and (g).

Similar articles

Cited by

References

    1. Caron C, et al. Functional characterization of ATAD2 as a new cancer/testis factor and a predictor of poor prognosis in breast and lung cancers. Oncogene. 2010;29:5171–5181. - PubMed
    1. Boussouar F, Jamshidikia M, Morozumi Y, Rousseaux S, Khochbin S. Malignant genome reprogramming by ATAD2. Biochim Biophys. Acta. 2013;1829:1010–1014. - PubMed
    1. Ciro M, et al. ATAD2 is a novel cofactor for MYC, overexpressed and amplified in aggressive tumors. Cancer Res. 2009;69:8491–8498. - PubMed
    1. Luo Y, et al. ATAD2 overexpression identifies colorectal cancer patients with poor prognosis and drives proliferation of cancer cells. Gastroenterol. Res. Pr. 2015;2015:936564. - PMC - PubMed
    1. Kalashnikova EV, et al. ANCCA/ATAD2 overexpression identifies breast cancer patients with poor prognosis, acting to drive proliferation and survival of triple-negative cells through control of B-Myb and EZH2. Cancer Res. 2010;70:9402–9412. - PMC - PubMed

Publication types

MeSH terms