Clinical Trial
. 2023 Oct;29(10):2615-2624.
doi: 10.1038/s41591-023-02561-8. Epub 2023 Sep 28.

Garetosmab in fibrodysplasia ossificans progressiva: a randomized, double-blind, placebo-controlled phase 2 trial

Affiliations
Clinical Trial

Garetosmab in fibrodysplasia ossificans progressiva: a randomized, double-blind, placebo-controlled phase 2 trial

Maja Di Rocco et al. Nat Med. 2023 Oct.

Abstract

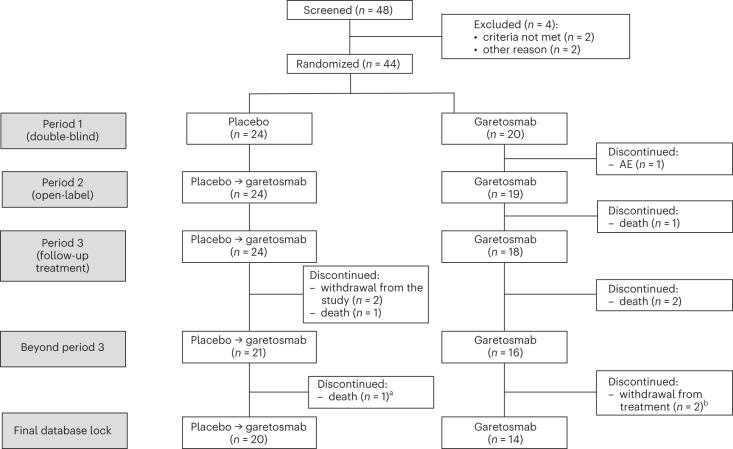
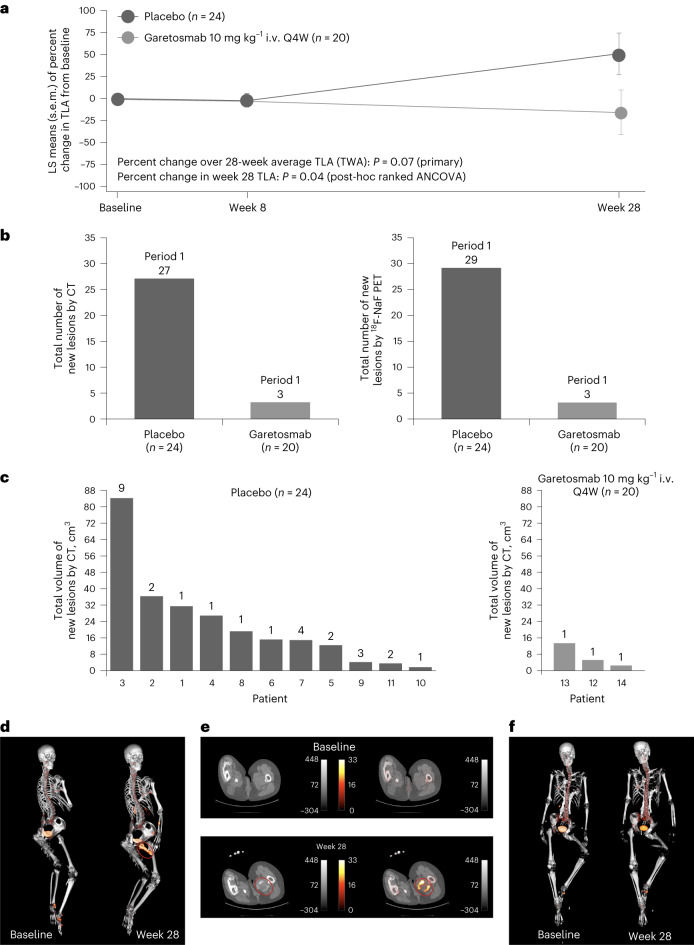
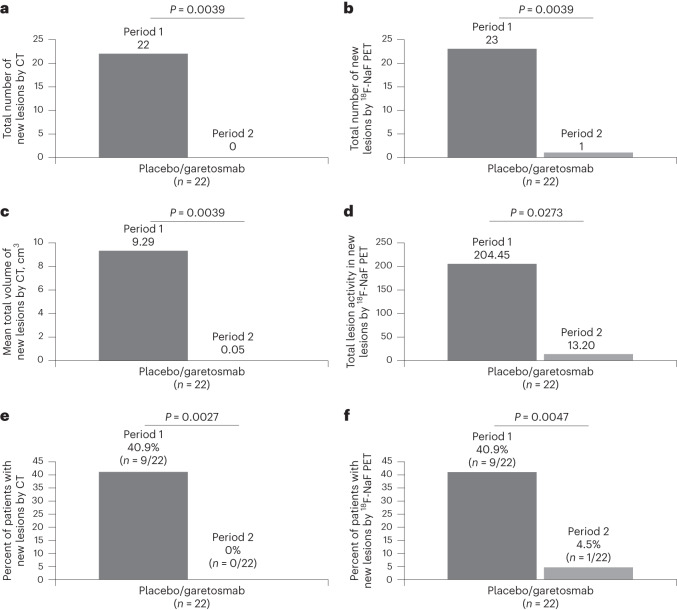
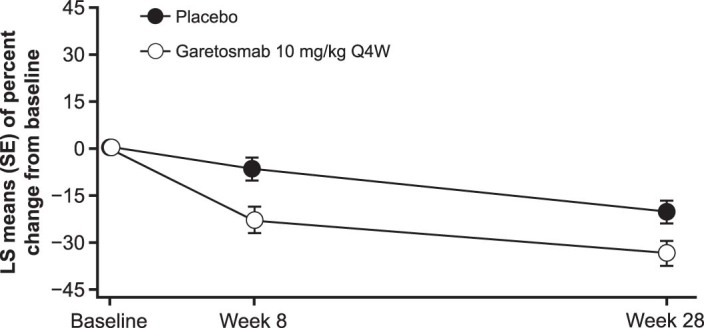
Fibrodysplasia ossificans progressiva (FOP) is a rare disease characterized by heterotopic ossification (HO) in connective tissues and painful flare-ups. In the phase 2 LUMINA-1 trial, adult patients with FOP were randomized to garetosmab, an activin A-blocking antibody (n = 20) or placebo (n = 24) in period 1 (28 weeks), followed by an open-label period 2 (28 weeks; n = 43). The primary end points were safety and for period 1, the activity and size of HO lesions. All patients experienced at least one treatment-emergent adverse event during period 1, notably epistaxis, madarosis and skin abscesses. Five deaths (5 of 44; 11.4%) occurred in the open-label period and, while considered unlikely to be related, causality cannot be ruled out. The primary efficacy end point in period 1 (total lesion activity by PET-CT) was not met (P = 0.0741). As the development of new HO lesions was suppressed in period 1, the primary efficacy end point in period 2 was prospectively changed to the number of new HO lesions versus period 1. No placebo patients crossing over to garetosmab developed new HO lesions (0% in period 2 versus 40.9% in period 1; P = 0.0027). Further investigation of garetosmab in FOP is ongoing. ClinicalTrials.gov identifier NCT03188666 .


Conflict of interest statement

M.D.R. is a principal investigator (PI) of Regeneron Pharmaceuticals and Ipsen trials. E.F.-N., C.P.-C., N.S., P.H., B.J.M., A.B., K.M., S.J.M., A.J.R., A.N.E., D.G.T., G.A.H., S.J.O., R.D., D.M.W. and G.D.Y. are employees of and hold stocks and shares in Regeneron Pharmaceuticals. R.J.P. is a PI of the Regeneron Pharmaceuticals LUMINA-1 and Clementia/Ipsen MOVE trials; a founding member and immediate past president of the International Clinical Council on FOP; and chair of the International Clinical Council Publications Committee. R.K. is a PI of clinical trials sponsored by Clementia/Ipsen and Regeneron Pharmaceuticals and is a non-paid member of the International Clinical Council on FOP and IFOPA registry advisory board. P.O. is a PI of clinical trials sponsored by Regeneron Pharmaceuticals. T.F.-B. is a sub-investigator of the Regeneron Pharmaceuticals LUMINA-1 trial and PI of IPSEN FALKON trial. C.R. has received research grants to their institution from Regeneron Pharmaceuticals. S.K. is a sub-investigator of the Regeneron Pharmaceuticals LUMINA-1 trial. A.M. is a sub-investigator in clinical trials sponsored by Regeneron Pharmaceuticals and Clementia-Ipsen. J.S.B. is a sub-investigator of the Regeneron Pharmaceuticals LUMINA-1 and Clementia/Ipsen MOVE trials. J.T. received grants to their institution (University Rzeszów) as a speaker for Merck and Novartis, and is a hired scientific expert for SoftSystem. M.S. is a speaker for Roche. J.B.-C. is an investigator of a clinical trial sponsored by Regeneron Pharmaceuticals. A.M.C. received a grant to their institution (University Health Network) for a clinical trial. K.M.D. is a PI on the Regeneron Pharmaceuticals LUMINA-1 trial. This project was supported by CTSA award no. UL1 TR002243 from the National Center for Advancing Translational Sciences. Its contents are solely the responsibility of the authors/sponsor and do not necessarily represent official views of the National Center for Advancing Translational Sciences or the National Institutes of Health. E.B. is a sub-investigator of the Regeneron Pharmaceuticals LUMINA-1 trial at Amsterdam UMC, The Netherlands. P.G.R. is a sub-investigator of the Regeneron Pharmaceuticals LUMINA-1 trial at Amsterdam UMC, The Netherlands. M.A.M. is a PI of clinical trials sponsored by Clementia/Ipsen, Regeneron Pharmaceuticals and Incyte; and is a non-paid member of the International Clinical Council on FOP and IFOPA registry advisory board. L.T. received a grant to their institution (University Health Network) for a clinical trial (as a sub-investigator). E.M.W.E. receives subsidies/financing FOP research from the Dutch FOP Patient Foundation, IFOPA, Regeneron Pharmaceuticals, EU-IMI (AZ) and Clementia/Ipsen; holds non-paid board memberships for the International Clinical Council on FOP, IFOPA registry advisory board, Dutch Society for Endocrinology (NVE) BoNe; is a representative for Amsterdam Bone Center and Rare Bone Expert Center, European FOP consortium investigators; is a member of the ERN BOND and ASBMR committee; and is lead clinical PI on the Regeneron Pharmaceuticals LUMINA-1 trial. F.S.K. is a founding member and past president of the International Clinical Council on FOP; a member of the Medical Advisory Board of the IFOPA Global Registry; and a global PI on the Regeneron Pharmaceuticals LUMINA-1 and the Clementia/Ipsen MOVE trials.

Figures

Fig. 1
Fig. 1. Trial profile: LUMINA-1 CONSORT flow diagram.
A total of 48 patients were screened and 44 patients were randomized (20 patients to garetosmab and 24 patients to placebo). One patient from the garetosmab group discontinued from the study in period 1 due to a TEAE of pyrexia and four patients discontinued during period 2/period 3 due to potential risks associated with the COVID-19 pandemic (n = 1) and a lack of perceived benefit (n = 3). As of the final database lock (20 October 2021), five patients had died. Period 3 was the open-label extension portion of the trial that extended beyond 56 weeks. aPatient died beyond period 3 (after week 76). bThese patients decided to withdraw from treatment due to lack of perceived benefit compared to the AE experienced. Both patients continued for safety follow-up.
Fig. 2
Fig. 2. Effect of garetosmab on the change from baseline in TLA compared to placebo, the total number of new HO lesions assessed by quantitative imaging and the total volume of new HO lesions by CT per patient in period 1 and representative images.
a, TWA of the percent change over 28 weeks in TLA (TWA (±s.e.m.) 16.6 (9.1) versus −8.1 (0.9); P = 0.07 (primary)) as assessed by 18F-NaF PET (AHO) was analyzed through an ANCOVA model. b, Total number of new lesions in all patients per group (combined) by CT and 18F-NaF PET during period 1 relative to baseline (AHO). c, Total volume of new lesions per patient as assessed by CT in period 1 (AHO); number of new lesions per patient (bold text on top of each column bar) as assessed by CT in period 1 (AHO). d, Surface-rendered baseline (left) and week 28 (right) PET–CT fusion images of a placebo-treated patient with a prominent femoral bridge new HO lesion detectable at week 28 by PET–CT (inside red oval). The PET signal in the arm is due to the site of tracer injection. e, Transaxial CT (left) and fused PET–CT (right) images of baseline (top) and week 28 (bottom) of the same patient from Panel d, displaying detail of the prominent new HO lesion (inside red oval) with a blend of high- and low-density regions evident on CT and corresponding high uptake by PET, indicating a high rate of mineralization compared to normotopic and mature HO present on the contralateral leg (the grayscale color bar indicates Hounsfield units (HU) and the hot iron color bar shows PET SUV units). f, A garetosmab-treated patient showing no HO-related PET–CT changes between baseline and week 28 scans. For both patients, the PET signal in the area of the pubis is normal urinary bladder uptake, signal near the spine and below the ribs is normal kidney uptake and signal in the feet correspond to non-HO bone degenerative disease. Apparent bone projection from the left femur at week 28 is an image artifact (e).
Fig. 3
Fig. 3. Effect of garetosmab in period 2 relative to period 1 on the total number of new HO lesions, the mean total volume of new HO lesions, the TLA in new HO lesions and the percentages of patients with new lesions assessed by quantitative imaging in those originally randomized to placebo.
a, Total number of new lesions by CT during period 2 relative to period 1 (mITT analysis set). b, Total number of new lesions by 18F-NaF PET during period 2 relative to period 1 (mITT analysis set). c, Mean total volume of new lesions as assessed by CT in period 2 relative to period 1 (mITT analysis set). d, TLA of new lesions by 18F-NaF PET in period 2 relative to period 1 (mITT analysis set). e, Percent of patients with new lesions by CT during period 2 relative to period 1 (mITT analysis set). f, Percent of patients with new lesions by 18F-NaF PET during period 2 relative to period 1 (mITT analysis set). P values were generated from a Wilcoxon signed-rank test (ad) and a McNemar’s test (e,f). P values were not adjusted for multiple testing; however, a hierarchical testing strategy was prespecified before analysis of the data.
Extended Data Fig. 1
Extended Data Fig. 1. Lack of association of epistaxis events and deaths in the LUMINA-1 study, number of epistaxis TEAEs in patients with or without fatal SAEs, relationship between patient baseline age and disease severity as measured by the clinical staging of FOPa, and madarosis events in the LUMINA-1 study.
a, In red are patients who received placebo during the 28-week period 1, and in blue are patients receiving garetosmab. Dots represent epistaxis events. Black dots are mild epistaxis events, yellow dots are moderate events (defined as any episode lasting longer than 30 mins or requiring medical intervention) and red dots are severe events. Red arrows indicate the patient experienced a fatal SAE. b, The table shows the number of epistaxis TEAEs in patients with or without fatal SAEs. No drug refers to the period after dosing was discontinued following clinical hold. c, Red triangles indicate patients with fatal SAEs. d, In red are patients who received placebo during the 28-week period 1, and in blue are patients who received garetosmab. Dots represent madarosis events: black dots are mild madarosis events and yellow dots are moderate events. Red arrows indicate the patient experienced a fatal SAE. aCAJIS is an assessment of mobility limitation at 15 anatomic locations; scores are tabulated for each site as normal unaffected (0), affected (1), or completely functionally ankylosed (2). The total score ranges from 0 to 30. On the basis of FOP features (flare-up activity, body regions affected, thoracic insufficiency syndrome, other complications) and its consequences (impairments in activities of daily living and ambulation, increasing CAJIS), five clinical stages of disease severity have been defined. In early-stage FOP the total CAJIS score is usually ≤4, in the moderate stage 5–18, in the severe stage 19–24, in the profound stage ≥24, and in the end-of-life stage ≥28. CAJIS, Cumulative Analog Joint Involvement Scale; FOP, fibrodysplasia ossificans progressiva; SAE, severe adverse event; TEAE, treatment-emergent adverse event.
Extended Data Fig. 2
Extended Data Fig. 2. Coagulation and platelet functional assays at baseline and post-treatment in LUMINA-1 patients.
Coagulation tests and platelet functional assays including a, activated prothrombin time b, prothrombin international normalized ratio and c, prothrombin time were collected after protocol amendment #3 at local laboratories to explore the mechanism of epistaxis and garetosmab mechanism of action. For patients already enrolled in the study, the blood samples for these assessments were collected at their next visit unless the assessment was performed in the last year. The blue box indicates the normal range across the local labs for the individual sites. d, The table shows the number of measurements and summary statistics for the coagulation tests and platelet functional assays at baseline. Q4W, every 4 weeks; SD, standard deviation.
Extended Data Fig. 3
Extended Data Fig. 3. CT and 18F-NaF PET: Percent of patients with new lesions from baseline to week 28.
a, Percent of patients with new lesions by CT during period 1 relative to baseline (AHO). b, Percent of patients with new lesions by 18F-NaF PET during period 1 relative to baseline (AHO). 18F-NaF, fluorine-18-labeled sodium fluoride; AHO, active HO analysis set; CT, computed tomography; HO, heterotopic ossification; PET, positron emission tomography.
Extended Data Fig. 4
Extended Data Fig. 4. Representative CT and PET images of patients treated with garetosmab and placebo.
a, Baseline and week 28 PET/CT fusion and CT scans for Patient A (placebo group) and Patient B (garetosmab group). At baseline, Patient A showed a large HO lesion next to the humerus (shown by the yellow arrow), the PET signal of which decreased from an SUVmean of 33.46 to 12.25 and the volume of which by CT increased from 17.74 cm3 to 27.8 cm3, while a new lesion (shown by the blue arrow) with an SUVmean of 23.49 and a CT volume of 10.1 cm3 was detectable at the 28-week scan. Patient B showed a small HO lesion, the PET signal of which decreased from an SUVmean of 13.57 to 6.18 and the CT volume of which increased slightly from 1.72 cm3 to 2.12 cm3. b, Baseline (left panel) and week 28 (right panel) surface-rendered CT and maximum-intensity projection PET images of a placebo patient showing several prominent new lesions detectable by CT (bone bridges forming in the biceps and deltoid muscle regions indicated by green arrows) and PET (high-intensity uptake in the deltoid muscle region indicated by orange arrows). New foci of PET uptake in the feet were deemed non-HO-related by the independent blinded readers. CT, computed tomography; HO, heterotopic ossification; PET, positron emission tomography; SUVmean, mean standardized uptake value.
Extended Data Fig. 5
Extended Data Fig. 5. Percent change from baseline in mean 18F-NaF SUVmax per patient by PET over time for pre-existing lesions (AHO).
LS means and SEs were estimated from ANCOVA. This model included treatment group and gender, as well as the continuous covariates of baseline mean SUVmax. 18F-NaF, fluorine-18-labeled sodium fluoride; AHO, active heterotopic ossification analysis set; ANCOVA, analysis of covariance; BL, baseline; LS, least squares; PET, positron emission tomography; Q4W, every 4 weeks; SE, standard error; SUVmax, maximal standardized uptake value.
Extended Data Fig. 6
Extended Data Fig. 6. Percent change from baseline in total lesion activity by 18F-NaF PET and total volume of HO lesions by CT over time for pre-existing lesions (AHO).
a, LS mean percent change from baseline in TLA by 18F-NaF PET over 28 weeks. b, LS mean percent change from baseline of total HO lesion volume assessed by CT. LS means and SEs were estimated using a MMRM. This model included fixed categorical effects of treatment group, gender, time point, treatment-by-time point interaction, as well as the continuous fixed covariates of baseline value. 18F-NaF PET, fluorine-18-labeled sodium fluoride positron emission tomography; AHO, active heterotopic ossification analysis set; BL, baseline; CT, computed tomography; HO, heterotopic ossification; LS, least squares; MMRM, mixed-effect model for repeated measures; Q4W, every 4 weeks; SE, standard error.
Extended Data Fig. 7
Extended Data Fig. 7. Effect of garetosmab on flare-up events.
Percent of patients with new flare-up events as reported by a, patient diary and b, investigator AE verbatim term in period 1 (active HO analysis set). Panels C–E describe patients who crossed over from placebo in period 1 to garetosmab in period 2. Percent of patients with new flare-up events as reported by c, patient diary and d, investigator AE verbatim term for patients originally assigned to placebo (mITT analysis set). Total number of new flare-up events as reported by e, patient diary and f, investigator AE verbatim term for patients originally assigned to placebo (mITT analysis set). A new flare-up was defined as a flare-up event starting in the corresponding period. Investigator-defined flare-ups were defined as TEAEs with the verbatim term containing ‘flare’. Nominal P values are not shown for post-hoc analyses, that is, panels A–D. AE, adverse event; HO, heterotopic ossification; mITT, modified intent-to-treat; TEAE, treatment-emergent adverse event.
Extended Data Fig. 8
Extended Data Fig. 8. Durability of garetosmab effect (period 1 through period 2): New HO lesions and volume by CT and PET.
Effect of garetosmab in period 2 relative to period 1 on the a, b, total number of new HO lesions, c, mean total volume of new HO lesions d, TLA of new HO lesions and e, f, percent of patients with new lesions, as assessed by quantitative imaging in patients originally randomized to garetosmab in period 1. CT, computed tomography; HO, heterotopic ossification; PET, positron emission tomography; TLA, total lesion area.

References

    1. Pignolo RJ, Shore EM, Kaplan FS. Fibrodysplasia ossificans progressiva: clinical and genetic aspects. Orphanet J. Rare Dis. 2011;6:80. doi: 10.1186/1750-1172-6-80. - DOI - PMC - PubMed
    1. Baujat G, et al. Prevalence of fibrodysplasia ossificans progressiva (FOP) in France: an estimate based on a record linkage of two national databases. Orphanet J. Rare Dis. 2017;12:123. doi: 10.1186/s13023-017-0674-5. - DOI - PMC - PubMed
    1. Liljesthrom M, Pignolo RJ, Kaplan FS. Epidemiology of the global fibrodysplasia ossificans progressiva (FOP) community. J. Rare Dis. Res Treat. 2020;5:31–36. doi: 10.29245/2572-9411/2020/2.1196. - DOI
    1. Morales-Piga A, et al. Fibrodysplasia ossificans progressiva in Spain: epidemiological, clinical, and genetic aspects. Bone. 2012;51:748–755. doi: 10.1016/j.bone.2012.07.002. - DOI - PubMed
    1. Pignolo RJ, et al. Prevalence of fibrodysplasia ossificans progressiva (FOP) in the United States: estimate from three treatment centers and a patient organization. Orphanet J. Rare Dis. 2021;16:350. doi: 10.1186/s13023-021-01983-2. - DOI - PMC - PubMed

Publication types

MeSH terms

Associated data