. 2024 Mar;20(3):291-301.
doi: 10.1038/s41589-023-01432-0. Epub 2023 Sep 28.

Distinct chemical environments in biomolecular condensates

Affiliations

Distinct chemical environments in biomolecular condensates

Henry R Kilgore et al. Nat Chem Biol. 2024 Mar.

Erratum in

Abstract

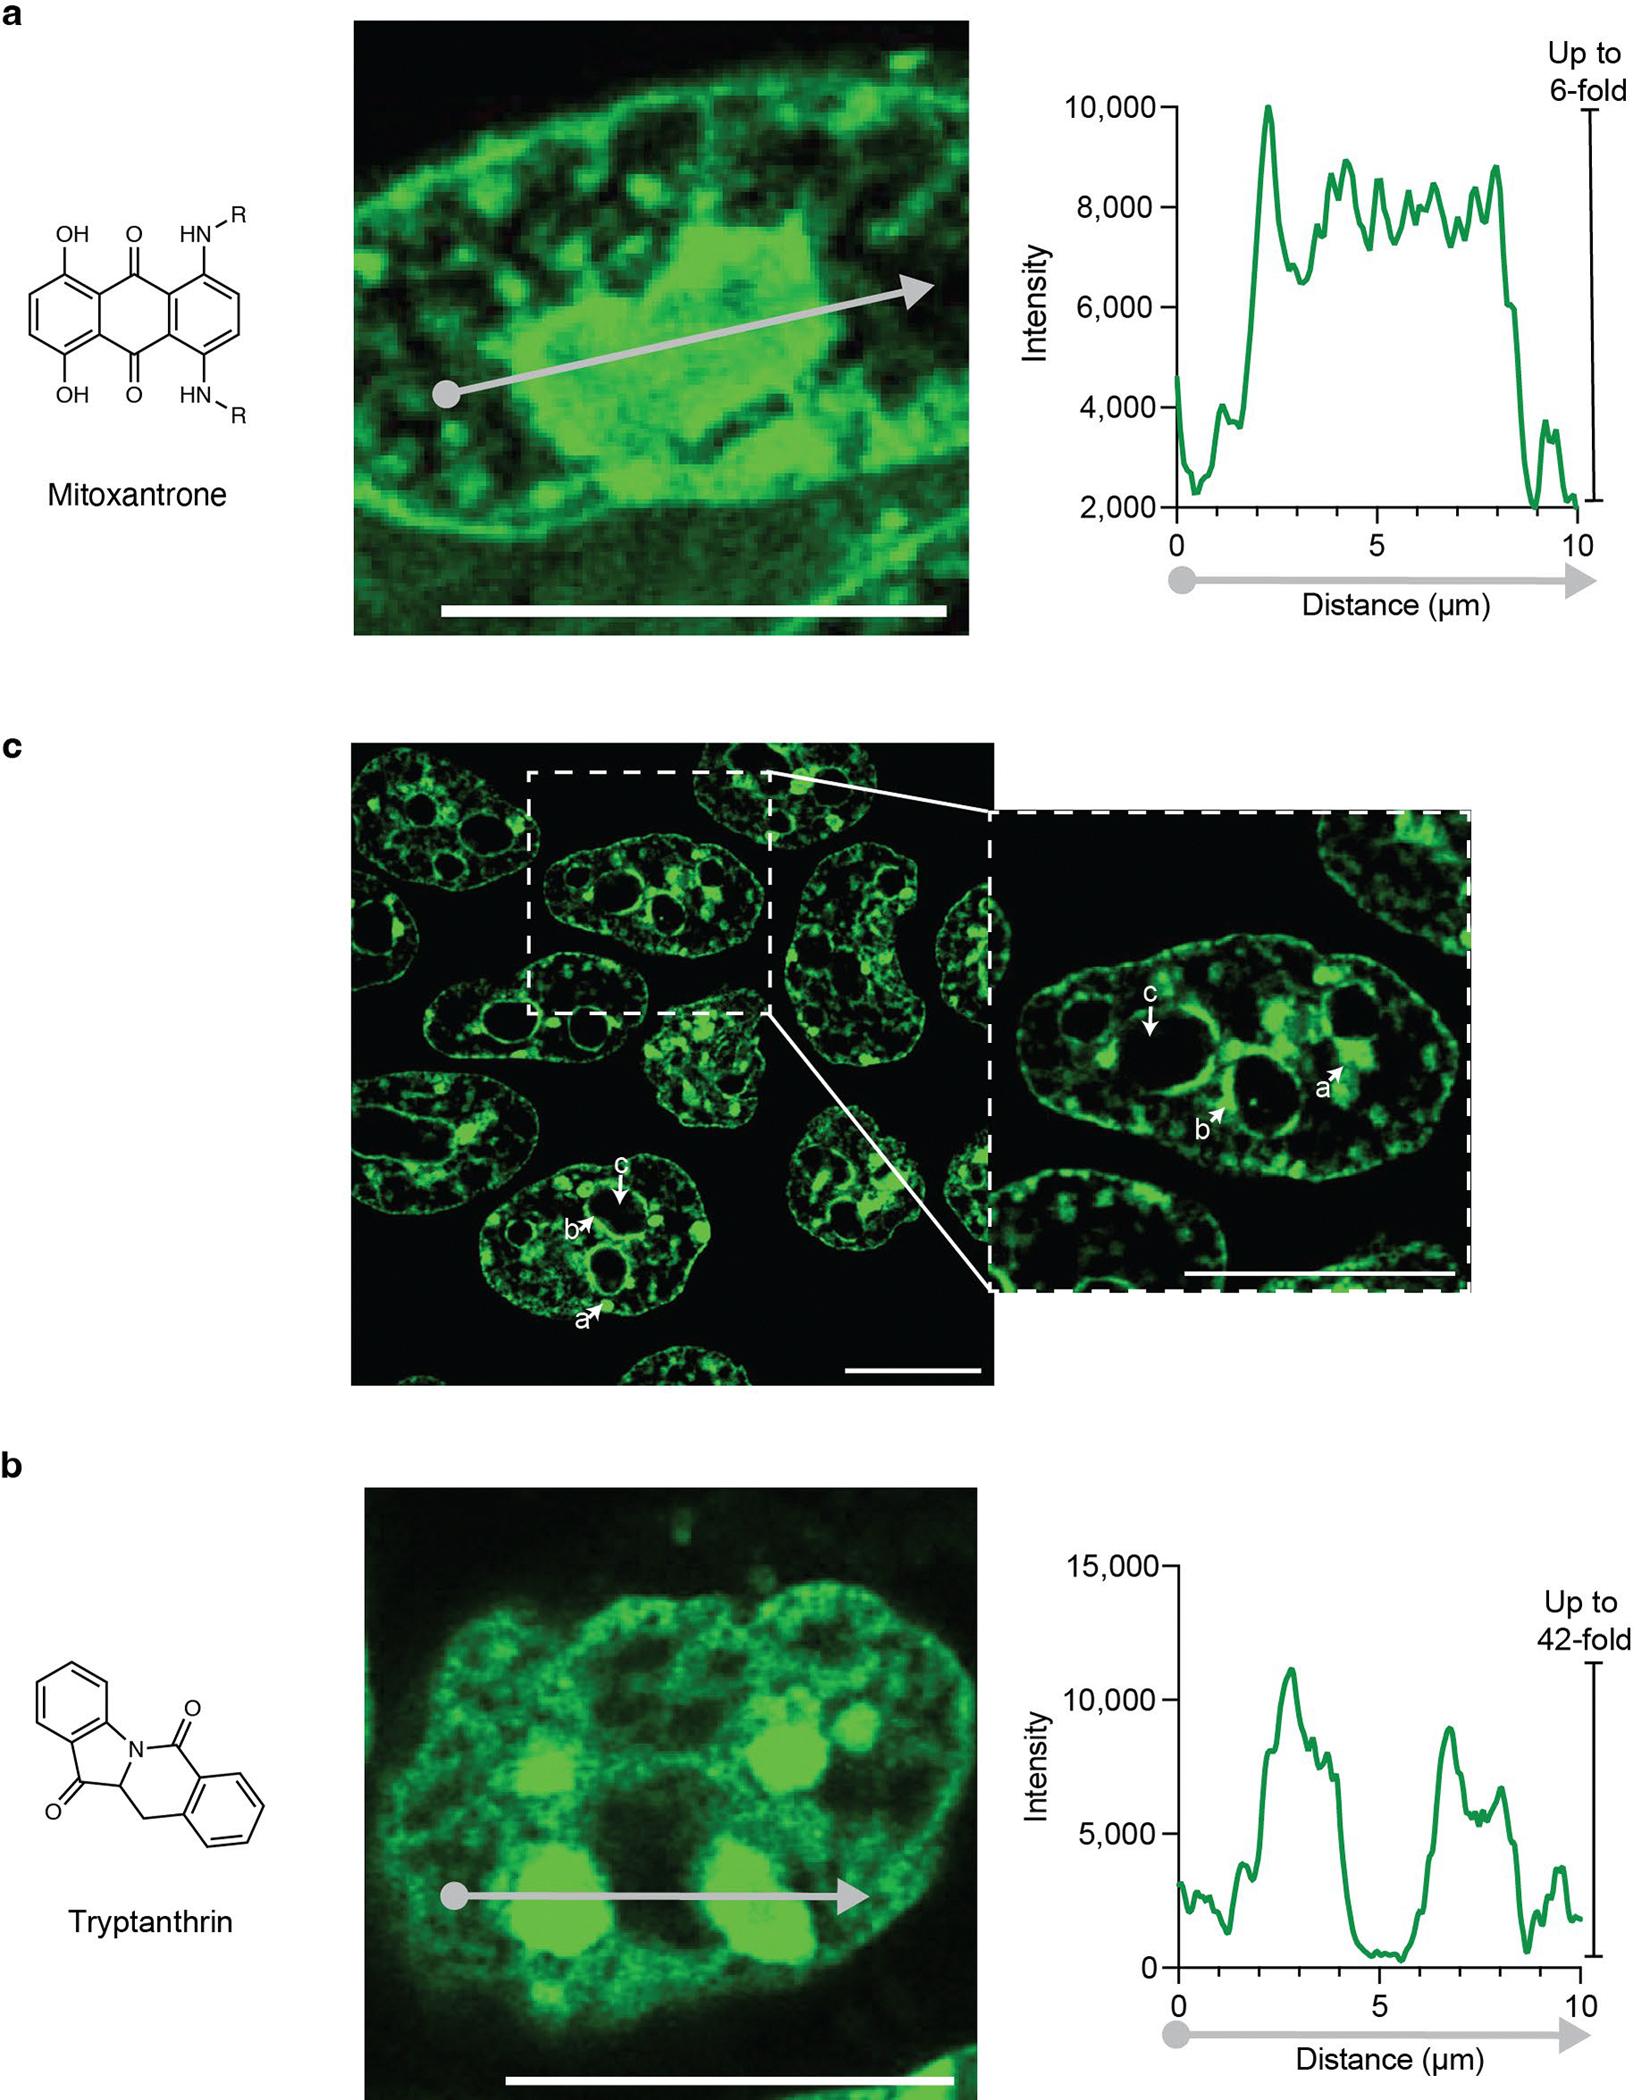
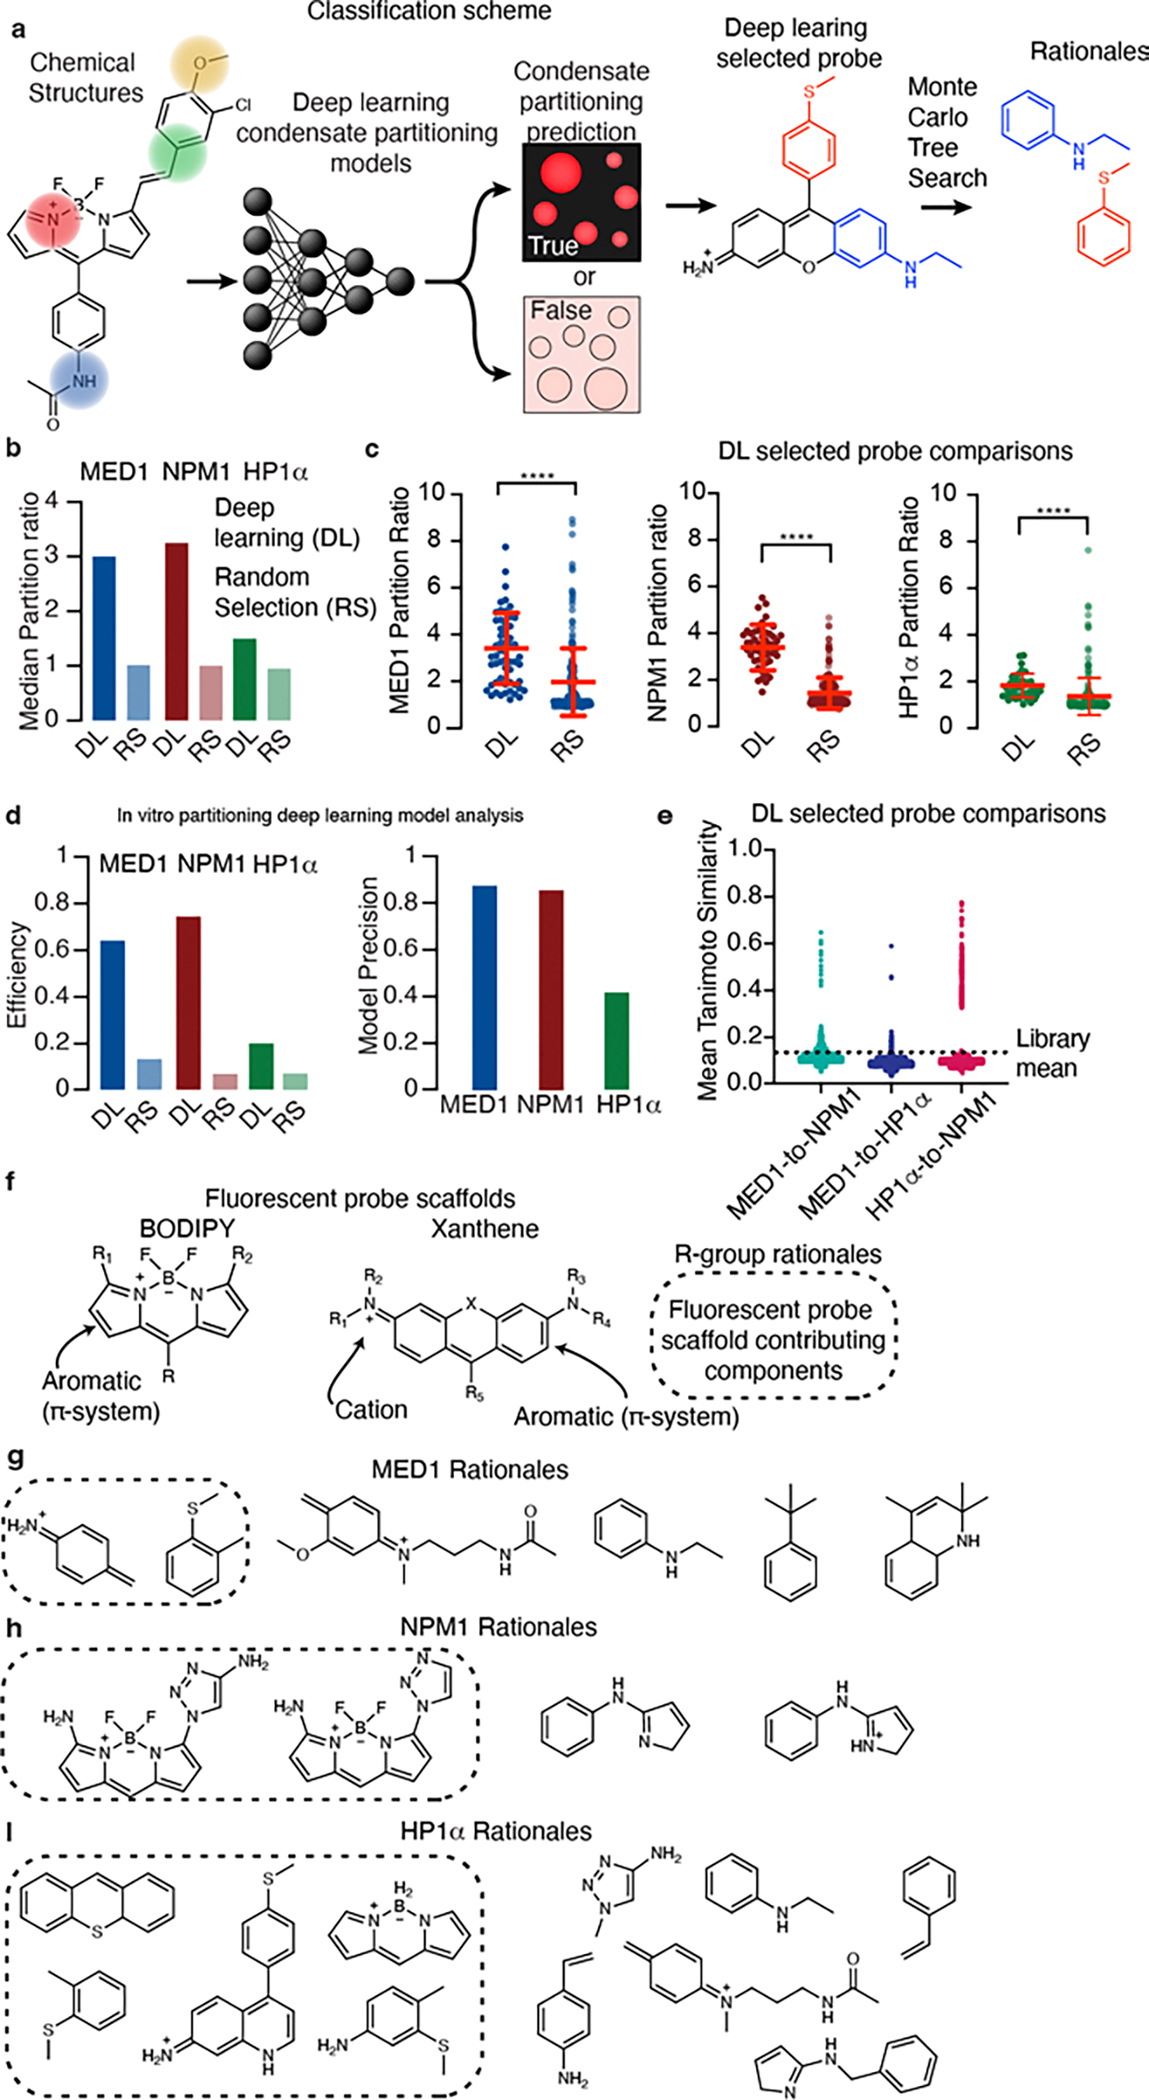
Diverse mechanisms have been described for selective enrichment of biomolecules in membrane-bound organelles, but less is known about mechanisms by which molecules are selectively incorporated into biomolecular assemblies such as condensates that lack surrounding membranes. The chemical environments within condensates may differ from those outside these bodies, and if these differed among various types of condensate, then the different solvation environments would provide a mechanism for selective distribution among these intracellular bodies. Here we use small molecule probes to show that different condensates have distinct chemical solvating properties and that selective partitioning of probes in condensates can be predicted with deep learning approaches. Our results demonstrate that different condensates harbor distinct chemical environments that influence the distribution of molecules, show that clues to condensate chemical grammar can be ascertained by machine learning and suggest approaches to facilitate development of small molecule therapeutics with optimal subcellular distribution and therapeutic benefit.


Conflict of interest statement

Competing interests:

R.A.Y. is a founder and shareholder of Syros Pharmaceuticals, Camp4 Therapeutics, Omega Therapeutics, Dewpoint Therapeutics and Paratus Sciences, and has consulting or advisory roles at Precede Biosciences and Novo Nordisk. R.B. has consulting or advisory roles at Dewpoint Therapeutics, J&J, Amgen, Outcomes4Me, Immunai, and Firmenich. H.R.K. is a consultant of Dewpoint Therapeutics. The remaining authors declare no competing interests.

Figures

Extended Data Figure 1.
Extended Data Figure 1.. Live cell confocal and two-photon imaging of endogenously fluorescent drugs.
HCT-116 cells were incubated with a drug or natural product at 50 μM for 1 hour and then imaged with a confocal or two-photon microscope. Image for sunitinib is also shown in Figure 1. Scale: 10 μm.
Extended Data Figure 2.
Extended Data Figure 2.. Subcellular distribution of small molecules in a breast cancer cell line.
Live MCF7 cells were incubated with a drug or natural product at 50 μM for 1 hour prior to confocal imaging. Scale: 10 μm R = CH2CH2OCH2CH2NH2, R2 = CH2CH2N(CH2CH3)2.
Extended Data Figure 3.
Extended Data Figure 3.. Subcellular distribution of small molecules in a prostate cancer cell line.
Live PC3 cells were incubated with a drug or natural product at 50 μM for 1 hour prior to confocal imaging. Scale: 10 μm. R = CH2CH2OCH2CH2NH2, R2 = CH2CH2N(CH2CH3)2.
Extended Data Figure 4.
Extended Data Figure 4.. Additional analysis of condensate selectivity in fluorescent probe partitioning.
(a-c) Dot plots comparing the partition ratios of probes above the 90th percentile in, a, MED1, b, NPM1, and c, HP1α against their partition ratios in other condensates. p-values computed with a two-sided unpaired t-test, n=50 and df=98 for all groups, with t-statistics and effect sizes (η2) as follows: MED1-NPM1 (t=22.87, η2=0.84), MED1- HP1α (t=19.88, η2=0.80), NPM1-MED1 (t=3.43, η2=0.11), NPM1- HP1α (t=8.24, η2=0.41), HP1α -MED1 (t=3.15, η2=0.09), HP1α -NPM1 (t=4.09, η2=0.15). (d-f) Dot plots comparing the partition ratios of probes below the 10th percentile in d, MED1, e, NPM1, and f, HP1α against their partition ratios in other condensates. p-values computed with a two-sided unpaired t-test, n=50 and df=98 for all groups, with test statistics as follows: MED1-NPM1 (t=3.79, η2=0.13), MED1- HP1α (t=4.65, η2=0.18), NPM1-MED1 (t=3.12, η2=0.09), NPM1- HP1α (t=2.60, η2=0.07), HP1α -MED1 (t=3.76, η2=0.13), HP1α -NPM1 (t=4.20, η2=0.15). (g-i) Dot plots comparing the percentile ranks of probes below the 10th percentile in g, MED1, h, NPM1, and i, HP1α against their percentiles in other condensates. p-values computed with a two-sided Wilcoxon matched-pairs signed rank test, n=50 for all groups, test statistic |W| (left to right): 915, 1003, 928, 1137, 1099, 681. For panels a-i, centerline and error bars represent mean ± standard deviation, p-values were not adjusted for multiple comparisons, sample size n = 100 probes.
Extended Data Figure 5.
Extended Data Figure 5.. Probe features suggest a chemical grammar in condensates.
a, Cartoon depicting how similar molecules (here, sharing color) might interact with the same chemical environment. b, Schematic showing calculation of Tanimoto similarity matrices comparing fluorescent probes by their Morgan Fingerprints. c, Schematic and d, dot plots showing calculation of mean Tanimoto similarities from matrices of fluorescent probes compared against each other in high-to-high (H-H), high-to-low (H-L) and low-to-low (L-L) partitioning regions. e, Graphic and f, dot plots show the comparison of high partitioning probes between condensates through quantification of matrices, significance between groups was not assessed. Centerline and error bars represent mean ± standard deviation. Panel d, all comparisons were statistically significant with p-value, p < 0.0001 (asterisks do not appear in figure), sample size MED1 n = 120. NPM1 n = 100. HP1α n = 100, without adjustment for multiple comparisons. Unpaired two-sided t-test statistic and degrees of freedom: MED1 H-H, t = 9.5, df = 238. MED1 H-L, t = 12.7, df = 238. MED1 L-L, t = 7.3, df = 238. NPM1 H-H, t = 12.17, df = 198. NPM1 H-L, t = 7.4, df = 198. NPM1 L-L, t = 9.4, df = 198. HP1α H-H, t = 4.8, df = 198. HP1α H-L, t = 10.7, df = 198. HP1α L-L, t = 8.3, df = 198.
Extended Data Figure 6.
Extended Data Figure 6.. Comparison of deep learning and Tanimoto similarity approaches toward predicting partitioning behaviors.
Receiver-operator curves quantifying the success of deep learning and Tanimoto similarity approaches for determining partitioning behavior of small molecules into condensates. a, Deep learning-based approach to probe classification (compounds were considered to have partitioned if probes concentrated above 2.7 for MED1, 2.7 for NPM1, and 2.0 for HP1α). Tanimoto similarity approach to probe classification in b, MED1, c, NPM1, and d, HP1α condensates across different thresholds of Tanimoto similarity (compounds were considered to have concentrated into a condensate if probe partition ratio was K > 2.0 for MED1, NPM1, and HP1α).
Extended Data Figure 7.
Extended Data Figure 7.. Live cell two-photon imaging of small molecules in mouse embryonic stem cells.
Live mouse embryonic stem cells were incubated with a drug or natural product and assayed with two-photon imaging. Drugs and natural products are listed in Supplementary Table 1 and their predicted subcellular distribution from machine learning is given in Supplementary Table 2. Scale: 50 μm.
Extended Data Figure 8.
Extended Data Figure 8.. Receiver operator curves comparing performance of Tanimoto similarity and deep learning classifiers on in vivo compounds.
a, Performance of NPM1 deep learning model (AUC-ROC = 0.62) and Tanimoto similarity (AUC-ROC=0.52) at identifying drugs and natural products that concentrate in the nucleolus. b, Performance of HP1α deep learning model (AUC-ROC = 0.59) and Tanimoto similarity (AUC-ROC=0.52) at identifying drugs and natural products that concentrate in chromocenters.
Extended Data Figure 9.
Extended Data Figure 9.. Live cell images showing the partitioning of small molecules into nuclear compartments.
a, Micrograph and line plot showing the signal intensity from mitoxantrone along that indicated gray arrow in HCT-116 cells. b, Mouse embryonic stem cells stained with the DNA dye Hoechst. (a) chromocenter, (b) perinuclear heterochromatin, (c) nucleolus. Zoom (2x). c, Micrograph and line plot showing the signal intensity from tryptanthrin along the indicated gray arrow in mouse embryonic stem cells. Scale: 10 μm. Images were recorded after 1 hour of incubation for tryptanthrin and mitoxantrone, and 10 minutes for hoechst.
Figure 1.
Figure 1.. Therapeutic small molecules concentrate in distinct intracellular environments.
a, Micrographs showing live HCT-116 cells that were incubated with endogenously fluorescent drugs (50 μM) for 1 hour and imaged with a confocal microscope. Dashed-line boxes indicate zoom (2x) cutout source, scale bar: 10 μm. R = (Thr-D-Val-Pro-Sar-MeVal), R1 = p-chlorobenzene, R2 = CH2CH2OCH2CH2NH2, R3 = CH2CH2N(CH2CH3)2. b, High-affinity protein-small molecule interactions can occur between a ligand and a structured ligand binding site, while weaker interactions with diverse features in the chemical environment of a condensate might independently concentrate small molecules in these macromolecular assemblies (PDB ID: 3mxf). These distinct interactions could work together to maximize the target engagement of a small molecule.
Figure 2.
Figure 2.. Selective partitioning of small molecules in simple condensates.
a, Live cell condensate scaffold proteins can be reconstituted in vitro, top: HCT-116 cells expressing MED1-GFP (transcriptional condensates), NPM1-GFP (nucleolar condensates) and HP1α -GFP (heterochromatin condensates). Bottom: Homotypic in vitro condensates formed with indicated scaffold proteins fused to blue fluorescent protein (Top scale bar: 10 μm, 2.0x zoom, Bottom scale bar: 2 μm). b, Chemical scaffolds of fluorescent probes used to measure partitioning within condensate assays and example R-groups. c, Schematic of the in vitro condensate partitioning screen and calculation of probe partition ratio, K. The screen was performed with 50 μM probe and 5 μM protein. d, 3-D scatter plot of probes compared across condensates; color gradient is proportional to MED1 partition ratio. (e-g), Dot plots comparing the partition ratio percentiles of the highest partitioning probes in e, MED1, f, NPM1, and g, HP1α condensates (left distributions) to the percentiles of these probes in the other condensates (middle and right distriubtions), sample size n = 50 probes. Centerline and error bars represent mean ± standard deviation. (unadjusted p-value, p. **** p < 0.0001,*** 0.0001< p < 0.001, ** 0.001 < p < 0.01, * 0.05 < p < 0.01, p-values calculated with a two-sided Wilcoxon matched-pairs signed rank test, test statistics |W|, (e) 1146, 1162, (f) 1148, 1153, (g) 1166, 1249).
Figure 3.
Figure 3.. Deep learning discovers compounds with selective partitioning behaviors.
a, Schematic of a message passing neural network for classifying probe partitioning behaviors into in vitro condensates and evaluation of their rationales. b, Bar graph showing the median partition ratio of deep learning (DL) and randomly selected probes (RS). c, Dot plots of partition ratio for fluorescent probes selected by DL or RS in MED1 (DL sample size n = 56, RS sample size n = 224 probes, t=6.6, df = 278), NPM1 (DL sample size n = 50 probes, RS sample size n = 240, t= 17.2, df = 288) and HP1α (DL sample size n = 40 probes, RS sample size n = 240 t= 3.6, df = 278) in vitro condensate assays. Centerline and error bars represent mean ± standard deviation. d, Analysis of in vitro deep learning models, (left) bar graph depicting the efficiency of selecting probes above a condensate’s partition ratio threshold with DL or by RS and (right) a bar graph depicting the precision of deep learning models generated for each condensate (see methods for more information). e, Dot plot showing the Tanimoto similarity of the DL selected fluorescent probes between the condensates considered. f, Chemical structures of fluorescent probe scaffolds. Rationales of fluorescent probe scaffolding (shown in box) and functional groups in g, MED1, h, NPM1, and i, HP1α condensates. (unadjusted p-value, p. **** p < 0.0001,*** 0.0001< p < 0.001, ** 0.001 < p < 0.01, * 0.05 < p < 0.01, evaluated with a two-tailed t-test).
Figure 4.
Figure 4.. Live cell partitioning predicted by deep learning classifiers.
a, Schematic of approach for identifying molecules that concentrate in live cell condensates from in vitro parititoning models. Small molecules were evaluated for in vitro partitioning behavior and then compared to their live cell imaging results. b, Partitioning behavior of small molecules into the nucleolus, (left) dot plot showing nucleolar partitioning behavior of small molecules over background nucleoplasm signal intensity, (right) cumulative distribution function showing the fraction of small molecules that concentrated ( Inucleolus / Ibackground > 2) or did not ( Inucleolus / Ibackground < 2). c, Partitioning behavior of small molecules into chromocenters, (left) dot plot showing chromocenter partitioning of small molecules over background signal intensity, (right) cumulative distribution function showing the fraction of small molecules that concentrated ( Ichromocenter / Ibackground > 2) or did not ( Ichromocenter / Ibackground < 2). d, Receiver-operator curves comparing NPM1 and HP1α models against random chance at classifying drug and natural product partitioning behavior into the nucleolus and chromocenters (see supporting information for more details). e, Bar graphs describing the model performance of NPM1 and HP1α models as compared against a random model diagnostic odds ratio, F1-score, and informed-ness, see Supplementary Table 2 for more information (model accuracy, NPM1: 0.62, HP1α: 0.95) (see supporting information for more details). f, Confocal image of the small molecule mitoxantrone (zoom 4x) in the nucleus of mouse embryonic stem cells. g, Confocal image of the small molecule trypanthrin (zoom 4x) in the nucleus of mouse embryonic stem cells, (a) chromocenter, (b) perinuclear heterochromatin, (c) nucleolus. Scale bar: 10 μm.
Figure 5.
Figure 5.. Small molecule-protein interactions in condensates.
Internal chemical environments in condensates selectively concentrate small molecules. a, Internal chemistry of condensates could concentrate molecules simply because their internal environment differs by a classic bulk phase property (e.g., dielectric constant). b, Association of polymers could lead to the creation of local chemical environments or “chemical pockets” that concentrate small molecules. c, Concentration of a protein into a condensate could lead to changes in the ensemble of states occupied by a biopolymer, creating a high affinity small molecule binding site. d, Small molecules and proteins could bind through the same structures inside and outside a condensate, such that increase in protein concentration inside of the condensate effectively concentrates the small molecule.

Comment in

References

    1. Banani SF, Lee HO, Hyman AA & Rosen MK Biomolecular condensates: Organizers of cellular biochemistry. Nat. Rev. Mol. Cell Biol. 18, 285–285 (2017). - PMC - PubMed
    1. Alberts B et al. Molecular biology of the cell. 7th edn, (W. W. Norton & Company, 2022).
    1. Klein IA et al. Partitioning of cancer therapeutics in nuclear condensates. Science 368, 1386–1392 (2020). - PMC - PubMed
    1. Kilgore HR & Young RA Learning the chemical grammar of biomolecular condensates. Nat. Chem. Biol, 18, 1298–1306 (2022). - PMC - PubMed
    1. Shin Y & Brangwynne CP Liquid phase condensation in cell physiology and disease. Science 357 (2017). - PubMed

MeSH terms

LinkOut - more resources