. 2023 Nov;19(11):1406-1414.
doi: 10.1038/s41589-023-01426-y. Epub 2023 Sep 28.

Directed evolution unlocks oxygen reactivity for a nicotine-degrading flavoenzyme

Affiliations

Directed evolution unlocks oxygen reactivity for a nicotine-degrading flavoenzyme

Mark Dulchavsky et al. Nat Chem Biol. 2023 Nov.

Abstract

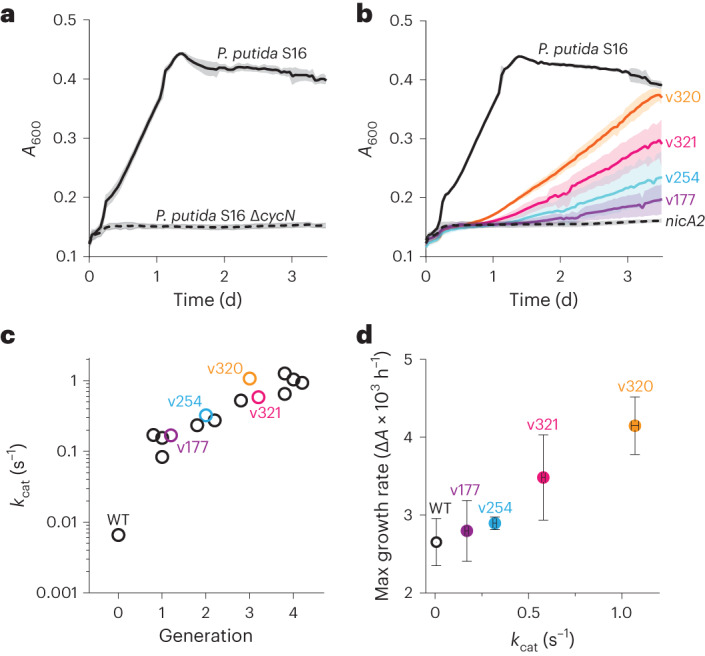
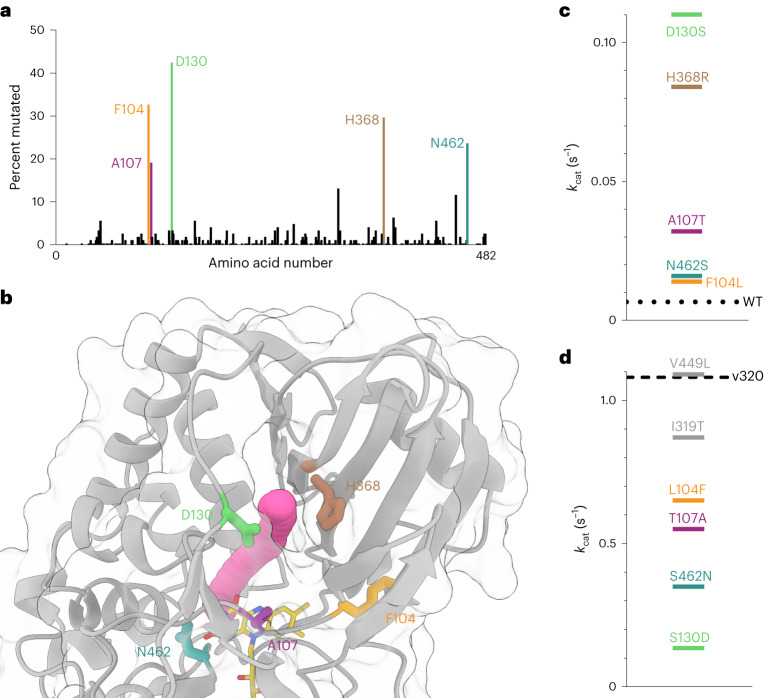
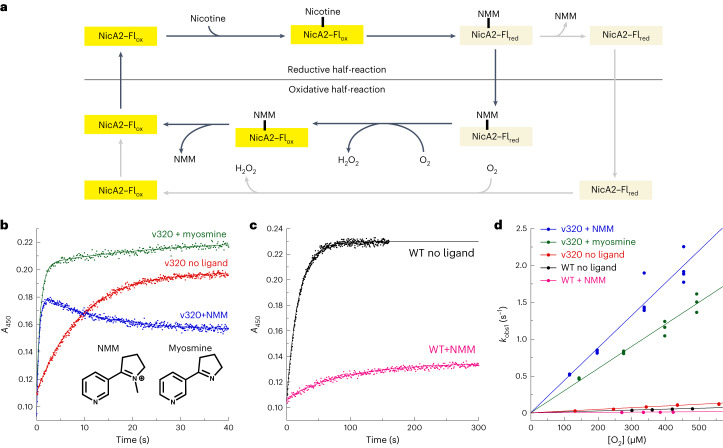
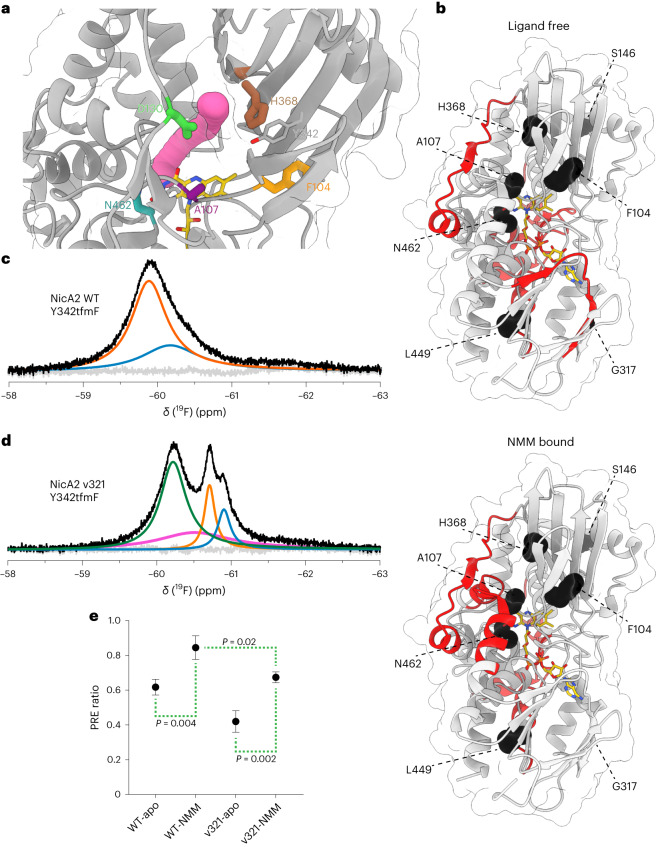
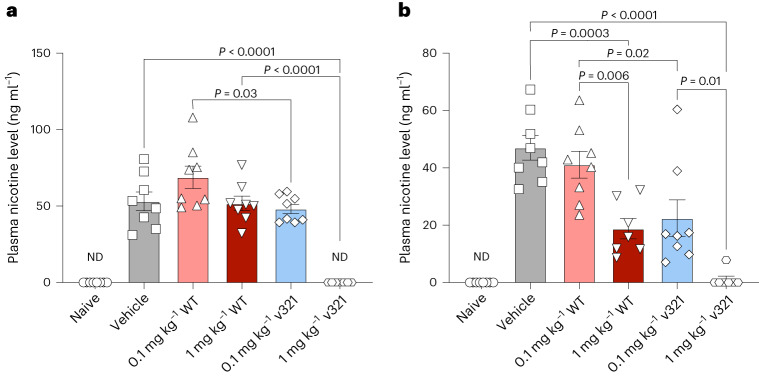
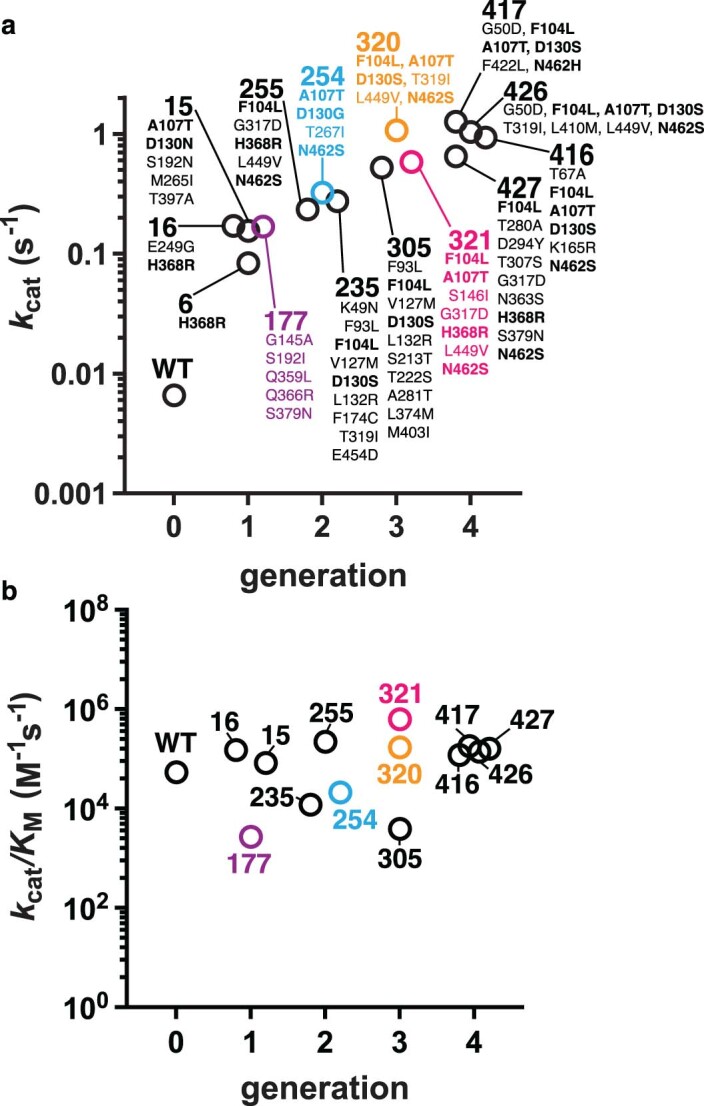
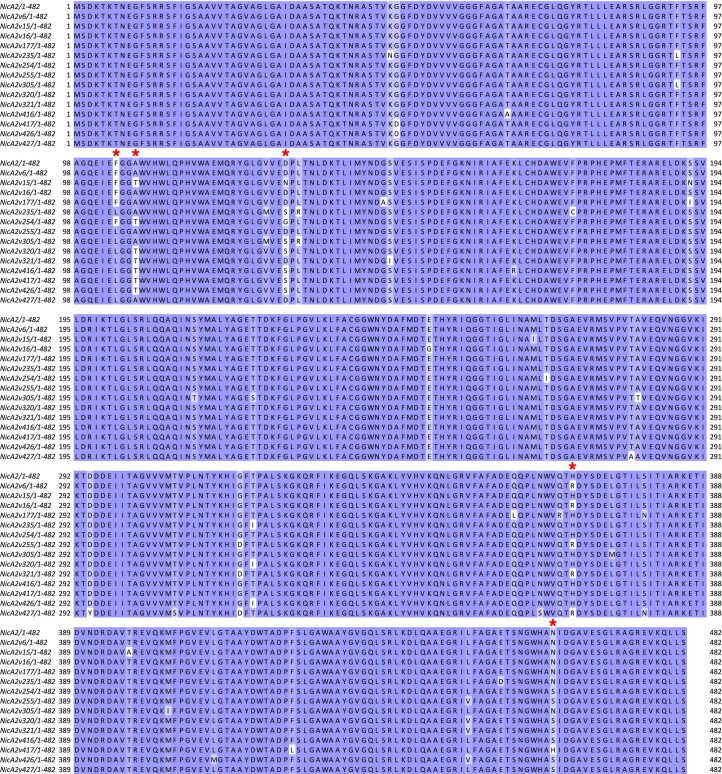
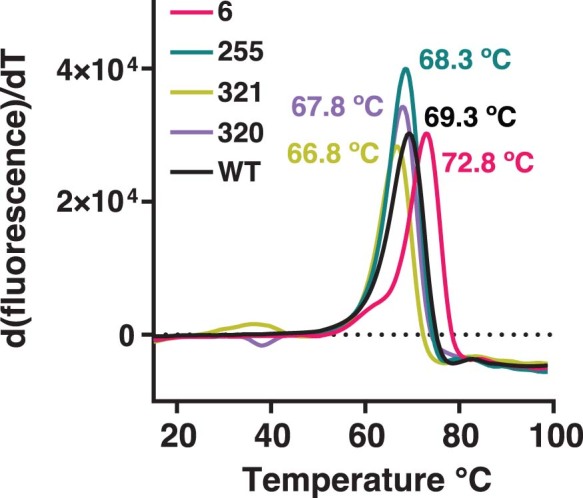
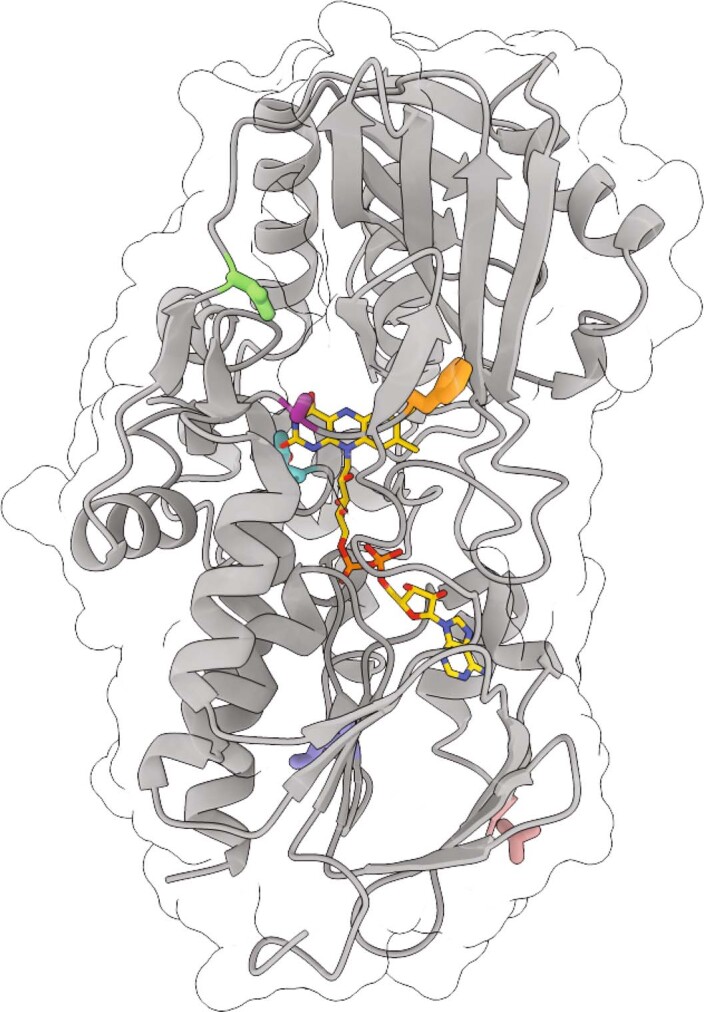
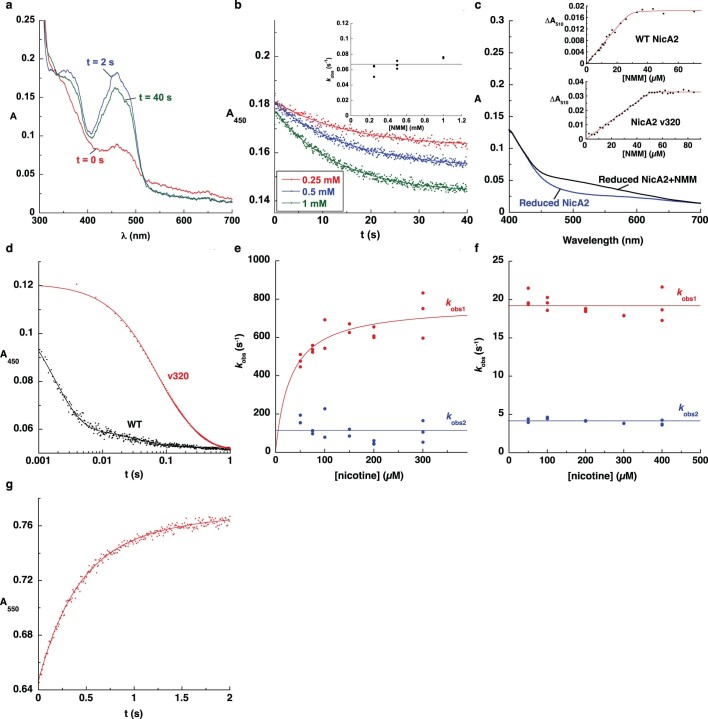
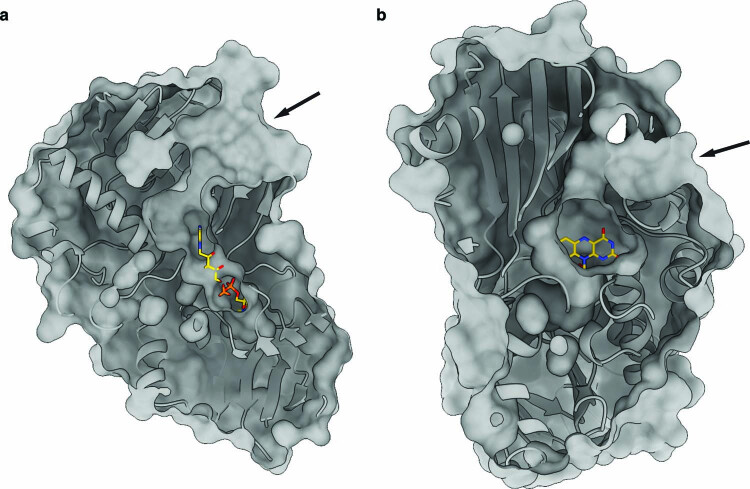
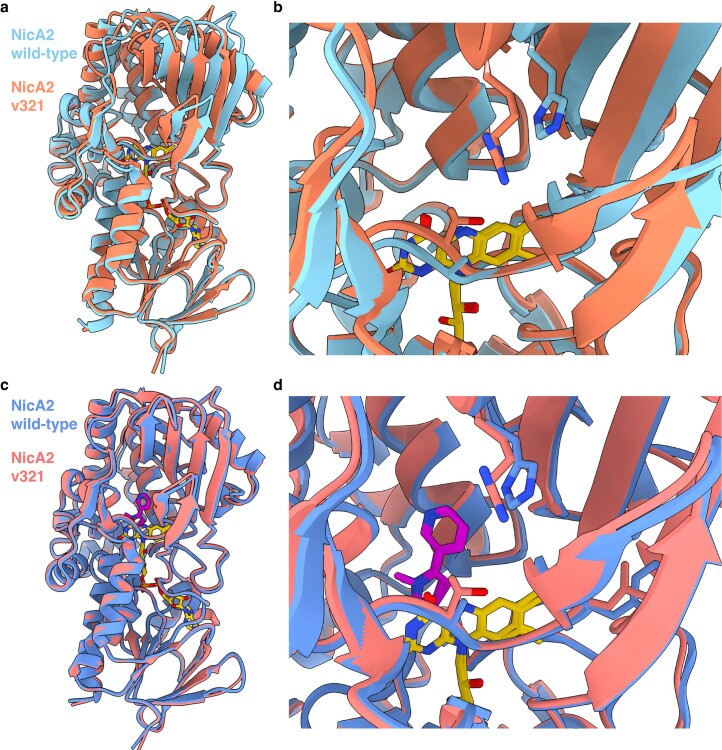
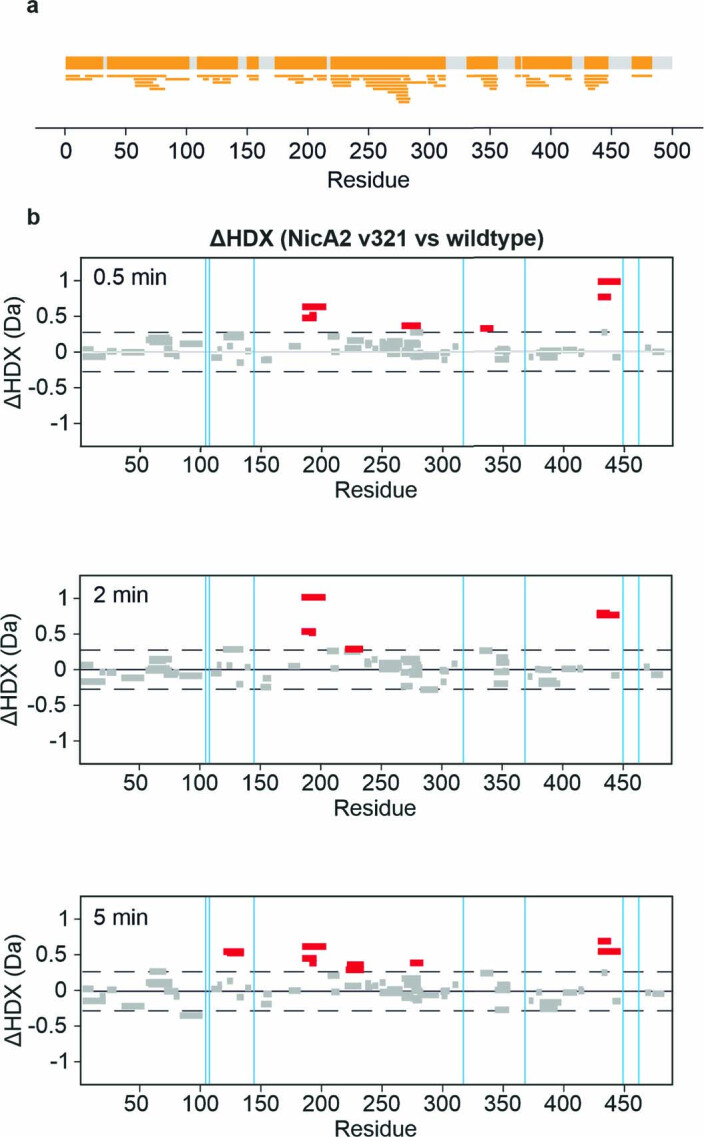
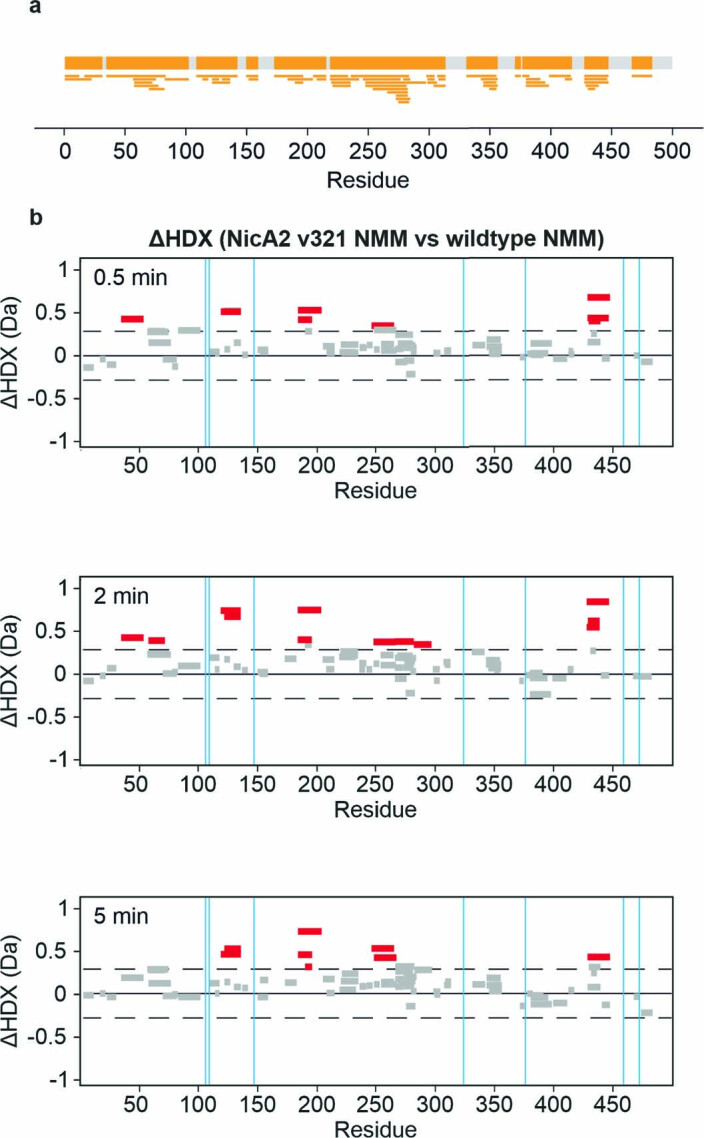
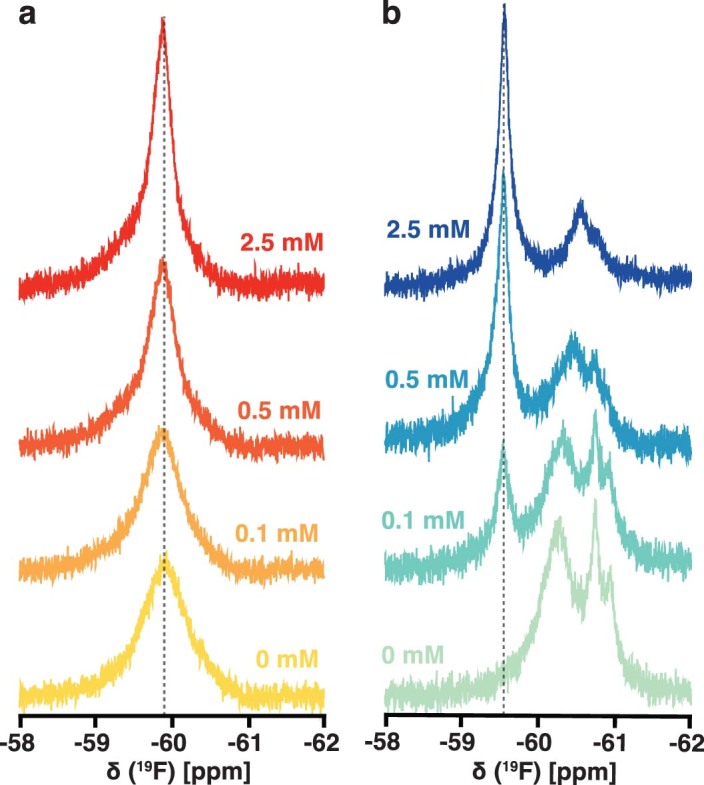
The flavoenzyme nicotine oxidoreductase (NicA2) is a promising injectable treatment to aid in the cessation of smoking, a behavior responsible for one in ten deaths worldwide. NicA2 acts by degrading nicotine in the bloodstream before it reaches the brain. Clinical use of NicA2 is limited by its poor catalytic activity in the absence of its natural electron acceptor CycN. Without CycN, NicA2 is instead oxidized slowly by dioxygen (O2), necessitating unfeasibly large doses in a therapeutic setting. Here, we report a genetic selection strategy that directly links CycN-independent activity of NicA2 to growth of Pseudomonas putida S16. This selection enabled us to evolve NicA2 variants with substantial improvement in their rate of oxidation by O2. The encoded mutations cluster around a putative O2 tunnel, increasing flexibility and accessibility to O2 in this region. These mutations further confer desirable clinical properties. A variant form of NicA2 is tenfold more effective than the wild type at degrading nicotine in the bloodstream of rats.


Conflict of interest statement

M.D., F.S. and J.C.A.B. are named on a patent (PCT/US2021/034824; applicants: The Regents of the University of Michigan, the Board of Trustees of Western Michigan University; filed) partially based on NicA2 variants isolated and characterized in this study. All other authors have no competing interests.

Figures

Fig. 1
Fig. 1. P. putida S16 ΔcycN provides a platform for genetic selection.
a, Growth of wild-type P. putida S16 and ΔcycN in liquid culture with nicotine as the sole carbon source. The mean is plotted with error bands that represent the s.d. of three biological replicates; A600, absorbance at 600 nm. b, Growth of wild-type P. putida S16 in liquid culture with 3 mM nicotine as a sole carbon source is shown in solid black. Growth of P. putida S16 ΔcycN strains transformed with the wild-type sequence of nicA2 in the same medium is shown by the dashed black, and the growth of nicA2 variants coming from the selection is shown in the colored curves with their allele numbers indicated. Note that the color scheme of the variants carries over between the growth curves and the data in c and d. The mean is plotted with error bands that represent the s.d. of three biological replicates. c, nicA2 variants isolated from different generations of the selection were purified and characterized for their encoded mutations and steady-state kinetic parameters (Supplementary Table 1 and Extended Data Fig. 1a). The steady-state kinetic assays in this study were performed under ambient conditions, meaning that the kcat values discussed here actually represent an apparent kcat for nicotine turnover at an oxygen concentration of roughly 250 µM. Note that the y axis has a logarithmic scale; WT, wild type. d, The maximum growth rate of variants transformed in P. putida S16 ΔcycN tested in b plotted against the determined kcat of each variant. The mean is plotted with error bars that represent the 95% confidence intervals of three replicates for each value; ΔA, change in absorbance. Source data
Fig. 2
Fig. 2. Mutations near FAD are critical for a gain in oxygen reactivity.
a, One hundred and thirty-three variant sequences were isolated from our selection. The observed percentage of missense mutations at each amino acid location along the protein’s sequence is plotted. Note that these variant sequences are not independent because the iterative mutagenesis used to create new mutant libraries was done using a pool of higher-activity variants as a template and is therefore subject to a founder effect between different generations of the selection. The color scheme in a applies to the rest of the figure. b, The crystal structure of wild-type NicA2 (Protein Data Bank (PDB) ID 5TTJ) is displayed with a tunnel diameter of ~1.4 Å identified by CAVER simulation rendered in magenta. c, kcat values determined for single mutations in the background of wild-type NicA2. The dotted line indicates the kcat value of wild-type NicA2. d, kcat values determined for variants where mutations were removed from the background of NicA2 v320; each line represents the kcat value corresponding to single mutations back toward the wild-type NicA2. Note the tenfold difference in scale from the plot shown in c. The dashed line indicates the kcat value of NicA2 v320. The location of the amino acid positions L449 and T319 in the crystal structure can be seen in Extended Data Fig. 4. Source data
Fig. 3
Fig. 3. NicA2 variants are rapidly oxidized by O2.
a, Schematic of the reaction of NicA2 with nicotine; Flox, oxidized flavin; Flred, reduced flavin. b, Example traces for the stopped-flow reaction of reduced NicA2 v320 with O2 at a concentration of 450 μM. Raw traces for reactions at all concentrations of O2 can be seen in Supplementary Fig. 1a–h. The second phase of the reaction of NicA2 v320 in the presence of myosmine likely represents a subpopulation of the enzyme that is reacting with O2 in the ligand-free state (Supplementary Fig. 1i). Also shown are the chemical structures for NMM and myosmine. c, Example traces for the reaction of reduced wild-type NicA2 with O2 at a concentration of 450 μM. d, kobs values for the first phase of oxidation are plotted against O2 concentration ([O2]) and fit to a line. The slopes of these lines define the bimolecular rate constants for oxidation by O2, which are presented in numeric form in Table 1. Source data
Fig. 4
Fig. 4. Wild-type NicA2 and mutant v321 populate distinct conformational landscapes.
a, The crystal structure of wild-type NicA2 (PDB ID 5TTJ) is displayed with a tunnel ~1.4 Å in diameter identified by CAVER simulation rendered in magenta. FAD is rendered in yellow, Y342 is rendered in gray, and labeled frequently mutated residues are rendered in orange (F104), purple (A107), green (D130), brown (H368) and turquoise (N462). b, Differential HDX-MS data are shown on the structure of wild-type NicA2 under either a ligand-free or NMM-bound condition. Sections of the protein backbone that are highlighted in red demonstrate greater solvent exchange in v321 than in the wild-type protein. Interestingly, we also observed other areas of deprotection in NicA2 away from this tunnel region, suggesting that some additional structural rearrangements are also occurring. Residues that are mutated in NicA2 v321 are rendered as black spheres. c, 19F NMR spectrum of wild-type NicA2 with the Y342tfmF substitution. The black trace represents the raw data, the colored curves represent fits deconvoluted using decon1d, and the gray trace represents residuals from the fit. d, 19F NMR spectrum of NicA2 v321 with the Y342tfmF substitution. e, PRE ratios for wild-type NicA2 and v321 in both apo- and NMM-bound states. A lower PRE ratio indicates increased accessibility to solvent. The mean is plotted with error bars that represent the s.d. of three replicates. Data were analyzed by one-way analysis of variance with a Tukey multiple comparisons post hoc test. Source data
Fig. 5
Fig. 5. NicA2 v321 degrades plasma nicotine in rats.
Adult Wistar rats (N = 48, equal numbers of males and females) were exposed to nicotine (free base) at a concentration of 3.15 mg per kg (body weight) per d to achieve a chronic blood nicotine level of 50 ng ml−1 or were administered 0.9% saline for 7 d via osmotic minipump. Rats were injected with 0.1 mg per kg (body weight) wild-type NicA2, 1 mg per kg (body weight) wild-type NicA2, 0.1 mg per kg (body weight) NicA2 v321 or 1 mg per kg (body weight) NicA2 v321 at the time of minipump implantation and again every 48 h. Blood was collected from animals at 1 and 5 d after minipump implantation, and plasma nicotine levels were analyzed by liquid chromatography–MS (LC–MS). Because we did not observe differences between sexes, the data reflect both sexes combined. a, Plasma nicotine levels after 1 d of nicotine exposure (24 h after injection of either vehicle or NicA2 treatments); additional statistical significance values not shown on the figure: for naive versus vehicle, 0.1 mg per kg (body weight) wild type, 1 mg per kg (body weight) wild type and 0.1 mg per kg (body weight) NicA2 v321, all P < 0.0001; for 1 mg per kg (body weight) NicA2 v321 versus vehicle, 0.1 mg per kg (body weight) wild type, 1 mg per kg (body weight) wild type and 0.1 mg per kg (body weight) NicA2 v321, P < 0.0001; n = 8 per treatment group and n = 7 for the 1 mg per kg (body weight) NicA2 v321 group; ND, s.e. not determined. b, Plasma nicotine levels after 5 d of nicotine exposure (24 h after injection of either vehicle or NicA2 treatments); additional statistical significance not shown on the figure: naive versus vehicle, 0.1 mg per kg (body weight) wild type, P < 0.0001; naive versus 1 mg per kg (body weight) wild type, P = 0.03; naive versus 0.1 mg per kg (body weight) NicA2 v321, P = 0.004; 1 mg per kg (body weight) NicA2 v321 versus 0.1 mg per kg (body weight) wild type, P < 0.0001; n = 8 per treatment group and n = 7 for the 1 mg per kg (body weight) NicA2 v321 and 1 mg per kg (body weight) wild type groups. Data were analyzed by one-way analysis of variance with Tukey’s multiple comparisons post hoc tests. The mean is plotted with error bars that represent the s.e. Source data
Extended Data Fig. 1
Extended Data Fig. 1. kcat/KM is not reliably selected for under plate selection conditions.
a, The top panel is a recreation of Fig. 1c with additional labels for comparison. Frequently mutated residues interrogated in Fig. 2 are bolded. b, kcat/KM values for variants listed in Supplementary Table 1 plotted based on the generation of the selection they were isolated from. The color scheme holds between this figure and Fig. 1 of the main text. Source data
Extended Data Fig. 2
Extended Data Fig. 2. Alignment of NicA2 variants tested for steady-state kinetic activity.
Red asterisks denote amino acid locations found to be mutated in greater than 15% of all sequences isolated from the selection. Sequences are colored for their degree of conservation using the BLOSUM62 score. Figure was prepared using Jalview.
Extended Data Fig. 3
Extended Data Fig. 3. NicA2 wildtype and variants maintain a similar melting temperature.
NicA2 proteins as listed in the figure were subject to the ThermoFAD melting assay to determine the temperature at which they unfolded, releasing their bound FAD. The melting temperature of each variant is displayed in its corresponding color. Displayed curves are the average of three replicates. Source data
Extended Data Fig. 4
Extended Data Fig. 4. Mutations in NicA2 v320.
The crystal structure of wildtype NicA2 is displayed with residues highlighted that are mutated in NicA2 v320. Note F104 in orange, A107 in purple, D130 in green, T319 in salmon, L449 in cornflower blue, and N462 in turquoise.
Extended Data Fig. 5
Extended Data Fig. 5. Binding and stopped flow reactions of NicA2 wildtype and v320.
a, Visible absorbance spectra of select time points for the reaction of reduced NicA2 v320 in the presence of 1 mM NMM with O2 (see Fig. 3b of main text). b, Stopped-flow absorbance traces for the interaction between oxidized NicA2 v320 and NMM at several NMM concentrations. The inset shows the kobs values of the reaction traces plotted against NMM concentration. Note that the kobs value was 0.08 s−1 for the secondary decrease in absorbance observed for the reaction of reduced NicA2 v320 in the presence of 1 mM NMM with O2 (Fig. 3b of main text), which matches the kobs value when oxidized v320 interacts with 1 mM NMM. c, Reduced NicA2 wildtype and v320 were titrated with NMM, monitoring absorbance at 510 nm to determine the binding coefficient. The inset shows the data points from the titration fit with the tight binding equation. d, Raw traces for the reactions of NicA2 wildtype and v320 with nicotine, both demonstrating biphasic traces. Note the logarithmic x-axis. Raw traces for reactions at all concentrations of nicotine can be seen in Supplementary Fig. 1j–l. e, kobs values for the reaction of wildtype NicA2 are plotted against the concentration of nicotine. kobs values from first phase was fit to a hyperbola, kobs from the second phase was invariant to nicotine concentration. f, kobs values for the reaction of NicA2 v320 are plotted against the concentration of nicotine, both were invariant to the nicotine concentration. g, The reaction of reduced NicA2 v320 with oxidized CycN was rapid, finishing in roughly 2 seconds similar to the reaction of wildtype NicA2. Source data
Extended Data Fig. 6
Extended Data Fig. 6. NicA2 wildtype has solvent exposed channels.
a, The crystal structure of wildtype NicA2 (PDB 5TTJ) is rendered with the solvent accessible surface area. The arrow marks a solvent exposed channel into the active site of NicA2. b, A different view of wildtype NicA2. The arrow marks a cavity on the surface of the protein that approaches the active site.
Extended Data Fig. 7
Extended Data Fig. 7. NicA2 wildtype and v321 have similar structures when bound by N-methylmyosmine.
We first attempted to crystallize NicA2 v320, but none of our crystals diffracted to adequate resolution for structure determination. We were fortunate to obtain well diffracting crystals of NicA2 v321 in both the ligand-free and NMM-bound forms. The mutational changes and kinetic parameters of v320 and v321 are similar, so the structural perturbations seen for v321 are likely informative for those in v320 and other variants that contain similar changes. a, Unbound NicA2 wildtype (PDB: 5TTJ) and v321 enzyme structures were overlaid, aligned at their flavin binding domains. b, Overlay of the active sites of the enzymes with A107T and H368R mutations rendered. c, NicA2 wildtype and v321 enzyme structures bound to N-methylmyosmine were overlaid, aligned at their flavin binding domains. d, Overlay of the active sites with A107T and H368R mutations rendered. Wildtype enzyme is rendered in cyan/blue, v321 in orange/salmon, Flavin adenine dinucleotide in yellow, and N-methylmyosmine in magenta.
Extended Data Fig. 8
Extended Data Fig. 8. Differential HDX-MS analysis of NicA2 v321 vs wildtype.
a, Peptide coverage map, showing the common peptides detected for wild-type and NicA2 v321. Peptides where the mutations are present are not included in these analyses. b, Woods’ plots showing the difference in deuterium uptake between peptides derived from wild-type or NicA2 v321 for the 0.5, 2, 5 min timepoints. Peptides that showed statistically significant deprotection in v321 are colored in red. No regions of protection from exchange were detected. The vertical thin blue lines represent the location of mutations between NicA2 wildtype and v321.
Extended Data Fig. 9
Extended Data Fig. 9. Differential HDX-MS analysis of NMM-bound NicA2 v321 vs wildtype.
a, Peptide coverage map, showing the common peptides detected for wild-type and NicA2 v321. Peptides where the mutations are present are not included in these analyses. b, Woods’ plots showing the difference in deuterium uptake between peptides derived from wild-type or NicA2 v321 when bound to NMM for the 0.5, 2, 5 min timepoints. Peptides that showed statistically significant deprotection in v321 are colored in red. No regions of protection from exchange were detected. The vertical thin blue lines represent the location of mutations between NicA2 wildtype and v321.
Extended Data Fig. 10
Extended Data Fig. 10. NicA2 wildtype and v321 titrations with NMM.
a, The signal for wildtype NicA2 Y342tmfF titrated with 0, 0.1, 0.5, and 2.5 mM NMM narrows with increasing NMM, indicating a more restricted sampling of local conformations. b, NicA2 v321 Y342tmfF titrated with NMM of the same concentrations as labeled, showing collapse into a single population. At increasing molar ratios, NMM yields a narrow major peak whose intensity increases with a concomitant decrease in the intensity of the apo- state peaks. Thus, NMM binding ‘pulls’ the distinct apo- state sub-ensembles that are in slow exchange into a single major conformation, one that presumably resembles the crystallized conformation of the NMM-bound NicA2 v321 complex. NMM, N-methylmyosmine. Source data

References

    1. Stead LF, et al. Physician advice for smoking cessation. Cochrane Database Syst. Rev. 2013;2013:CD000165. - PubMed
    1. Holford TR, et al. Tobacco control and the reduction in smoking-related premature deaths in the United States, 1964–2012. JAMA. 2014;311:164–171. - PMC - PubMed
    1. Xue S, Schlosburg JE, Janda KD. A new strategy for smoking cessation: characterization of a bacterial enzyme for the degradation of nicotine. J. Am. Chem. Soc. 2015;137:10136–10139. - PMC - PubMed
    1. Xue S, et al. An enzymatic advance in nicotine cessation therapy. Chem. Commun. 2018;54:1686–1689. - PMC - PubMed
    1. Kallupi M, Xue S, Zhou B, Janda KD, George O. An enzymatic approach reverses nicotine dependence, decreases compulsive-like intake, and prevents relapse. Sci. Adv. 2018;4:eaat4751. - PMC - PubMed

Publication types