. 2023 Nov;30(11):1695-1706.
doi: 10.1038/s41594-023-01111-7. Epub 2023 Sep 28.

Structure and activation of the RING E3 ubiquitin ligase TRIM72 on the membrane

Affiliations

Structure and activation of the RING E3 ubiquitin ligase TRIM72 on the membrane

Si Hoon Park et al. Nat Struct Mol Biol. 2023 Nov.

Erratum in

Abstract

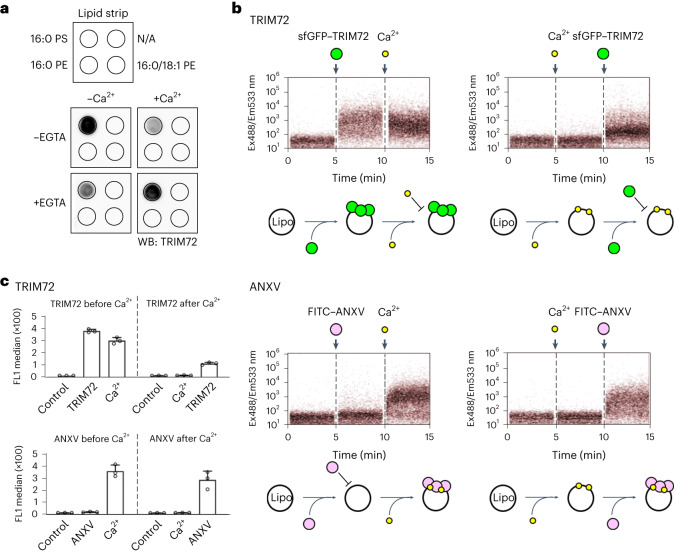
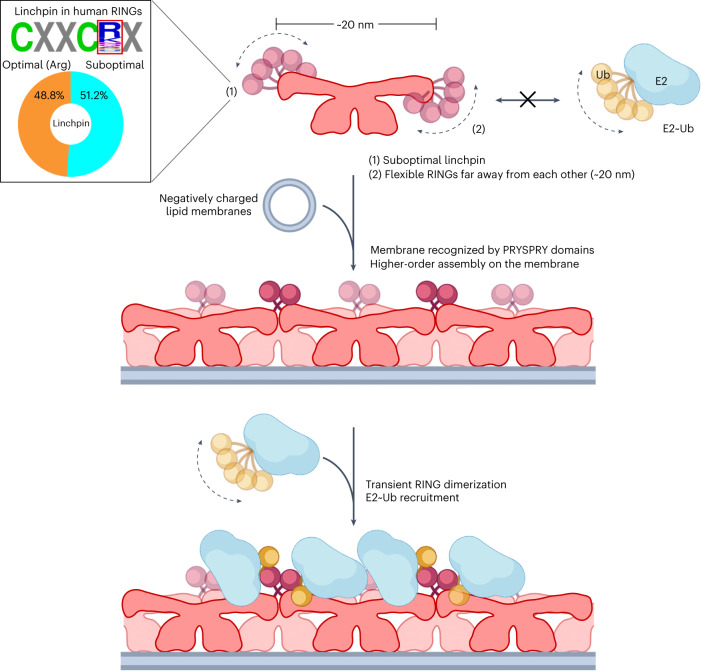
Defects in plasma membrane repair can lead to muscle and heart diseases in humans. Tripartite motif-containing protein (TRIM)72 (mitsugumin 53; MG53) has been determined to rapidly nucleate vesicles at the site of membrane damage, but the underlying molecular mechanisms remain poorly understood. Here we present the structure of Mus musculus TRIM72, a complete model of a TRIM E3 ubiquitin ligase. We demonstrated that the interaction between TRIM72 and phosphatidylserine-enriched membranes is necessary for its oligomeric assembly and ubiquitination activity. Using cryogenic electron tomography and subtomogram averaging, we elucidated a higher-order model of TRIM72 assembly on the phospholipid bilayer. Combining structural and biochemical techniques, we developed a working molecular model of TRIM72, providing insights into the regulation of RING-type E3 ligases through the cooperation of multiple domains in higher-order assemblies. Our findings establish a fundamental basis for the study of TRIM E3 ligases and have therapeutic implications for diseases associated with membrane repair.


Conflict of interest statement

The authors declare no competing interests.

Figures

Fig. 1
Fig. 1. Crystal structure of TRIM72.
a, Domain organization of TRIM72. Each domain and small motif is shown as follows: RING (green); L1 linker, B-box (orange); H1 helix (pink); helix-turn-helix, H2 helix (cyan); L2 linker (mint); H3 helix (yellow); and PRYSPRY (magenta). The residues are numbered based on the mouse TRIM72 sequence. b, Overall structure of mouse TRIM72 represented by a surface model with a ribbon diagram. The color of each domain corresponds to the domain architecture in a. The second protomer is labeled with a prime symbol (′) and is shown in a less-vibrant color. The structural models were derived from mouse TRIM72 ΔRING (2.75 Å), except for the RING domain (green), which came from TRIM72 FL (4.6 Å).
Fig. 2
Fig. 2. Membrane binding of TRIM72 requires a pair of PRYSPRY domains.
a, Ribbon structure of the PRYSPRY domain of TRIM72. Positively charged lysine and arginine residues are shown in a stick model and labeled. Ct indicates carboxyl terminus. b, Electrostatic potential surfaces of PRYSPRY domains. The positively charged surface of each PRYSPRY domain is maintained by the interaction between H3:H3′ helices (yellow). The second protomer is labeled with a prime symbol (′). c, Saturation curves for TRIM72 binding to PS liposomes (lipo) with PS concentrations of 30 mol% (red) and 10 mol% (blue). d, Liposome coflotation assay with TRIM72 WT and mutants using sucrose density gradients. The fractions collected in tubes are indicated from top to bottom. TRIM72 was detected with an anti-TRIM72 antibody. PC, phosphatidylcholine-containing liposomes; PS, PS liposomes (30 mol% PS). WB, western blot. X and O indicate non-binding and binding, respectively. e, Subcellular fractionation of TRIM72 in C2C12 myoblasts. Membrane (Mem) and cytosol (Cyto) fractions are indicated. The experimental scheme (top) was created with BioRender.com. Western blotting results are shown in Supplementary Fig. 4. Independent experiments were performed in triplicate. Data are presented as mean values with error bars representing s.d. Details of the mutants used in the experiments are provided in Supplementary Table 1. Source data
Fig. 3
Fig. 3. Higher-order TRIM72 assembly on the lipid bilayer.
a, Cryo-ET maps of the reconstituted TRIM72 proteoliposome. Top view (left) and front view (right) are shown with subtomogram averaging reconstruction density contoured at 1 σ. b, Higher-order TRIM72-assembly model on the lipid bilayer. Top left, front view (perpendicular to the lipid surface) of the TRIM72-assembly model with a subtomogram averaging map contoured at 1 σ. Top right, the black box in the front view is enlarged to a close-up view. The top view (parallel to the lipid surface, bottom left) and a sliced view (bottom right) of the TRIM72 assembly. The black boxes in the top view are represented as ribbon diagrams in d,e. The highlighted TRIM72 protomers in the dimer are colored red and blue, respectively. The lipid bilayer models are shown in stick representation in green (top right). Subtomogram averaging reconstruction maps of the TRIM72 assembly and lipid bilayer are colored in white and pink, respectively. c, Assembly pattern of TRIM72 as observed in subtomogram averaging reconstruction. Averages of z slices correspond to the middle and front view in b. The relative intensities according to the y axis (right; red) and the x axis (bottom; blue) were calculated from the averaged z slices of the front view. Numbers in italics (15) indicate each column-like density corresponding to the PRYSPRY domain. Note that the regular intervals between the PRYSPRY densities are 6 nm (bottom). Black scale bars, 5 nm in ac. d, Interface between B-boxes. Interacting residues and zinc ions are shown in stick and sphere models, respectively. e, Interface between H1 helices in the CCDs. f, Circle plots of cross-linked cysteine residues of TRIM72 with or without PS liposomes. Frequently identified cross-linked pairs are shown as thick lines. Homotypic cysteine-bridged pairs are shown in red and were identified in the presence of PS liposomes. g, Liposome co-sedimentation assay of TRIM72 WT and mutants. The experimental scheme is shown at the top; the image was created with BioRender.com. PC liposomes, phosphatidylcholine-containing liposomes; pel, pellet; sup, supernatant. Source data
Fig. 4
Fig. 4. Ubiquitination activity of TRIM72.
a, Ubiquitination activity of TRIM72 in the presence or absence of PS liposomes. b, Increased ubiquitination activity of TRIM72Q57R in the presence or absence of PS liposomes. c, Ubiquitination activity of TRIM72Q57R and TRIM72Q57R/L74R in the presence or absence of PS liposomes. d, Ubiquitination activity of endogenous microvesicle-bound or free-solution states of TRIM72Q57R and TRIM72Q57R/L74R. e, Ubiquitination activity of RING and 2×RING constructs with TRIM72 WT and TRIM72Q57R. f, Ubiquitination activity of RING and 2×RING constructs with TRIM72Q57R and TRIM5α. TRIM72 proteoliposomes were reconstituted and further separated by SEC (ac). TRIM72 microvesicles were purified from HEK293T cells and isolated by SEC (d). Poly-Ub is represented as a polyubiquitination ladder. Bands close to 140 kDa were assumed to be ubiquitin-like modifier activating enzyme 1 (UBA1)~Ub. Ub was detected with an anti-Ub antibody. Strep-tagged TRIM72 or intact TRIM72 was detected using an anti-Strep-tag antibody or an anti-TRIM72 antibody, respectively (ad). The superfolder variant of green fluorescent protein (sfGFP)-fused RING and 2×RING constructs were detected with an anti-GFP antibody (e,f). Phospholipids were stained with Sudan Black B (ac). Microvesicles were detected with an anti-Na+–K+ ATPase α1 antibody (d). Independent experiments were performed in triplicate. TRIM72 WT, green; TRIM72Q57R, pink; TRIM72Q57R/L74R, cyan; TRIM72 RING_WT, yellow; TRIM72 RING_Q57R, light pink; TRIM5α RING, magenta. Source data
Fig. 5
Fig. 5. Effect of Ca2+ on membrane binding of TRIM72.
a, Protein–lipid overlay analysis showing the interference. TRIM72 proteins were incubated with lipid strips in the presence or absence of Ca2+ and/or EGTA and then probed with an anti-TRIM72 antibody. PE, phosphatidylethanolamine. N/A indicates phospholipid is not applied. b, Flow cytometry analysis comparing the effects of Ca2+ on TRIM72 and annexin V (ANXV). PS liposomes were preloaded with Ca2+ or loaded after Ca2+ exposure and then incubated with TRIM72 or annexin V. Binding was detected using fluorescently labeled sfGFP–TRIM72 and fluorescein isothiocyanate (FITC)–annexin V. Ex488/Em533 nm, excitation at 488 nm/emission at 533 nm. c, Quantification of the data in b. Experiments were performed in triplicate. Data are presented as mean values ± s.d. The PS concentration was 30 mol% in PS liposomes. Ca2+ ion, yellow; TRIM72, green; annexin V, pink. Source data
Fig. 6
Fig. 6. Proposed working model of TRIM72 activation on the membrane.
In the solution state (top), TRIM72 (rose gold) cannot recruit E2~Ub (cyan, yellow) conjugates for Ub (yellow) transfer. The flexibility of the RING domain (pink) at both ends of the dimeric TRIM72 and dynamic Ub-conjugating E2 enzymes is indicated by curved dashed lines with arrows. Although B-boxes and CCDs at both ends are also moved in the perpendicular direction, this is not depicted in this model for clarity. The amino acid frequency of the linchpin is shown in a black-lined box. The linchpin, positioned at the residue following the final Zn2+-coordinated cysteine, was analyzed in 303 sequences of human RING domains (Supplementary Data 3). Note that ~50% of RING domains have a suboptimal linchpin, including TRIM72 (glutamine linchpin). The higher-order TRIM72 assembly on the negatively charged membrane (middle) and the active-state model with E2~Ub conjugates (bottom) are shown. When dimeric TRIM72 is targeted to PS-containing vesicles or PS-enriched plasma membranes, it primarily binds to the membrane via the PRYSPRY domain. Next, higher-order TRIM72 assembly is mediated by cooperative interactions among B-box–B-box and CCD–CCD. In this assembly, dynamic RING domains reduce the motion, and intermolecular RING dimer formation occurs. The next layered TRIM72 oligomer in the assembly is shown in a less-vibrant color. Finally, the functional ternary complex is stable enough for efficient Ub transfer. The model was created with BioRender.com. Source data
Extended Data Fig. 1
Extended Data Fig. 1. SEC-MALS and SEC-SAXS analysis of TRIM72.
a, SDS‒PAGE analysis of TRIM72 WT and ΔRING. All proteins used in this study were purified to equivalent purity. b, SEC-MALS profiles of TRIM72 WT at various concentrations. The relative Rayleigh ratios (left axis) and molecular masses (right axis) are shown as dashed lines and open circles of the same color for each concentration, respectively (11.2 mg/ml, red; 5.6 mg/ml, blue; 2.8 mg/ml, green). c-d, SEC-SAXS profiles of TRIM72 WT (c) and ΔRING (d). The average intensity (left axis) is shown as a dashed line. The values (right axis) with volume of correction (Vc) and radius of gyration (Rg) are indicated by open circles in green and red, respectively. ef, Scattering intensity, Guinier and Kratky plots, and paired distance distribution function P(r) of TRIM72 WT (e) and ΔRING (f). All SAXS analyses were performed using the average of the peak fractions of SEC-SAXS for each protein. Source data
Extended Data Fig. 2
Extended Data Fig. 2. Comparison of the ligand binding sites among PRYSPRY domains.
a-f, Structural comparison of PRYSPRY domains. Mouse TRIM72 PRYSPRY in dimer (a), rhesus TRIM5α PRYSPRY (b), human TRIM7 PRYSPRY complexed with 2 C peptides of human enterovirus (c), human TRIM21 PRYSPRY complexed with human IgG Fc (d), human TRIM65 PRYSPRY complexed with human MDA5 helicase domain (e), and human RIPLET PRYSPRY complexed with the human RIG-I helicase domain (f). The PRYSPRY domains are shown in a ribbon diagram and electrostatic surface model with transparency. The binding molecules within 10 Å distances of PRYSPRY are shown in a ribbon diagram colored yellow. The PRYSPRY domain of mouse TRIM72 was derived from the crystal structure of TRIM72 ΔRING (2.75 Å). g, Structure-based sequence alignments of PRYSPRY domains corresponding to a-f. Mutated residues of mouse TRIM72 in this study are shown in red boxes. Potentially essential residues of TRIM72 in membrane binding are indicated as pink boxes. The proposed residues of rhesus TRIM5α PRYSPRY for recognizing HIV capsids as indicated by NMR and HIV-1 restriction assays are shown in orange boxes. Pro334 in rhesus TRIM5α (Arg332 in humans), which is a critical residue for HIV restriction, is highlighted with a yellow box. The important residues of human TRIM7 PRYSPRY for recognizing C2 peptides from human enterovirus are shown in magenta boxes. Four hotspot residues of human TRIM21 PRYSPRY in contact with human IgG Fc are shown in mint boxes. The critical residues in human TRIM65 PRYSPRY for IFNβ mRNA levels upon poly (I:C) stimulation are shown in cyan boxes. The important residues in human RIPLET PRYSPRY for IFNβ mRNA levels upon stimulation with dsRNA are shown in green boxes. All boxed residues are represented as stick models in a-f. The variable loop (VL) regions 1-6 are indicated as black-lined boxes. Note that the critical residues are crowded in VL1, VL3, VL4, and VL6. The mutated residues in the H3 helix for crystallization of mouse TRIM72 (K279H/A283H) are shown in blue.
Extended Data Fig. 3
Extended Data Fig. 3. Protein–lipid overlay analysis.
a-d, Protein–lipid overlay assay using PIP StripsTM (a), Inositol Snoopers® (b), Oxidized Phospholipid Snoopers® (c) and Sphingolipid Snoopers® (d) in the absence (left) or presence (middle) of Ca2+. The spotted lipid positions are indicated in the right panel. e, Lists of the examined lipids. TRIM72 WT was incubated and detected with a rabbit polyclonal anti-TRIM72 antibody. The detailed experimental procedures are described in the Methods. Source data
Extended Data Fig. 4
Extended Data Fig. 4. SPR analysis of TRIM72 WT and variants.
a, Binding affinity KD values of TRIM72 WT and variants to PS-liposomes. n.d., not determined. b-h, Sensorgrams with different concentrations of TRIM72 WT (b), K2D (c), R3E (d), ΔH3 (e), RBCC (f), GST-H3-PRYSPRY (g), and MBP-H3-PRYSPRY (h) are shown. The first and second vertical dashed lines indicate the start and end of the injection, respectively. The PS-liposomes contained 30 mol% PS. The detailed experimental procedures are described in the Methods. Source data
Extended Data Fig. 5
Extended Data Fig. 5. Crosslinking assays to identify the TRIM72 oligomer.
a, Overall scheme of the time-dependent crosslinking assay. b-e, Time-dependent crosslinking analysis of mouse TRIM72 WT (b) and variants (c-e). Note that each variant of K2D (c), R3E (d), and ΔH3 (e) forms almost no high-molecular-weight crosslinked oligomers. All PS-liposomes contained 30 mol% PS.
Extended Data Fig. 6
Extended Data Fig. 6. Higher-order TRIM72 assembly on both microvesicles and liposomes.
a, Time-dependent crosslinking analysis of TRIM72 WT purified from mammalian cells. b, SEC profiles of TRIM72 expressed in mammalian cells (blue line) and in vitro-reconstituted TRIM72 proteoliposomes (red line). The fractions containing TRIM72 bound to microvesicles or liposomes and TRIM72 in solution are indicated by arrows colored green and pink, respectively. c, Negative-stained TEM images of TRIM72 bound to microvesicles at low (left) and high magnifications (right). d, TEM images of the negatively stained TRIM72 proteoliposomes. (c, d) Higher-order TRIM72 assemblies are indicated by black arrowheads. The red and black scale bars indicate 100 and 20 nm, respectively. e, Cryo-electron tomograms (left) visualized by 3D volume rendering (right) showing the higher-order TRIM72 assembly on the inside convex (up) and outside concave (down) sides of small liposomes. The TRIM72 assembly and liposomal membranes are colored cyan and white, respectively. The black scale bars indicate 20 nm in e. Source data
Extended Data Fig. 7
Extended Data Fig. 7. Subtomogram averaging reconstruction of the higher-order TRIM72 WT assembly.
a, Data processing of subtomogram averaging of the TRIM72 assembly. b, Angular distribution of the final refined map. c, Contour analysis of TRIM72 assembly. Note that the higher-order TRIM72 assembly is clearly distinguished from the phospholipid bilayer. The black scale bars indicate 100 nm (b, c). d, Fourier shell correlation (FSC) curve of the final refined subtomogram averaging map of the TRIM72 WT assembly. FSC curve calculated from two independently refined half-maps indicating the overall estimated resolution at 25 Å based on a 0.143 FSC criterion. The cryoET statistics of the TRIM72 WT assembly are summarized in Table 2. Source data
Extended Data Fig. 8
Extended Data Fig. 8. CryoET and subtomogram averaging reconstruction of the higher-order TRIM72 M138R assembly.
a, Liposome cosedimentation analysis. b, Micrograph of the TRIM72 M138A proteoliposome. c, Tomogram slices of TRIM72 WT (left) and M138R proteoliposomes (right). The black boxes in the top panels are enlarged in the bottom panels. Note that the TRIM72 assemblies are shown in both TRIM72 WT and M138R but not in M138A. The black and white scale bars indicate 100 nm and 20 nm, respectively. (b,c). d, Subtomogram averaging reconstruction of TRIM72 M138R. The averages of Z-slices correspond to the middle (left) and front view (middle). The relative intensity according to the x-axis (left) was calculated from the averaged Z-slices of the front view. The number in italics (1-5) indicates each column-like density. The regular intervals between the peak density are 6 nm, in agreement with the intervals observed for the TRIM72 WT assembly. The black scale bar indicates 5 nm in d. e, Angular distribution of the final refined map. f, higher-order TRIM72 M138R assembly fitted into the subtomogram averaging map. The black scale bars indicate 100 nm (e,f). g, FSC curve of the final refined subtomogram averaging map of the TRIM72 M138R assembly. FSC curve calculated from two independently refined half-maps indicating overall resolution at 26 Å based on the 0.143 FSC criterion. The cryoET statistics are summarized in Table 2. Source data

Similar articles

Cited by

References

    1. Dias, C. & Nylandsted, J. Plasma membrane integrity in health and disease: significance and therapeutic potential. Cell Discov.7, 4 (2021). - PMC - PubMed
    1. McNeil, P. L. & Kirchhausen, T. An emergency response team for membrane repair. Nat. Rev. Mol. Cell Biol.6, 499–505 (2005). - PubMed
    1. Cooper, S. T. & McNeil, P. L. Membrane repair: mechanisms and pathophysiology. Physiol. Rev.95, 1205–1240 (2015). - PMC - PubMed
    1. Liu, J. et al. Dysferlin, a novel skeletal muscle gene, is mutated in Miyoshi myopathy and limb girdle muscular dystrophy. Nat. Genet.20, 31–36 (1998). - PubMed
    1. Sun, M. et al. Mucolipidosis type IV is caused by mutations in a gene encoding a novel transient receptor potential channel. Hum. Mol. Genet.9, 2471–2478 (2000). - PubMed