

Identification of apoptosis-related key genes and the associated regulation mechanism in thoracic aortic aneurysm
- PMID: 37770840
- PMCID: PMC10540322
- DOI: 10.1186/s12872-023-03516-0
Identification of apoptosis-related key genes and the associated regulation mechanism in thoracic aortic aneurysm
Abstract
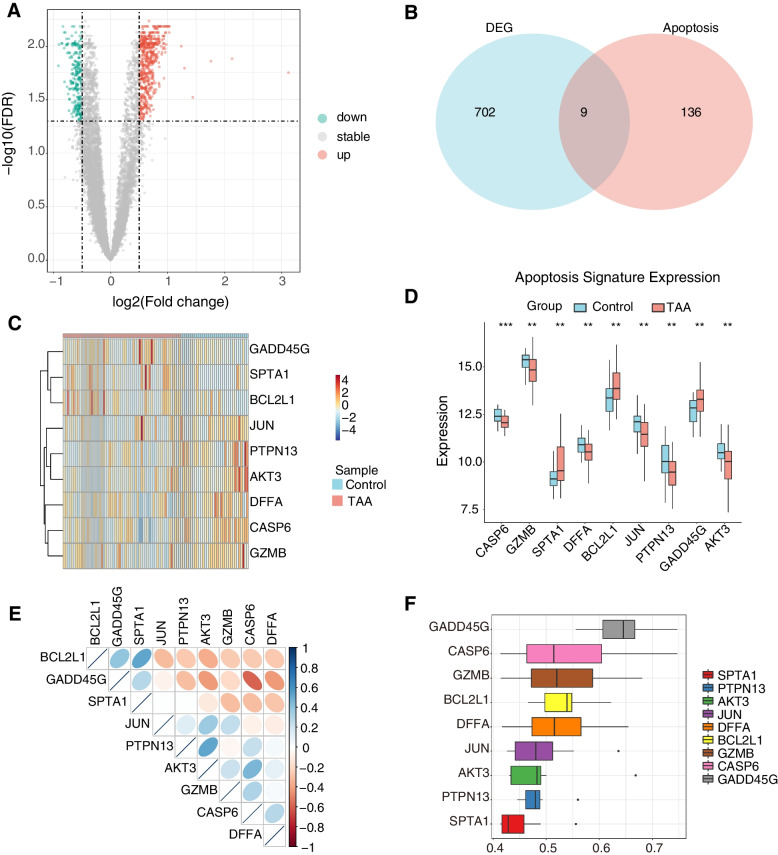
Background: This study investigated the role of apoptosis-related genes in thoracic aortic aneurysms (TAA) and provided more insights into TAA's pathogenesis and molecular mechanisms.
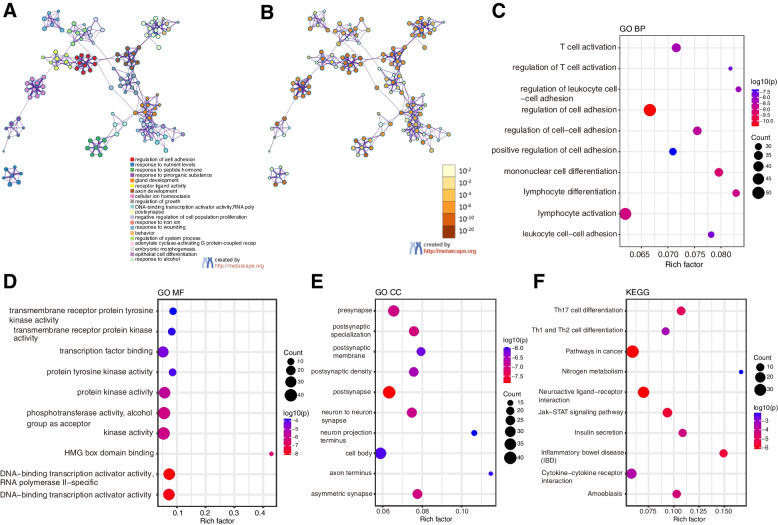
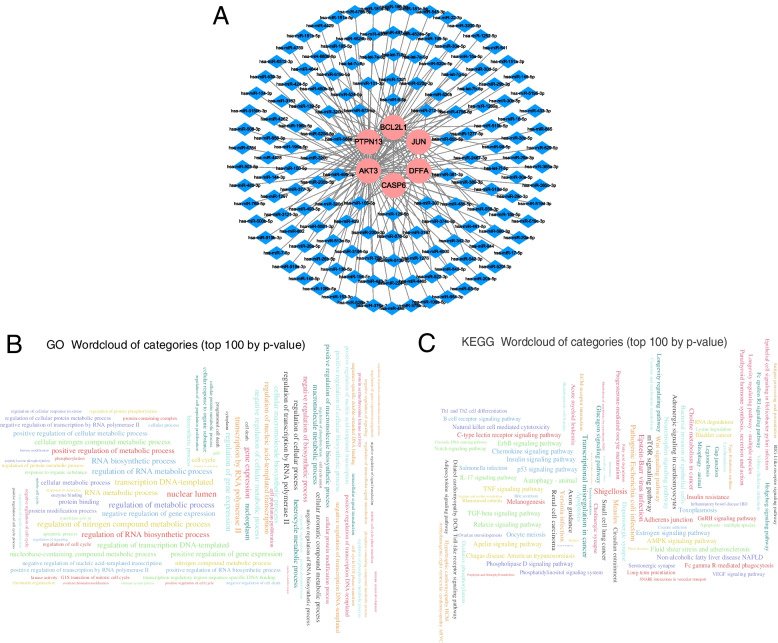
Material/methods: Two gene expression datasets (GSE9106 and GSE26155) were retrieved from the Gene Expression Omnibus (GEO) database. Apoptosis-related genes were obtained from the KEGG apoptosis pathway (hsa04210). Differentially expressed apoptosis-related genes were identified by performing differential expression analysis using limma for TAA blood and tissue samples. GO and KEGG enrichment analysis of the differentially expressed apoptosis genes was performed using the Metascape web tool. The miRNA-mRNA regulatory network was reconstructed using the ENCORI and miRDB databases, and functional enrichment analysis was performed on the related miRNAs using the miEAA tool. The correlation between the expression levels of differentially expressed apoptosis-related genes and genes involved in immune infiltration in TAA was calculated using the CIBERSORT algorithm. The apoptosis modification patterns mediated by differentially expressed apoptosis-related genes were systematically assessed in TAA samples.
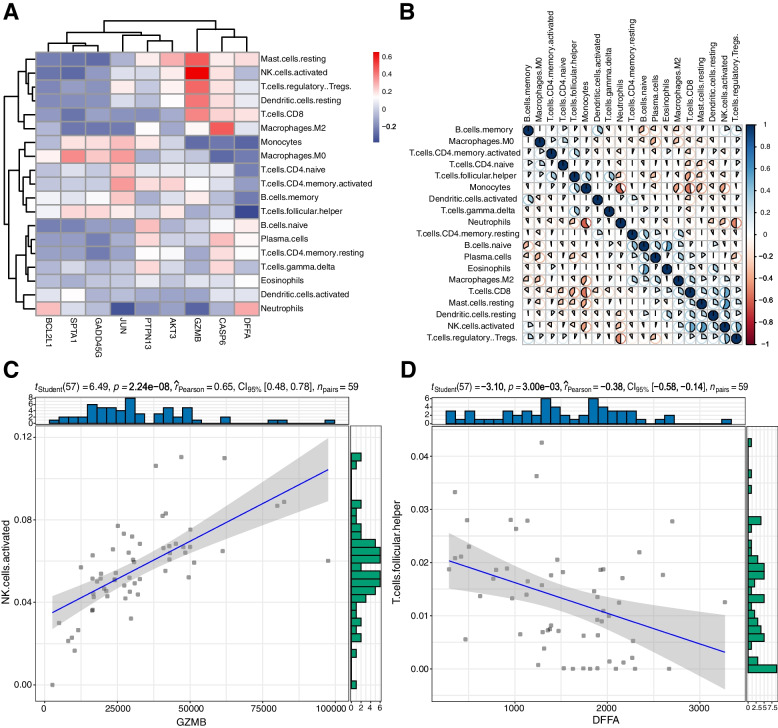
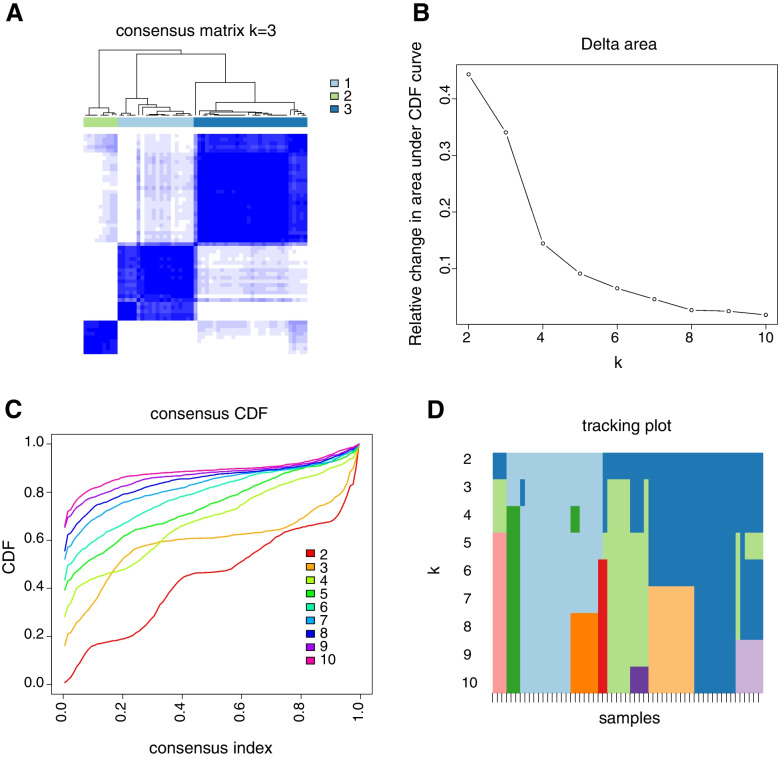
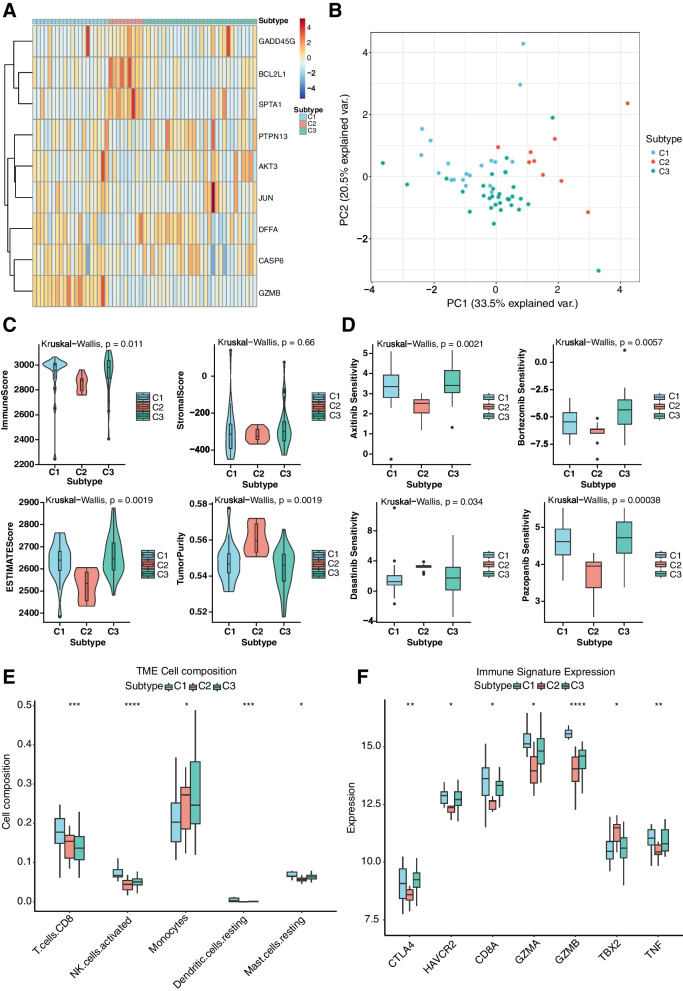
Results: A total of 9 differentially-expressed apoptosis-related genes were identified in TAA samples compared with normal samples. 150 miRNAs and 6 mRNAs regulatory networks were reconstructed using the ENCORI and miRDB databases. Immune infiltration analysis revealed that the GZMB had the strongest positive correlation with activated NK cells and the DFFA presented the strongest positive correlation with T cells follicular helper. 3 distinct apoptosis modification patterns mediated by 9 differentially-expressed apoptosis-related genes were identified. They differ in immune characteristics and drug sensitivity, and their biological functions in these subtypes were further studied.
Conclusions: This study identified key apoptosis-related genes related to TAA and evaluated the modification patterns of key apoptosis genes in TAA, providing insights into potential targets and mechanisms of TAA pathogenesis and progression.
Keywords: Apoptosis; Bioinformatical analysis; RNA modification; Thoracic aortic aneurysm; Transcriptomics.
© 2023. The Author(s).
Conflict of interest statement
The authors declare no competing interests.
Figures


Similar articles
-
Exploring the Molecular Mechanism of Thoracic Aortic Aneurysm via Bioinformatics Analysis.Med Sci Monit. 2018 Mar 14;24:1533-1539. doi: 10.12659/msm.905970. Med Sci Monit. 2018. PMID: 29538353 Free PMC article.
-
Weighted miRNA co-expression network reveals potential roles of apoptosis related pathways and crucial genes in thoracic aortic aneurysm.J Thorac Dis. 2021 May;13(5):2776-2789. doi: 10.21037/jtd-20-3601. J Thorac Dis. 2021. PMID: 34164170 Free PMC article.
-
Effects of COL1A1 and SYTL2 on inflammatory cell infiltration and poor extracellular matrix remodeling of the vascular wall in thoracic aortic aneurysm.Chin Med J (Engl). 2024 May 5;137(9):1105-1114. doi: 10.1097/CM9.0000000000002808. Epub 2023 Aug 28. Chin Med J (Engl). 2024. PMID: 37640670 Free PMC article.
-
The potential role of chemotaxis and the complement system in the formation and progression of thoracic aortic aneurysms inferred from the weighted gene coexpression network analysis.J Transl Med. 2021 Feb 2;19(1):49. doi: 10.1186/s12967-021-02716-6. J Transl Med. 2021. PMID: 33531038 Free PMC article.
-
Common molecular mechanism and immune infiltration patterns of thoracic and abdominal aortic aneurysms.Front Immunol. 2022 Oct 21;13:1030976. doi: 10.3389/fimmu.2022.1030976. eCollection 2022. Front Immunol. 2022. PMID: 36341412 Free PMC article.
Cited by
-
Sevoflurane and Propofol Co-affect the Development of Colorectal Cancer by Regulating TM2D1.Comb Chem High Throughput Screen. 2025;28(10):1669-1678. doi: 10.2174/0113862073281046240527165415. Comb Chem High Throughput Screen. 2025. PMID: 38920064
References
-
- Senser EM, Misra S, Henkin S. Thoracic aortic aneurysm: a clinical review. Cardiol Clin. 2021;39(4):505–515. - PubMed
-
- Elefteriades JA, Farkas EA. Thoracic aortic aneurysm clinically pertinent controversies and uncertainties. J Am Coll Cardiol. 2010;55(9):841–857. - PubMed
-
- D'Arcy MS. Cell death: a review of the major forms of apoptosis, necrosis and autophagy. Cell Biol Int. 2019;43(6):582–592. - PubMed
Publication types
MeSH terms
Substances
Grants and funding
LinkOut - more resources
Full Text Sources
