

Meta-analysis of senescent cell secretomes to identify common and specific features of the different senescent phenotypes: a tool for developing new senotherapeutics
- PMID: 37770897
- PMCID: PMC10537976
- DOI: 10.1186/s12964-023-01280-4
Meta-analysis of senescent cell secretomes to identify common and specific features of the different senescent phenotypes: a tool for developing new senotherapeutics
Abstract
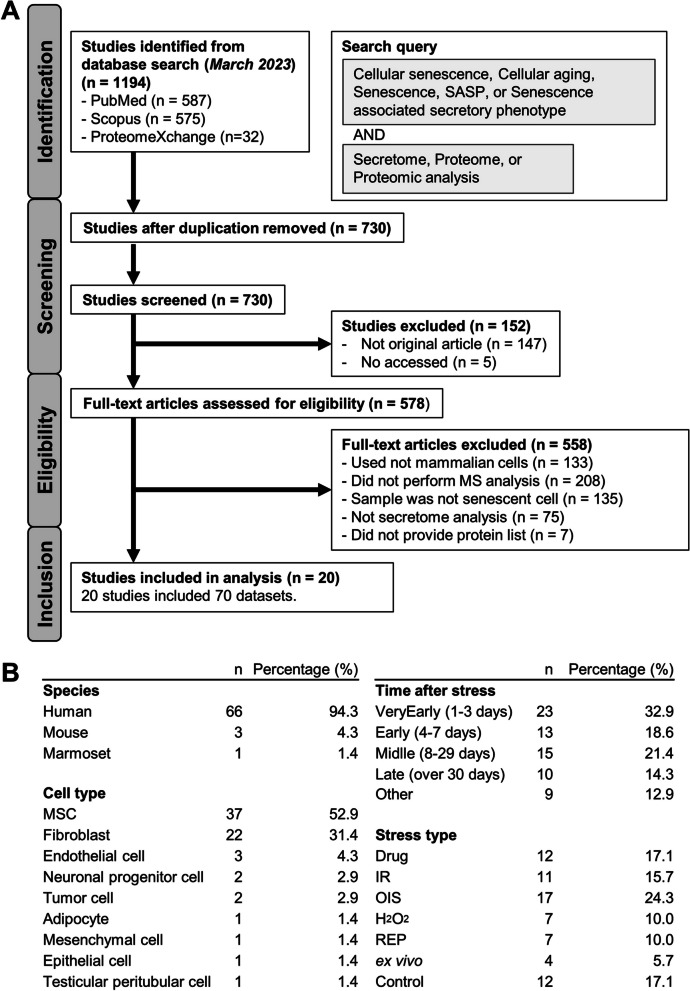
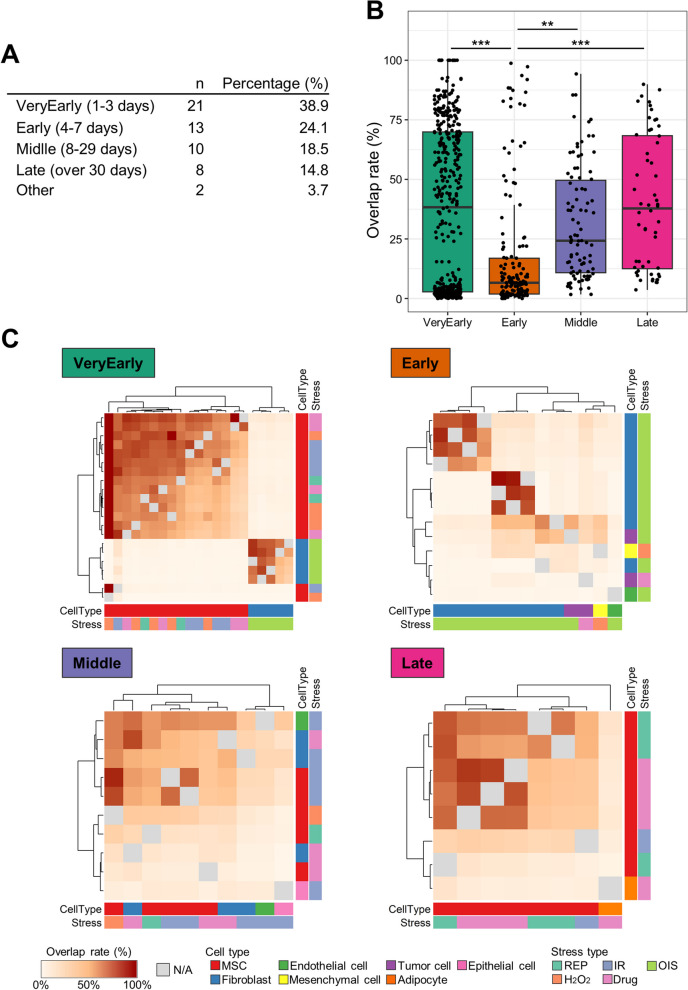
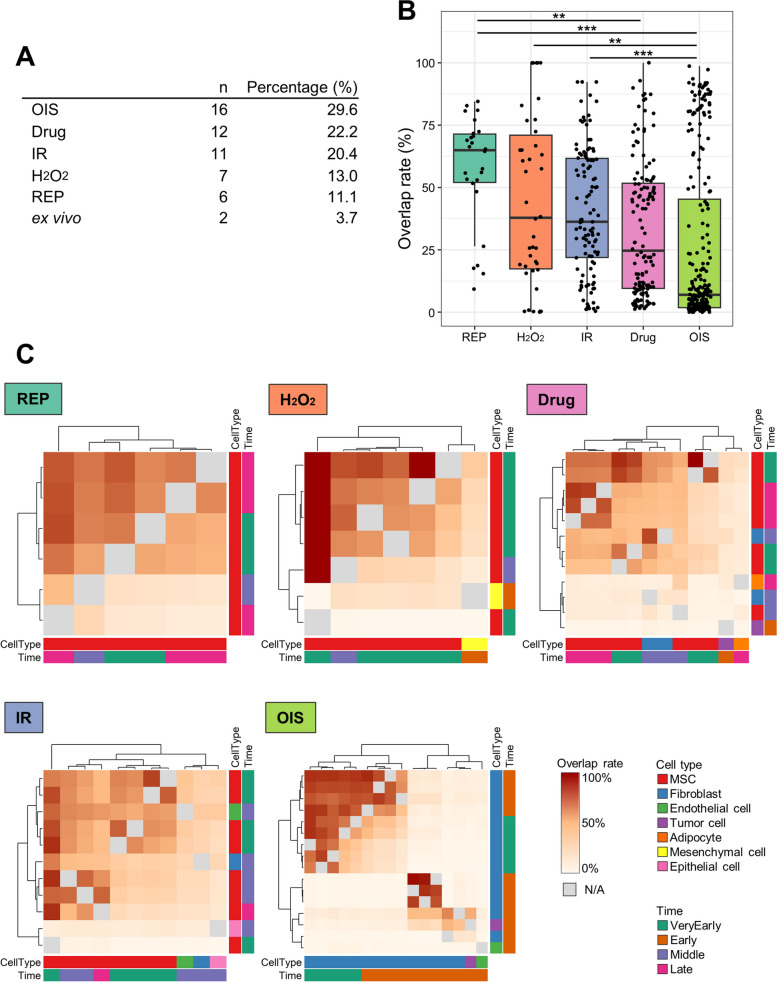
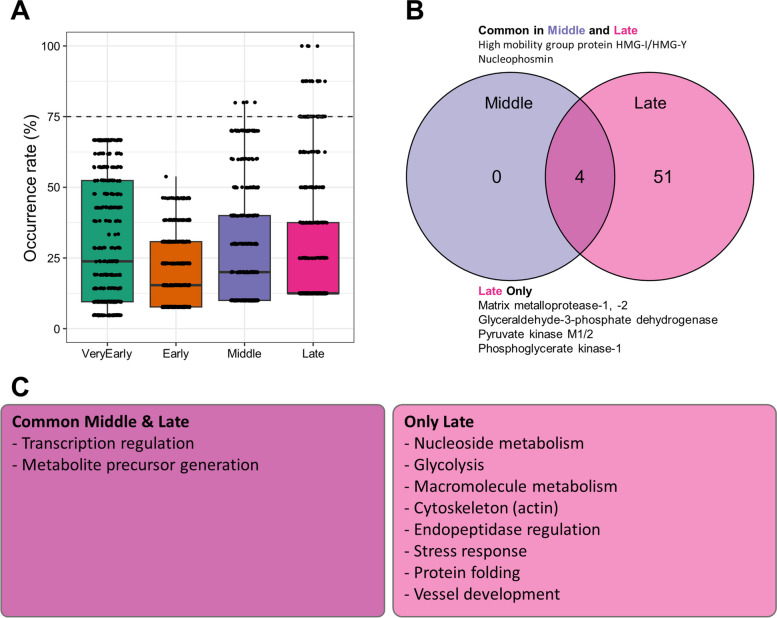
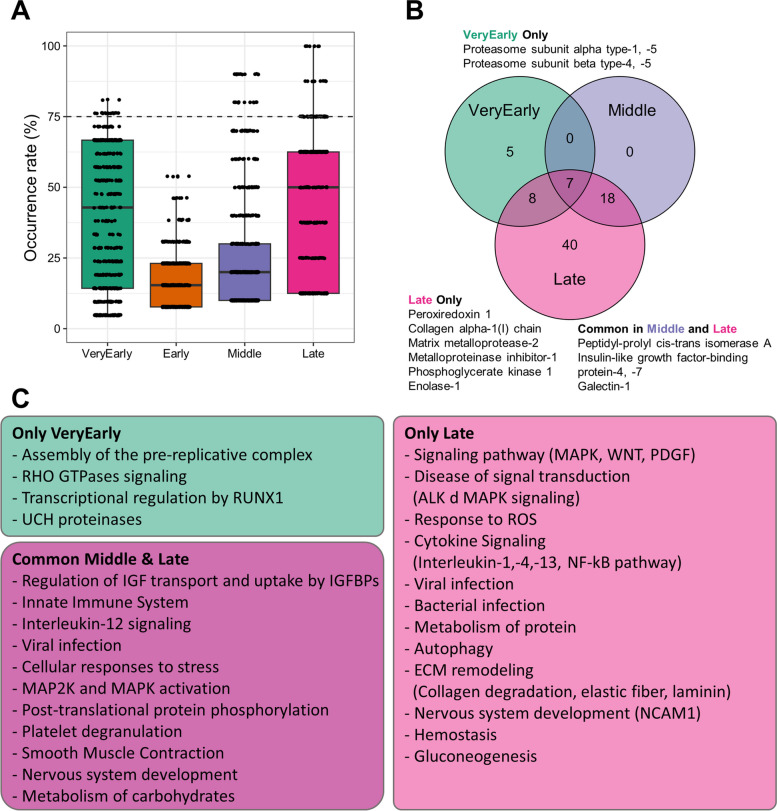
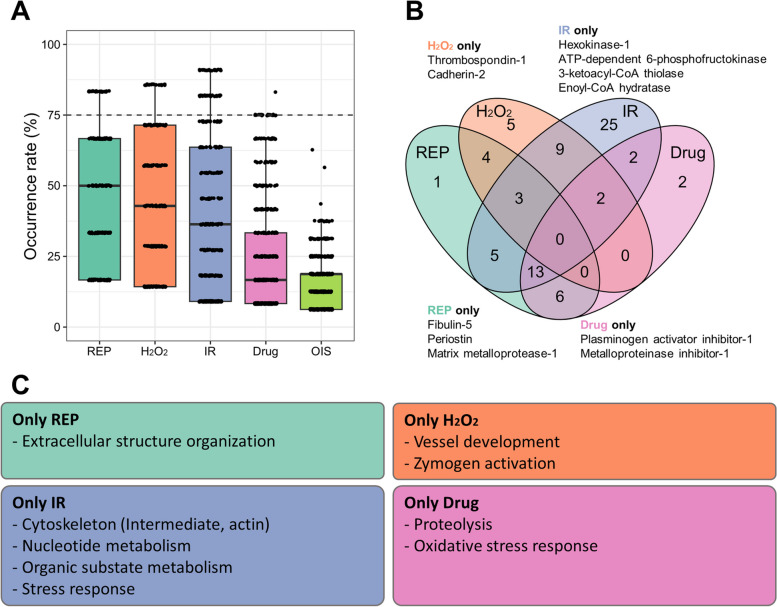
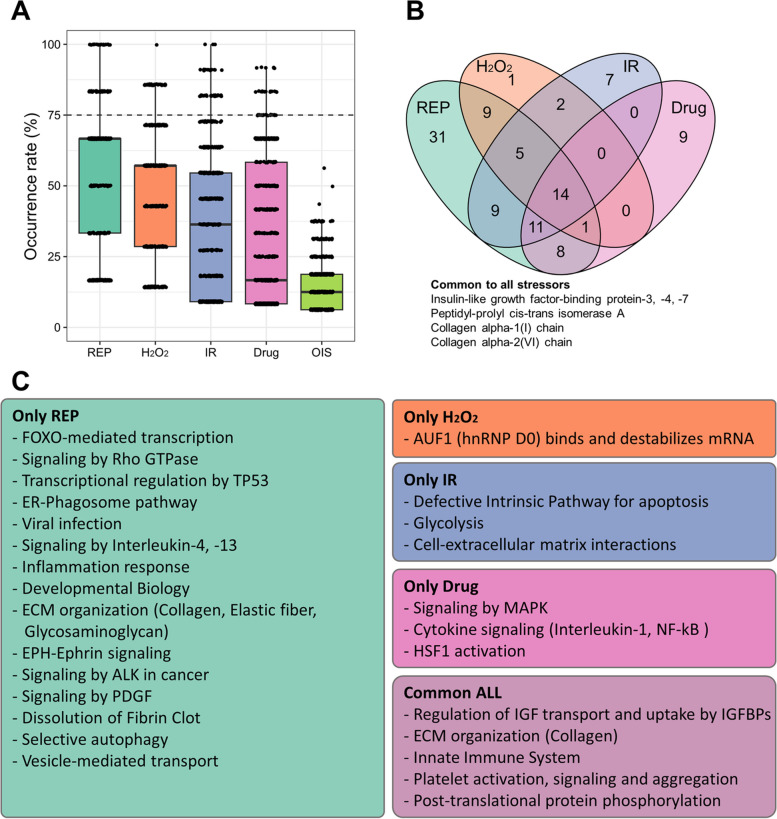
DNA damage resulting from genotoxic injury can initiate cellular senescence, a state characterized by alterations in cellular metabolism, lysosomal activity, and the secretion of factors collectively known as the senescence-associated secretory phenotype (SASP). Senescence can have beneficial effects on our bodies, such as anti-cancer properties, wound healing, and tissue development, which are attributed to the SASP produced by senescent cells in their intermediate stages. However, senescence can also promote cancer and aging, primarily due to the pro-inflammatory activity of SASP.Studying senescence is complex due to various factors involved. Genotoxic stimuli cause random damage to cellular macromolecules, leading to variations in the senescent phenotype from cell to cell, despite a shared program. Furthermore, senescence is a dynamic process that cannot be analyzed as a static endpoint, adding further complexity.Investigating SASP is particularly intriguing as it reveals how a senescence process triggered in a few cells can spread to many others, resulting in either positive or negative consequences for health. In our study, we conducted a meta-analysis of the protein content of SASP obtained from different research groups, including our own. We categorized the collected omic data based on: i) cell type, ii) harmful agent, and iii) senescence stage (early and late senescence).By employing Gene Ontology and Network analysis on the omic data, we identified common and specific features of different senescent phenotypes. This research has the potential to pave the way for the development of new senotherapeutic drugs aimed at combating the negative consequences associated with the senescence process. Video Abstract.
Keywords: Meta-analysis; SASP; Secretome; Senescence.
© 2023. The Author(s).
Conflict of interest statement
The authors declare no competing interests.
Figures
Similar articles
-
The implication of ROCK 2 as a potential senotherapeutic target via the suppression of the harmful effects of the SASP: Do senescent cancer cells really engulf the other cells?Cell Signal. 2021 Aug;84:110007. doi: 10.1016/j.cellsig.2021.110007. Epub 2021 Apr 13. Cell Signal. 2021. PMID: 33845155
-
Cellular senescence in bone.Bone. 2019 Apr;121:121-133. doi: 10.1016/j.bone.2019.01.015. Epub 2019 Jan 16. Bone. 2019. PMID: 30659978 Free PMC article. Review.
-
Keeping the senescence secretome under control: Molecular reins on the senescence-associated secretory phenotype.Exp Gerontol. 2016 Sep;82:39-49. doi: 10.1016/j.exger.2016.05.010. Epub 2016 May 25. Exp Gerontol. 2016. PMID: 27235851 Review.
-
Targeting cellular senescence with senotherapeutics: senolytics and senomorphics.FEBS J. 2023 Mar;290(5):1362-1383. doi: 10.1111/febs.16350. Epub 2022 Feb 1. FEBS J. 2023. PMID: 35015337 Review.
-
Looking for the philosopher's stone: Emerging approaches to target the hallmarks of aging in the skin.J Eur Acad Dermatol Venereol. 2024 Jul;38 Suppl 4:5-14. doi: 10.1111/jdv.19820. J Eur Acad Dermatol Venereol. 2024. PMID: 38881451 Review.
Cited by
-
Senescence-associated secretory phenotype (SASP) and uterine fibroids: Association with PD-L1 activation and collagen deposition.Ageing Res Rev. 2024 Jun;97:102314. doi: 10.1016/j.arr.2024.102314. Epub 2024 Apr 24. Ageing Res Rev. 2024. PMID: 38670462 Free PMC article. Review.
-
When therapy-induced senescence meets tumors: A double-edged sword: A review.Medicine (Baltimore). 2025 Jun 13;104(24):e42886. doi: 10.1097/MD.0000000000042886. Medicine (Baltimore). 2025. PMID: 40527771 Free PMC article. Review.
-
Mechanisms of natural killer cell-mediated clearance of senescent renal tubular epithelial cells.Front Cell Dev Biol. 2025 Jun 30;13:1597230. doi: 10.3389/fcell.2025.1597230. eCollection 2025. Front Cell Dev Biol. 2025. PMID: 40661147 Free PMC article.
-
Therapy-induced senescence in breast cancer: an overview.Explor Target Antitumor Ther. 2024;5(4):902-920. doi: 10.37349/etat.2024.00254. Epub 2024 Jul 25. Explor Target Antitumor Ther. 2024. PMID: 39280248 Free PMC article. Review.
-
SenMayo transcriptomic senescence panel highlights glial cells in the ageing mouse and human retina.NPJ Aging. 2024 Nov 30;10(1):60. doi: 10.1038/s41514-024-00187-9. NPJ Aging. 2024. PMID: 39616175 Free PMC article.
References
-
- Alessio N, Acar MB, Squillaro T, Aprile D, Ayaz‐Güner S, Di Bernardo G, Peluso G, Özcan S, Galderisi U. Progression of irradiated mesenchymal stromal cells from early to late senescence: Changes in SASP composition and anti‐tumour properties. Abstract Cell Prolif. 2023;56(6). 10.1111/cpr.v56.6. 10.1111/cpr.13401. - PMC - PubMed
Publication types
MeSH terms
Substances
LinkOut - more resources
Full Text Sources
Medical
