. 2023 Sep 29;42(1):253.
doi: 10.1186/s13046-023-02815-w.

Oxamate enhances the efficacy of CAR-T therapy against glioblastoma via suppressing ectonucleotidases and CCR8 lactylation

Affiliations

Oxamate enhances the efficacy of CAR-T therapy against glioblastoma via suppressing ectonucleotidases and CCR8 lactylation

Ting Sun et al. J Exp Clin Cancer Res. .

Abstract

Background: Chimeric antigen receptor (CAR)-T immunotherapy fails to treat solid tumors due in part to immunosuppressive microenvironment. Excess lactate produced by tumor glycolysis increases CAR-T immunosuppression. The mechanism of lactate inducing the formation of immunosuppressive microenvironment remains to be further explored.

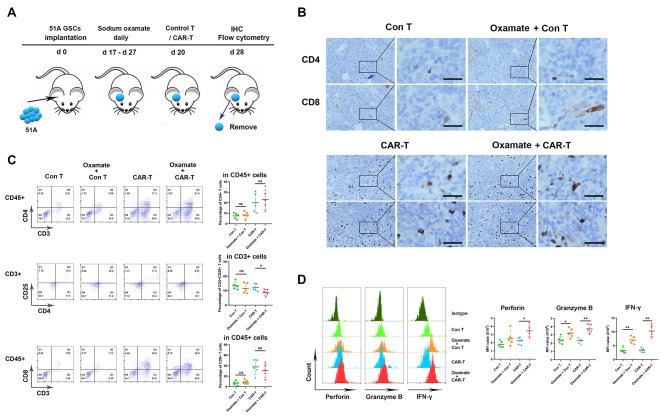
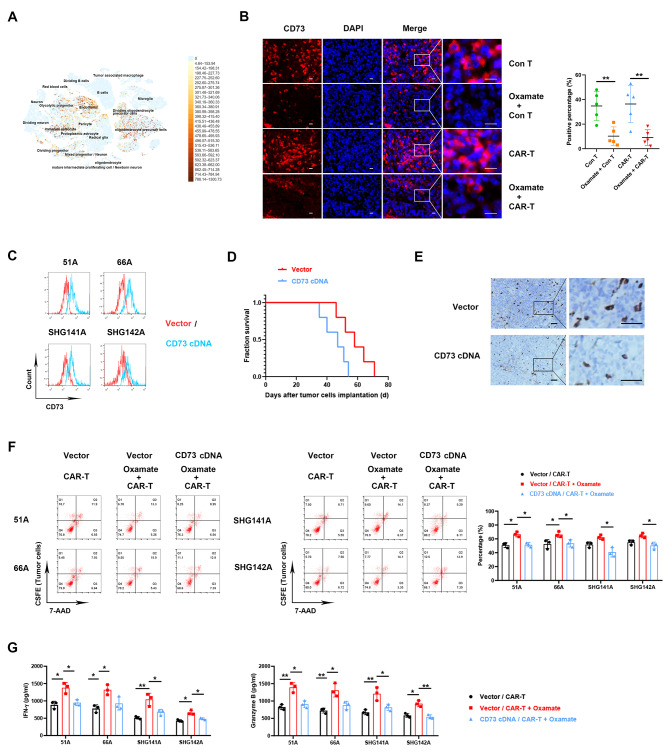
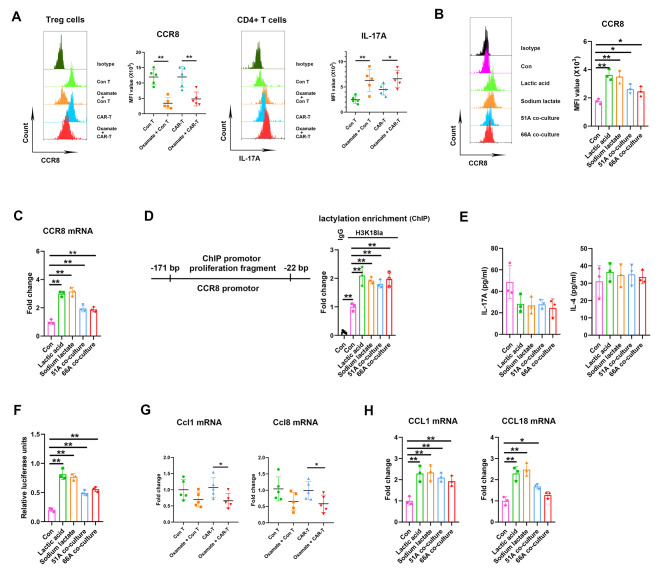
Methods: Immunocyte subpopulations and molecular characteristics were analyzed in the orthotopic xenografts of nude mice using flow cytometry assay and immunohistochemical staining after oxamate, a lactate dehydrogenase A (LDHA) inhibitor, and control T or CAR-T cells injection alone or in combination. RT-qPCR, western blot, flow cytometry, immunofluorescence, luciferase reporter assay, chromatin immunoprecipitation and ELISA were performed to measure the effect of lactate on the regulation of CD39, CD73 and CCR8 in cultured glioma stem cells, CD4 + T cells or macrophages.

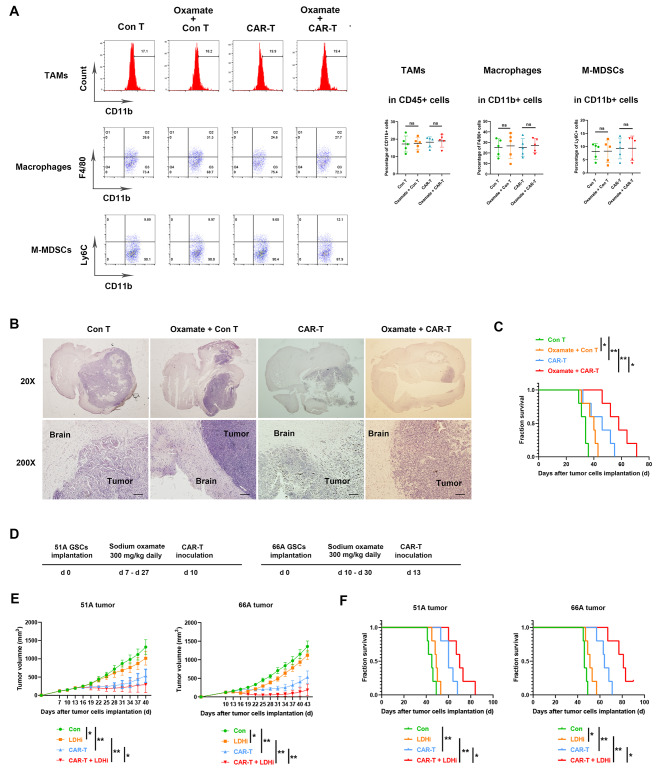
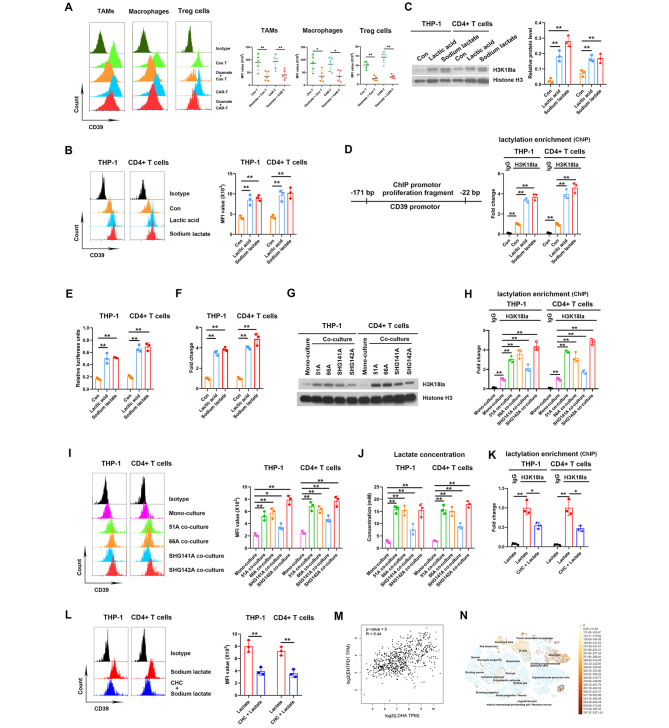
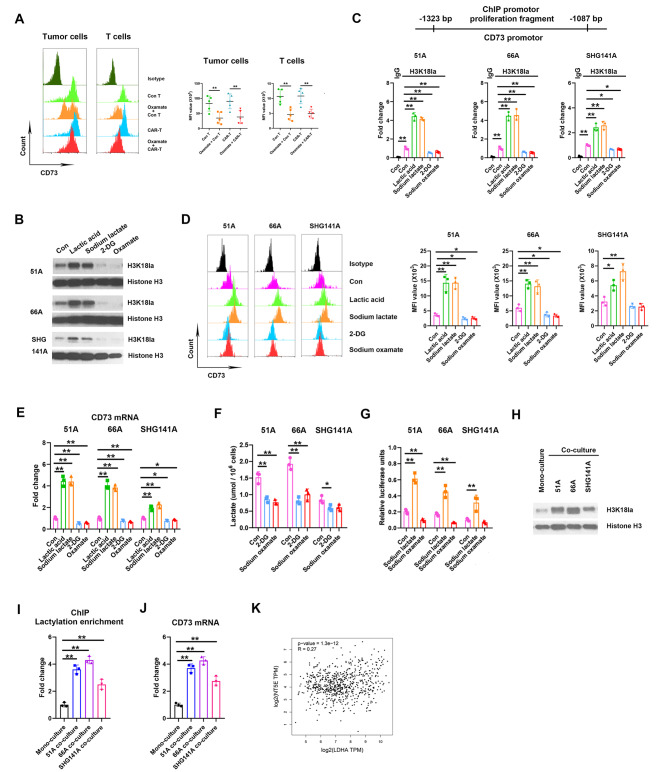
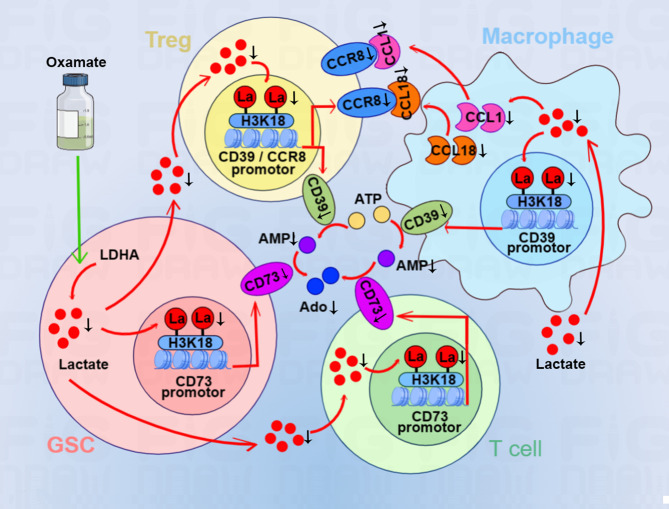
Results: Oxamate promoted immune activation of tumor-infiltrating CAR-T cells through altering the phenotypes of immune molecules and increasing regulatory T (Treg) cells infiltration in a glioblastoma mouse model. Lactate accumulation within cells upregulated CD39, CD73 and CCR8 expressions in both lactate-treated cells and glioma stem cells-co-cultured CD4 + T cells and macrophages, and intracellular lactate directly elevated the activities of these gene promotors through histone H3K18 lactylation.

Conclusions: Utilizing lactate generation inhibitor not only reprogramed glucose metabolism of cancer stem cells, but also alleviated immunosuppression of tumor microenvironment and reduced tumor-infiltrating CAR-Treg cells, which may be a potential strategy to enhance CAR-T function in glioblastoma therapy.

Keywords: CAR-T; CCR8; Ectonucleotidases; Glioblastoma; Histone lactylation.


Conflict of interest statement

No potential conflicts of interest were evident or relevant in the context of this article, and thus there was nothing to disclose.

Figures

Fig. 1
Fig. 1
Oxamate enhanced the function of TILs in both control T and CAR-T cells inoculation. 51 A GSCs were orthotopically inoculated into nude mice to establish glioma model. The tumor bearing mice were injected with sodium oxamate with or without control T or CAR-T cells. Tumors were removed from the mice at day 28, then prepared into sections for IHC staining or single cell suspensions for flow cytometry assay. (A) Timeline of tumor-bearing mouse models with treatment schedule. (B) Representative images of formalin-fixed paraffin embedded sections from xenografts stained using anti-CD4 and CD8 antibodies (×200). Scale bar represents 50 μm. (C) All lymphocytes were gated as CD45 + CD3 + cells. The percentages of CD4 + and CD8 + T cells within the CD45 + cells and CD4 + CD25 + T cells within the CD4 + cells. (D) The median fluorescence intensity (MFI) of perforin, granzyme B, and IFN-γ in CD8 + T cells. N = 5, *P < 0.05, **P < 0.01
Fig. 2
Fig. 2
Oxamate unchanged myeloid subpopulation in tumor tissue while reduced tumor growth. (A-C) 51 A GSCs were orthotopically inoculated into nude mice and tumors were removed from the mice at day 28. (A) Tumors were dissociated into single cells for flow cytometry assay. The classification of myeloid subpopulations was gated in CD45 + CD11b + cells. The percentages of TAMs (CD11b+), macrophages (CD11b + F4/80+), and M-MDSCs (CD11b + Ly6C+) within CD45 + cells in tumor tissues were analyzed. (B) Paraffin sections from the whole brain were stained with H&E and representative images showed tumor location and size. Scale bar represents 100 μm. (C) Survival of tumor-bearing nude mice. (D-F) Nude mice with subcutaneous tumor were injected with saline, sodium oxamate, CAR-T or sodium oxamate plus CAR-T combination. (D) Timeline of tumor-bearing mice with treatment schedules. (E) Subcutaneous tumor size in different time points after GSCs implantation. (F) Kaplan–Meier curves showing mice survival. N = 5, *P < 0.05, **P < 0.01
Fig. 3
Fig. 3
Lactate in the TME increased CD39 level by inducing H3K18la on gene promoter. (A) CD39 levels in TAMs, macrophages and Treg cells within tumor tissues from 51 A GSCs implanted nude mice. The gating strategies of TAMs and macrophages in Fig. 2A and Treg cells in Fig. 1C were showed. N = 5. (B-F) Macrophages from differentiated THP-1 cells and CD4 + T lymphocytes isolated from PBMCs were treated with PBS, 10 mM lactic acid or sodium lactate for 24 h. (B) CD39 protein level was detected using flow cytometry. (C) Histone H3K18la level was detected using western blot. (D) ChIP assay was performed using anti-H3K18la antibody, and the enrichment of CD39 gene promotor was qualified by qPCR. (E) Lymphocytes were transfected with pGL3 plasmid carrying CD39 promotor sequence, luciferase units were detected after lactic acid or sodium lactate treatment. (F) CD39 mRNA expression was detected using RT-qPCR. (G-J) THP-1 and CD4 + T cells were mono-cultured or co-cultured with GSCs for 12 h, H3K18la levels (G), H3K18la enrichment on CD39 promoter region (H) and CD39 protein level (I) in THP-1 and T cells and lactate concentration in medium (J) were detected. (K, L) THP-1 and CD4 + T cells were treated with sodium lactate for 24 h in pretreatment with 3 mM CHC for 2 h or not, H3K18la enrichment on CD39 promoter region using ChIP assay (K) and CD39 protein level (L) were detected. (M) The correlation of LDHA and ENTPD1, coding CD39 protein, expressions in TCGA database. (N) CD39 expression in GBM patients using single-cell RNA-seq on the UCSC Cell Browser. *P < 0.05, **P < 0.01
Fig. 4
Fig. 4
Lactate increased CD73 expression by H3K18la in GSCs. (A) CD73 levels in tumor and T cells within the xenografts of nude mice. N = 5. GSCs were treated with PBS, 10 mM lactic acid, 10 mM sodium lactate, 2 mM 2-DG or 20 mM sodium oxamate for 24 h, H3K18 lactylation using western blot (B), H3K18la enrichment on CD73 promotor using ChIP (C), CD73 protein level using flow cytometry (D), CD73 mRNA expression using RT-qPCR (E), and intracellular lactate production using colorimetric assay (F) were measured. (G) GSCs were transfected with pGL3-CD73 promotor plasmid for 24 h, then treated with PBS, sodium lactate or sodium oxamate, the luciferase activities were measured by dual-luciferase reporter system. T cells were mono-cultured or co-cultured with GSCs for 12 h, H3K18la levels (H), CD73 mRNA expression (I) and H3K18la enrichment on CD73 promoter region (J) in T cells were detected. (K) The correlation of LDHA and NT5E, editing CD73 protein, expressions in TCGA database. *P < 0.05, **P < 0.01
Fig. 5
Fig. 5
The effect of oxamate plus CAR-T was suppressed by CD73 overexpression in GSCs. (A) CD73 expression in GBM patients using single-cell RNA-seq. (B) CD73 expression by IF detection in the xenografts of nude mice. Scale bar represents 20 μm. (C) CD73 expression in GSCs was measured after vector or CD73 cDNA transfection. (D, E) 51 A GSCs transfected with vector or CD73 cDNA were orthotopically inoculated into nude mice to establish glioma model, then sodium oxamate and CAR-T were injected for antitumor therapy. N = 5. (D) Survival of nude mice was recorded. (E) Tumor infiltrating CD8 + T cells was stained 28 days after GSCs implantation. Scale bar represents 50 μm. (F) GSCs were prelabeled by CFSE, then co-cultured with CD8 + T cells at effector/target ratio of 5 : 1 for 16 h with or without 10 mM sodium oxamate. Dead cells were stained with 7-AAD and detected by flow cytometry. Double positive cells were dead tumor cells. (G) The concentration of IFN-γ and granzyme B were measured in co-cultured medium. *P < 0.05, **P < 0.01
Fig. 6
Fig. 6
Lactate upregulated CCR8 level and led to Th17/Treg imbalance. (A) The levels of CCR8 in CD4 + CD25 + Treg cells and IL-17 A in CD4 + T cells within intracranial implanted tumor. CD4 + T cells isolated from human PBMCs were treated with lactic acid, sodium lactate, or co-cultured with 51 or 66 A GSCs, the expressions of CCR8 protein in CD4 + T cells (B), CCR8 mRNA expressions (C), H3K18la enrichment on CCR8 promotor (D), and the levels of IL-17 A and IL-4 in the supernatants (E) were measured. (F) CD4 + T cells were transfected with pGL3-CCR8 promotor plasmid for 24 h, then treated with PBS, lactic acid, sodium lactate or co-cultured with 51 or 66 A GSCs, the luciferase activities were measured by dual-luciferase reporter system. (G) The expressions of Ccl1 and Ccl8 mRNA in implanted tumor. (H) The expressions of CCL1 and CCL18 mRNA in THP-1 cells in vitro. *P < 0.05, **P < 0.01
Fig. 7
Fig. 7
The mechanism of reduced intracellular lactate induced by oxamate leading to H3K18 lactylation on CD39, CD73 and CCR8 gene promotors. Oxamate inhibits lactate production and release into TME. Reduced lactate in GSCs and T cells suppresses histone H3K18 lactylation, leading to the decrease of CD73 gene promotor activity. Low level of H3K18 lactylation restrains the activity of CD39 gene promotor in Treg cells and macrophages. The conversion of ATP to AMP then to adenosine is inhibited by reduced levels of CD39 and CD73, respectively. Reduced CCR8 level due to low H3K18 lactylation blocks the binding to its ligands CCL1 and CCL18 secreted by macrophages. Oxamate changes the immunosuppressive microenvironment of GBM and improves the effect of CAR-T therapy

Similar articles

Cited by

References

    1. Horbinski C, Berger T, Packer RJ, Wen PY. Clinical implications of the 2021 edition of the WHO classification of central nervous system tumours. Nat Rev Neurol. 2022;18:515–29. doi: 10.1038/s41582-022-00679-w. - DOI - PubMed
    1. Kondo T. Glioblastoma-initiating cell heterogeneity generated by the cell-of-origin, genetic/epigenetic mutation and microenvironment. Semin Cancer Biol. 2022;82:176–83. doi: 10.1016/j.semcancer.2020.12.003. - DOI - PubMed
    1. Khan F, Pang L, Dunterman M, Lesniak MS, Heimberger AB, Chen P. Macrophages and microglia in glioblastoma: heterogeneity, plasticity, and therapy. J Clin Invest 2023; 133. - PMC - PubMed
    1. Cappell KM, Kochenderfer JN. Long-term outcomes following CAR T cell therapy: what we know so far. Nat Rev Clin Oncol 2023: 1–13. - PMC - PubMed
    1. Majzner RG, Ramakrishna S, Yeom KW, Patel S, Chinnasamy H, Schultz LM, et al. GD2-CAR T cell therapy for H3K27M-mutated diffuse midline gliomas. Nature. 2022;603:934–41. doi: 10.1038/s41586-022-04489-4. - DOI - PMC - PubMed