

Cystine/glutamate antiporter xCT deficiency reduces metastasis without impairing immune system function in breast cancer mouse models
- PMID: 37770957
- PMCID: PMC10540318
- DOI: 10.1186/s13046-023-02830-x
Cystine/glutamate antiporter xCT deficiency reduces metastasis without impairing immune system function in breast cancer mouse models
Abstract
Background: The upregulation of antioxidant mechanisms is a common occurrence in cancer cells, as they strive to maintain balanced redox state and prevent oxidative damage. This includes the upregulation of the cystine/glutamate antiporter xCT, which plays a crucial role in protecting cancer cells from oxidative stress. Consequently, targeting xCT has become an attractive strategy for cancer treatment. However, xCT is also expressed by several types of immune cells where it has a role in proliferation and effector functions. In light of these observations, a comprehensive understanding of the specific role of xCT in the initiation and progression of cancer, as well as its potential impact on the immune system within the tumor microenvironment and the anti-tumor response, require further investigation.
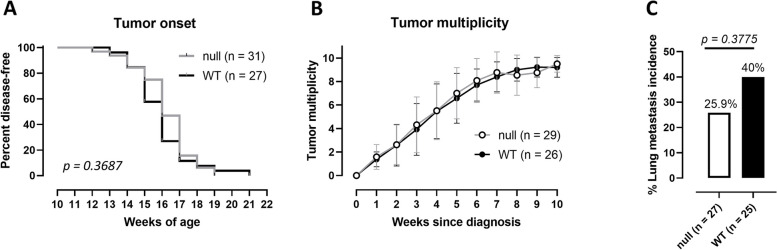
Methods: We generated xCTnull BALB/c mice to investigate the role of xCT in the immune system and xCTnull/Erbb2-transgenic BALB-neuT mice to study the role of xCT in a mammary cancer-prone model. We also used mammary cancer cells derived from BALB-neuT/xCTnull mice and xCTKO 4T1 cells to test the contribution of xCT to malignant properties in vitro and in vivo.
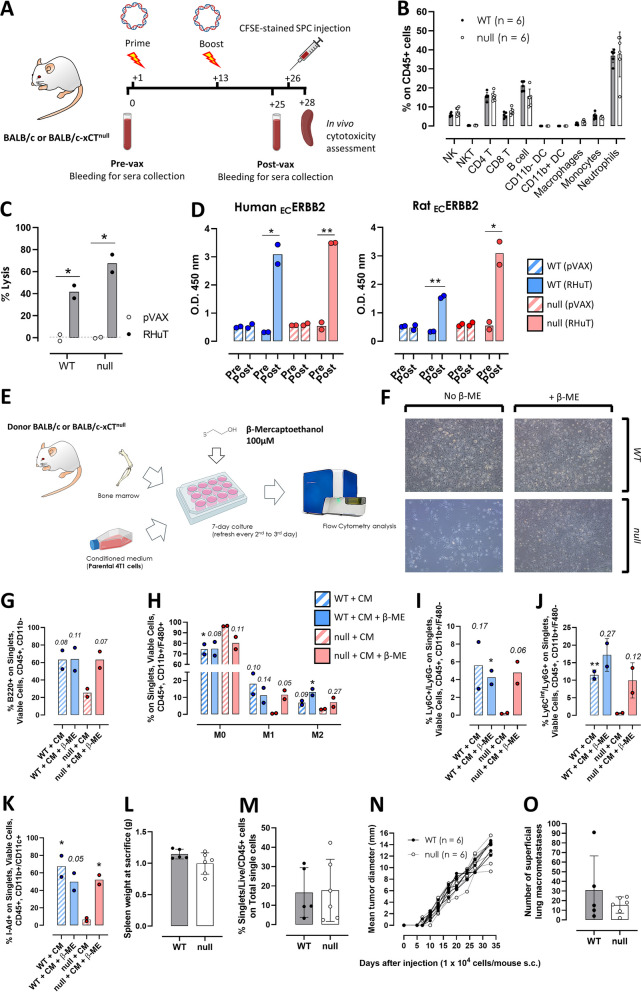
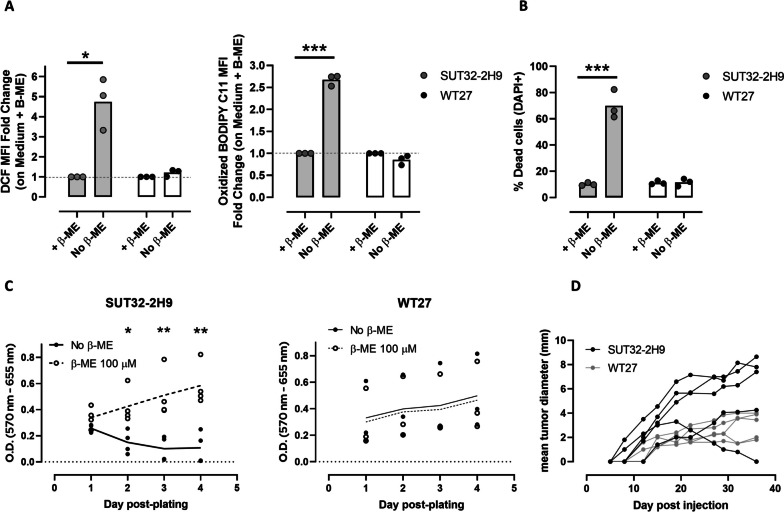
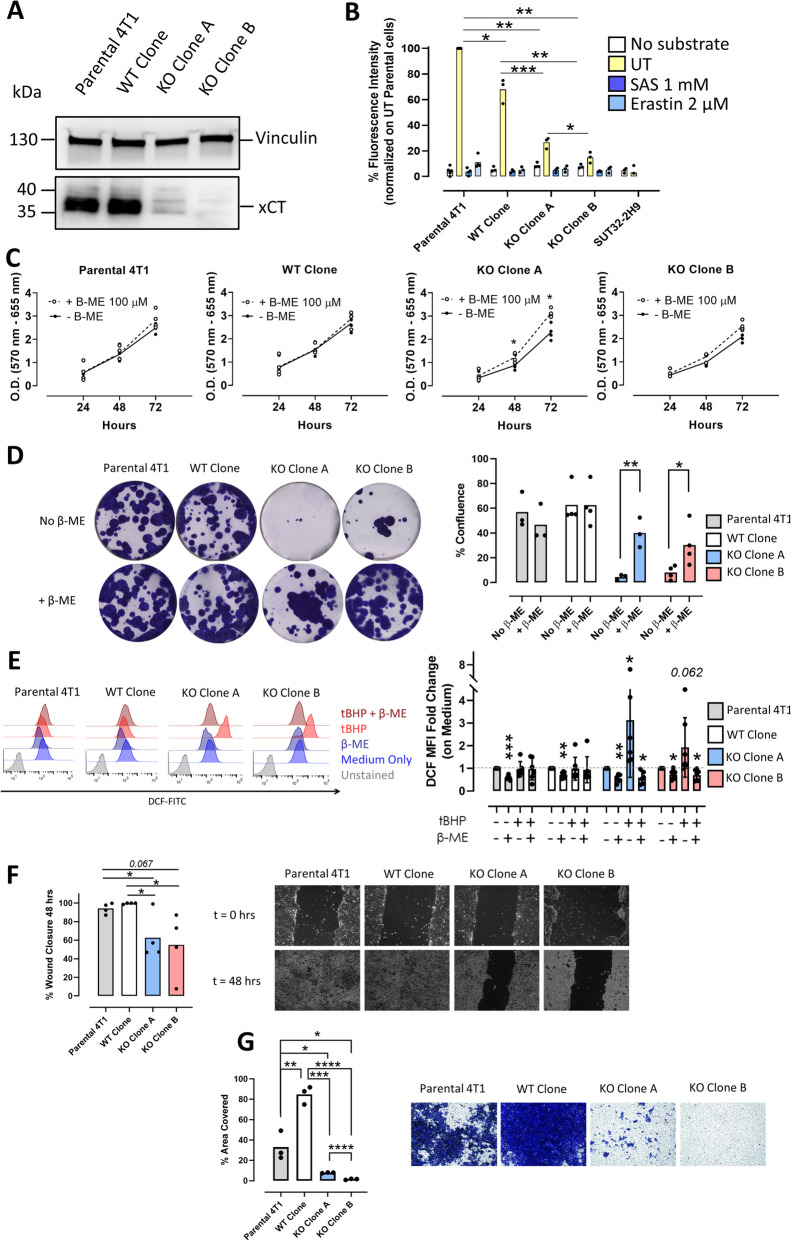
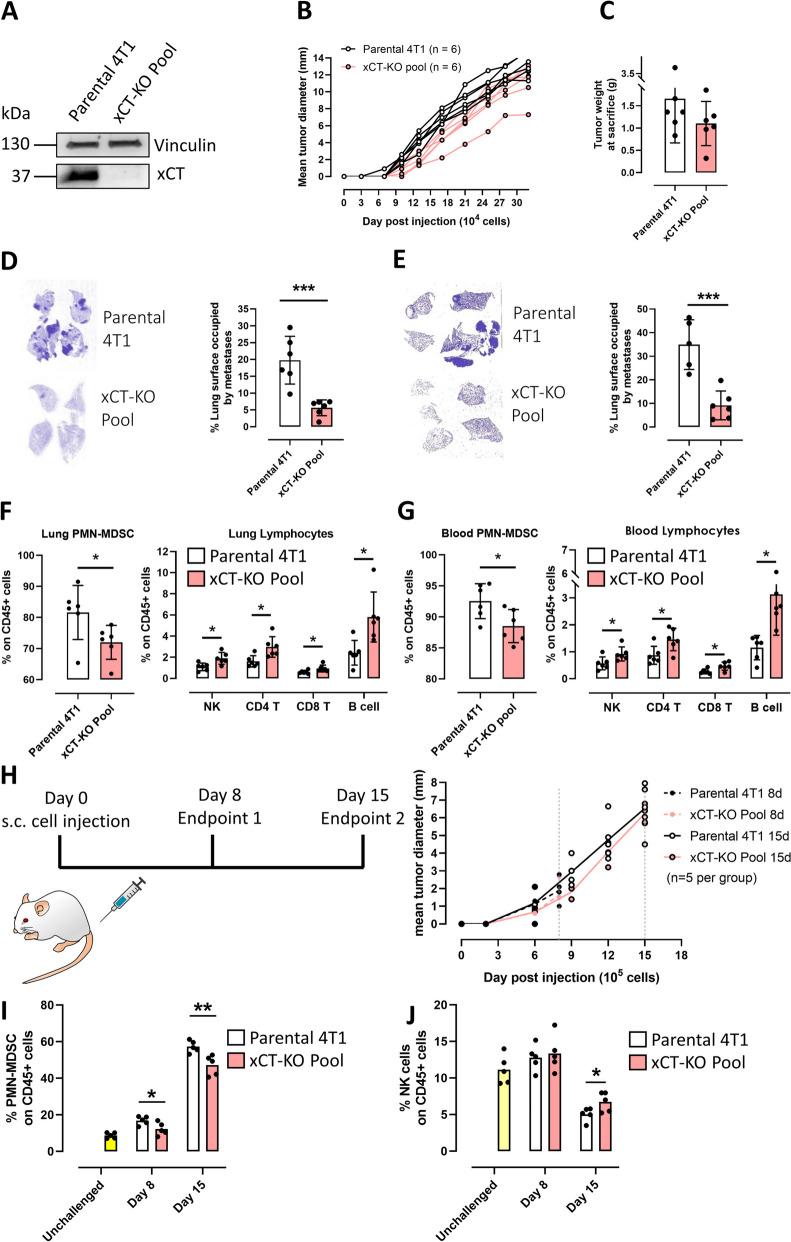
Results: xCT depletion in BALB-neuT/xCTnull mice does not alter autochthonous tumor initiation, but tumor cells isolated from these mice display proliferation and redox balance defects in vitro. Although xCT disruption sensitizes 4T1 cells to oxidative stress, it does not prevent transplantable tumor growth, but reduces cell migration in vitro and lung metastasis in vivo. This is accompanied by an altered immune cell recruitment in the pre-metastatic niche. Finally, systemic depletion of xCT in host mice does not affect transplantable tumor growth and metastasis nor impair the proper mounting of both humoral and cellular immune responses in vivo.
Conclusions: xCT is dispensable for proper immune system function, thus supporting the safety of xCT targeting in oncology. Nevertheless, xCT is involved in several processes required for the metastatic seeding of mammary cancer cells, thus broadening the scope of xCT-targeting approaches.
Keywords: Breast cancer; Immune system; Metastasis; Metastatic niche; SLC7A11; xCT.
© 2023. Italian National Cancer Institute ‘Regina Elena’.
Conflict of interest statement
The authors declare that they have no competing interests.
Figures
Similar articles
-
Immunotargeting of the xCT Cystine/Glutamate Antiporter Potentiates the Efficacy of HER2-Targeted Immunotherapies in Breast Cancer.Cancer Immunol Res. 2020 Aug;8(8):1039-1053. doi: 10.1158/2326-6066.CIR-20-0082. Epub 2020 Jun 12. Cancer Immunol Res. 2020. PMID: 32532810
-
Cystine-glutamate antiporter xCT deficiency suppresses tumor growth while preserving antitumor immunity.Proc Natl Acad Sci U S A. 2019 May 7;116(19):9533-9542. doi: 10.1073/pnas.1814932116. Epub 2019 Apr 24. Proc Natl Acad Sci U S A. 2019. PMID: 31019077 Free PMC article.
-
The glutamate/cystine xCT antiporter antagonizes glutamine metabolism and reduces nutrient flexibility.Nat Commun. 2017 Apr 21;8:15074. doi: 10.1038/ncomms15074. Nat Commun. 2017. PMID: 28429737 Free PMC article.
-
Identification, Expression, and Roles of the Cystine/Glutamate Antiporter in Ocular Tissues.Oxid Med Cell Longev. 2020 Jun 18;2020:4594606. doi: 10.1155/2020/4594606. eCollection 2020. Oxid Med Cell Longev. 2020. PMID: 32655769 Free PMC article. Review.
-
Glial Glutamate Transporter-Mediated Plasticity: System xc-/xCT/SLC7A11 and EAAT1/2 in Brain Diseases.Front Biosci (Landmark Ed). 2023 Mar 20;28(3):57. doi: 10.31083/j.fbl2803057. Front Biosci (Landmark Ed). 2023. PMID: 37005761 Review.
Cited by
-
Cystine/cysteine metabolism regulates the progression and response to treatment of triple‑negative breast cancer (Review).Oncol Lett. 2024 Aug 30;28(5):521. doi: 10.3892/ol.2024.14654. eCollection 2024 Nov. Oncol Lett. 2024. PMID: 39268159 Free PMC article. Review.
-
Targeting metabolism of breast cancer and its implications in T cell immunotherapy.Front Immunol. 2024 Apr 12;15:1381970. doi: 10.3389/fimmu.2024.1381970. eCollection 2024. Front Immunol. 2024. PMID: 38680483 Free PMC article. Review.
-
CircTTC13 promotes sorafenib resistance in hepatocellular carcinoma through the inhibition of ferroptosis by targeting the miR-513a-5p/SLC7A11 axis.Mol Cancer. 2025 Jan 27;24(1):32. doi: 10.1186/s12943-024-02224-3. Mol Cancer. 2025. PMID: 39871338 Free PMC article.
-
Bridging the Gap in Breast Cancer Dormancy: Models, Mechanisms, and Translational Challenges.Pharmaceuticals (Basel). 2025 Jun 26;18(7):961. doi: 10.3390/ph18070961. Pharmaceuticals (Basel). 2025. PMID: 40732251 Free PMC article. Review.
-
SLC7A11 promotes EMT and metastasis in invasive pituitary neuroendocrine tumors by activating the PI3K/AKT signaling pathway.Endocr Connect. 2024 Jun 3;13(7):e240097. doi: 10.1530/EC-24-0097. Print 2024 Jul 1. Endocr Connect. 2024. PMID: 38722255 Free PMC article.
References
-
- Trachootham D, Alexandre J, Huang P. Targeting cancer cells by ROS-mediated mechanisms: a radical therapeutic approach ? Nat Rev Drug Discov. 2009;8(7):579–591. - PubMed
-
- Gorrini C, Harris IS, Mak TW. Modulation of oxidative stress as an anticancer strategy. Nat Rev Drug Discov. 2013;12(12):931–947. - PubMed
MeSH terms
Substances
Grants and funding
- IG 2018 - ID. 21468/Fondazione AIRC per la ricerca sul cancro
- Fondazione AIRC per la ricerca sul cancro/Fondazione AIRC per la ricerca sul cancro
- Fondazione Ricerca Molinette/Fondazione Ricerca Molinette
- Università degli Studi di Torino/Università degli Studi di Torino
- Fondazione Umberto Veronesi/Fondazione Umberto Veronesi
LinkOut - more resources
Full Text Sources
Medical
Research Materials
Miscellaneous
