. 2023 Sep 28;21(1):265.
doi: 10.1186/s12964-023-01290-2.

Therapeutic targeting of the TPX2/TTK network in colorectal cancer

Affiliations

Therapeutic targeting of the TPX2/TTK network in colorectal cancer

Hibah Shaath et al. Cell Commun Signal. .

Abstract

Background: While the increased screening, changes in lifestyle, and recent advances in treatment regimen have decreased colorectal cancer (CRC) mortality, metastatic disease and recurrence remains a major clinical challenge. In the era of precision medicine, the identification of actionable novel therapeutic targets could ultimately offer an alternative treatment strategy for CRC.

Methods: RNA-Seq was conducted using the illumina platform, while bioinformatics analyses were conducted using CLC genomics workbench and iDEP.951. Colony forming unit, flow cytometry, and fluorescent microscopy were used to assess cell proliferation, cell cycle distribution, and cell death, respectively. The growth potential of CRC cells under 3-dimensional (3D) conditions was assessed using Matrigel. STRING database (v11.5) and Ingenuity Pathway Analysis (IPA) tool were used for network and pathway analyses. CRISPR-Cas9 perturbational effects database was used to identify potential therapeutic targets for CRC, through integration with gene-drug interaction database. Structural modeling and molecular docking were used to assess the interaction between candidate drugs and their targets.

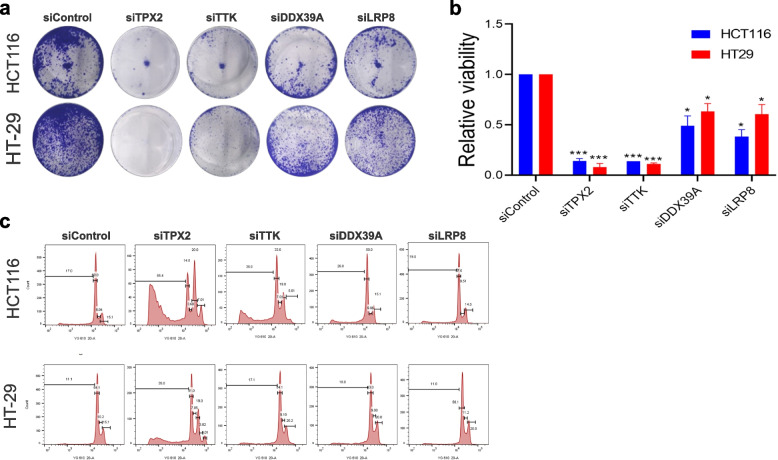
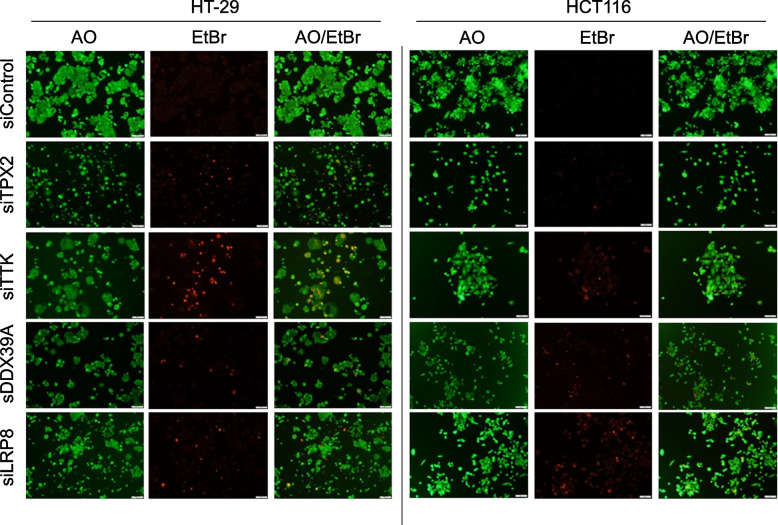
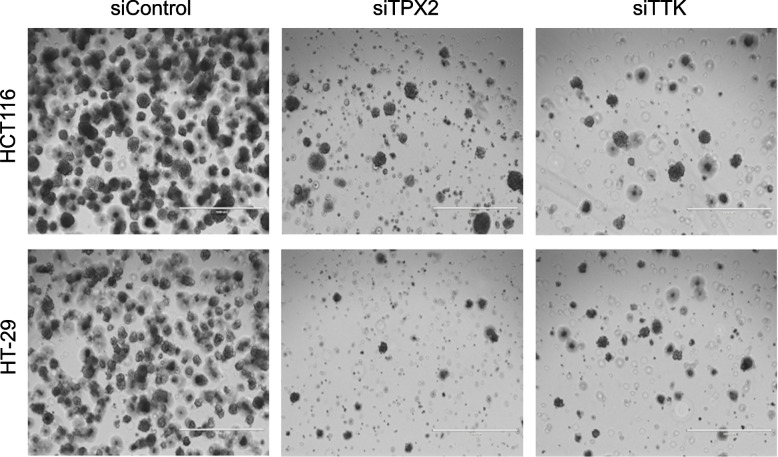
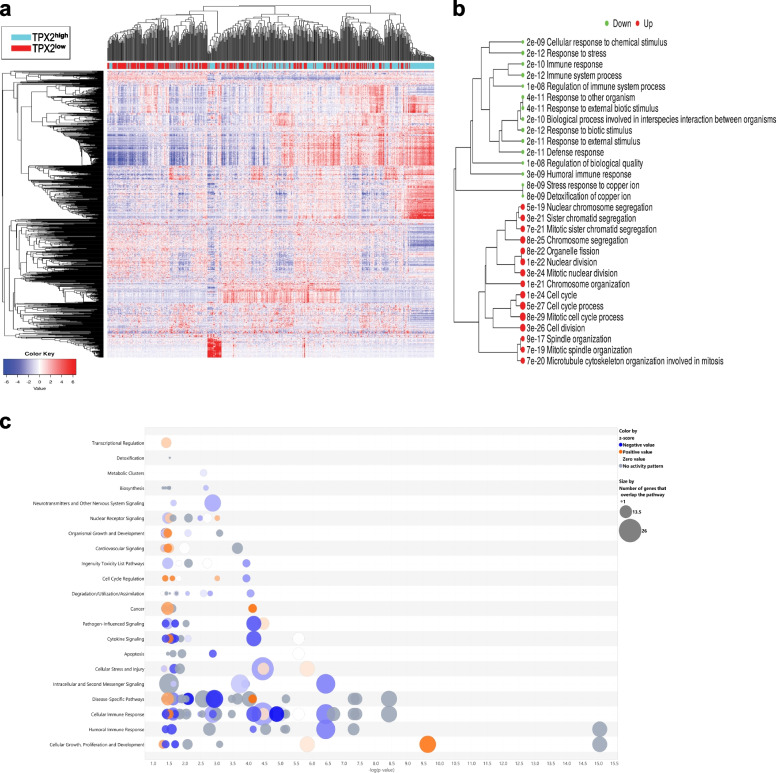
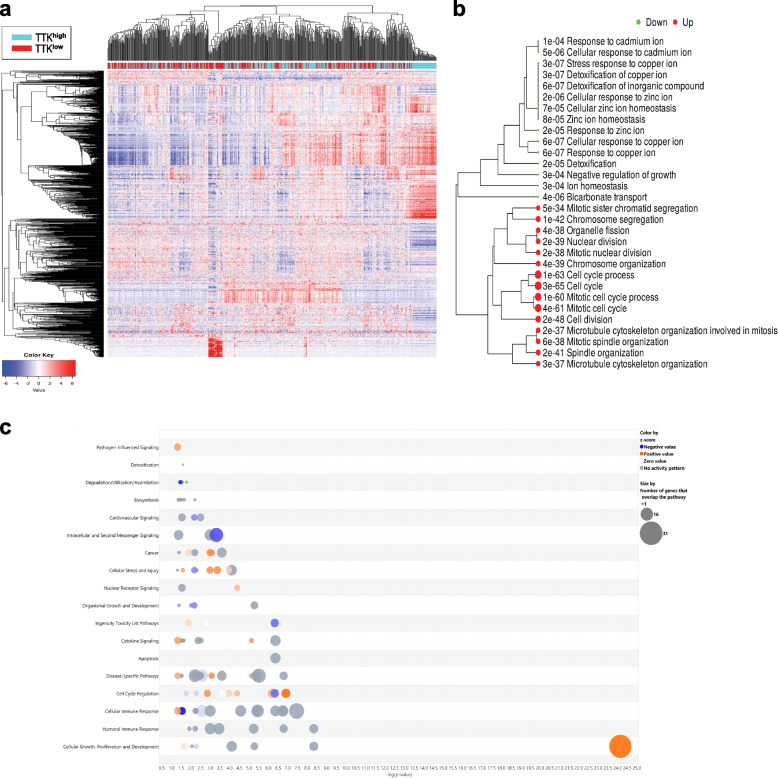
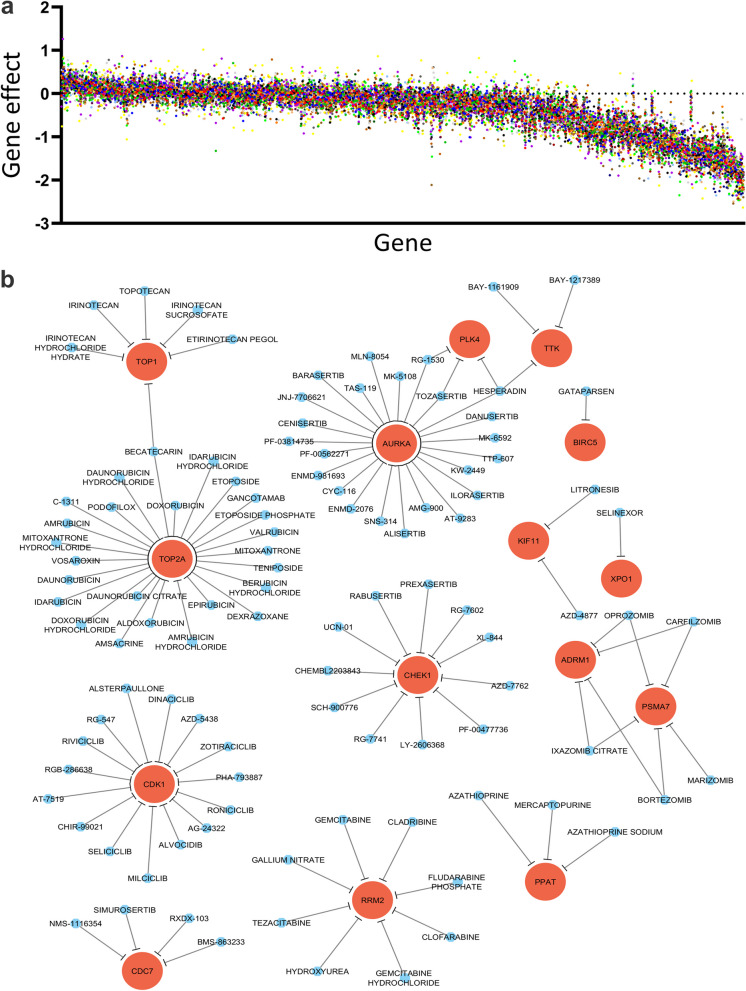
Results: In the current study, we investigated the therapeutic potential of targeting TPX2, TTK, DDX39A, and LRP8, commonly upregulated genes in CRC identified through differential expression analysis in CRC and adjacent non-cancerous tissue. Targeted depletion of TPX2 and TTK impaired CRC proliferation, cell cycle progression, and organoid formation under 3D culture conditions, while suppression of DDX39A and LRP8 had modest effects on CRC colony formation. Differential expression analysis and bioinformatics on TPX2 and TTK-deficient cells identified cell cycle regulation as the hallmark associated with loss of TPX2 and TTK. Elevated expression of TPX2 and TTK correlated with an oncogenic state in tumor tissue from patients with colon adenocarcinoma, thus corroborating an oncogenic role for the TPX2/TTK network in the pathogenesis of CRC. Gene set enrichment and pathway analysis of TPX2high/TTKhigh CRC identified numerous additional gene targets as integral components of the TPX2/TTK network. Integration of TPX2/TTK enriched network with CRISPR-Cas9 functional screen data identified numerous novel dependencies for CRC. Additionally, gene-drug interaction analysis identified several druggable gene targets enriched in the TPX2/TTK network, including AURKA, TOP2A, CDK1, BIRC5, and many others.

Conclusions: Our data has implicated an essential role for TPX2 and TTK in CRC pathogenesis and identified numerous potential therapeutic targets and their drug interactions, suggesting their potential clinical use as a novel therapeutic strategy for patients with CRC. Video Abstract.

Keywords: Colorectal cancer; DDX39A; Gene-drug-interaction; LRP8; Precision medicine; TPX2; TTK.


Conflict of interest statement

The authors declare no competing interests.

Figures

Fig. 1
Fig. 1
Expression of selected genes in CRC. a Elevated expression of TPX2, UBE2C, CDCA7, MELK, NFE2L3, TTK, DDX39A, and LRP8 in CRC compared to normal tissue (NT) from our local cohort. b Validation of the expression of the same gene panel in CRC compared NT from the PRJNA413956 CRC dataset (c) Oncoprint illustrating the expression of the eight selected genes in COAD from the TCGA dataset. Color legend indicated gene alterations
Fig. 2
Fig. 2
Targeted depletion of TPX2, TTK, DDX39A and LRP8 impairs CRC proliferation. a Representative CFU images of HCT116 and HT-29 cells on day 7 post-knockdown of the indicated genes. b Quantitative analysis of CFU formation in HCT116 and HT-29 from (a) under different treatment conditions. Data are presented as mean ± S.E.M., n = 4.. *p < 0.05, ***p < 0.0005. c Representative cell cycle analysis of HCT116 and HT-29 under the indicated treatment conditions
Fig. 3
Fig. 3
Dead-live staining of HT-29 and HCT116 CRC models in response to TPX2, TTK, DDX39A and LRP8 depletion. Representative fluorescence images for CRC cells post-siRNA-mediated knockdown of TPX2, TTK, DDX39A or LRP8. Cells were stained on day 4 with AO/EtBr to detect live (green) cells (first panel) and dead cells (red; necrotic) shown in the second panel. Third panel shows the merged images
Fig. 4
Fig. 4
Effects of TPX2 and TTK depletion on 3D organoid formation of CRC cells. Representative images of organoid formation by CRC cell models post-siRNA-mediated knockdown of TPX2 and TTK, compared to siRNA control treated cells. Cells were imaged on day 7 post transfection
Fig. 5
Fig. 5
Transcriptional alterations and affected gene ontology (GO) functional categories in TPX2 and TTK depleted CRC models. Transcriptional alterations in TPX2 and TTK depleted cells in HT-29 (a) and HCT116 (b) CRC cell models. The text on the left indicates the enriched functional categories (GO). c STRING PPI network analysis on the commonly downregulated genes in both HT-29 and HCT116 cells depleted of TPX2
Fig. 6
Fig. 6
Differential expression and gene set enrichment analysis in TPX2high COAD. a Heat map clustering of 512 COAD transcripts stratified into high vs low according to median TPX2 expression. b GO enrichment tree in the TPX2high vs TPX2low COAD. Enrichment p value is indicated for each functional category. c Bubble chart illustrating activated (orange) and suppressed (blue) canonical pathways in TPX2high vs TPX2low COAD employing IPA analysis. Size of the bubble corresponds to the number of genes that overlap the pathway. X-axis represents the -log p-value
Fig. 7
Fig. 7
Differential expression and gene set enrichment analysis in TTKhigh COAD. a Heat map clustering of 512 COAD transcripts stratified according to median TTK expression. b GO enrichment tree in the same cohort of COAD according to median TTK expression. Enrichment p value is indicated for each functional category. c Bubble chart illustrating activated (orange) and suppressed (blue) canonical pathways in TTKhigh vs TTKlow COAD employing IPA analysis. Size of the bubble corresponds to the number of genes that overlap the pathway. X-axis represents the -log p-value
Fig. 8
Fig. 8
CRC dependency map and their drug interactions in TPX2/TTK enriched networks. a Dot plot illustrating the essentiality of 498 identified genes from TPX2/TTK enriched networks, employing CRISPR-Cas9 functional screening data. X-axis represent the gene, y-axis resent the gene effect score, while each dot represents a single CRC cell model. b Network illustrating the interaction between the indicated genes and corresponding drugs retrieved from the drug-gene interaction database
Fig. 9
Fig. 9
Structural modeling and molecular docking of TTK interacting drugs. Docking pose of TTK protein in gold with the corresponding drugs in cyan (a) Bay-11, c Bay-12 and e HES. 2D plots of receptor-ligand interactions are shown with their amino acid positions represented as beads for (b) Bay-11, d Bay-12 and f HES. Hydrophobic amino acids (Ala, Met, Val, Leu, Ile, Phe) in green, other amino acids in pink while charged amino acids (Asp, Glu, Lys, Arg) are presented with dark rings

References

    1. Davis LE. The evolution of biomarkers to guide the treatment of metastatic colorectal cancer. Am J Manag Care. 2018;24:S107–S117. - PubMed
    1. Van Cutsem E, Lenz HJ, Kohne CH, Heinemann V, Tejpar S, Melezinek I, Beier F, Stroh C, Rougier P, van Krieken JH, Ciardiello F. Fluorouracil, leucovorin, and irinotecan plus cetuximab treatment and RAS mutations in colorectal cancer. J Clin Oncol. 2015;33:692–700. - PubMed
    1. Xie YH, Chen YX, Fang JY. Comprehensive review of targeted therapy for colorectal cancer. Signal Transduct Target Ther. 2020;5:22. - PMC - PubMed
    1. Vishnubalaji R, Hamam R, Abdulla MH, Mohammed MA, Kassem M, Al-Obeed O, Aldahmash A, Alajez NM. Genome-wide mRNA and miRNA expression profiling reveal multiple regulatory networks in colorectal cancer. Cell Death Dis. 2015;6:e1614. - PMC - PubMed
    1. Elsafadi M, Manikandan M, Almalki S, Mahmood A, Shinwari T, Vishnubalaji R, Mobarak M, Alfayez M, Aldahmash A, Kassem M, Alajez NM. Transgelin is a poor prognostic factor associated with advanced colorectal cancer (CRC) stage promoting tumor growth and migration in a TGFbeta-dependent manner. Cell Death Dis. 2020;11:341. - PMC - PubMed

Publication types

MeSH terms