. 2023 Jun;2(6):550-571.
doi: 10.1038/s44161-023-00278-y. Epub 2023 Jun 8.

Systems immunology-based drug repurposing framework to target inflammation in atherosclerosis

Affiliations

Systems immunology-based drug repurposing framework to target inflammation in atherosclerosis

Letizia Amadori et al. Nat Cardiovasc Res. 2023 Jun.

Erratum in

Abstract

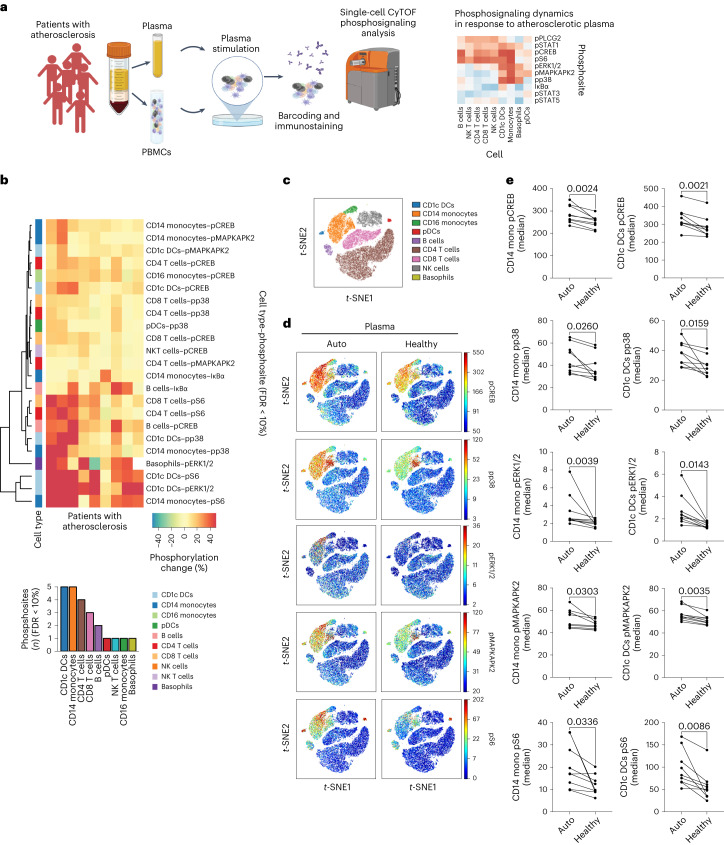
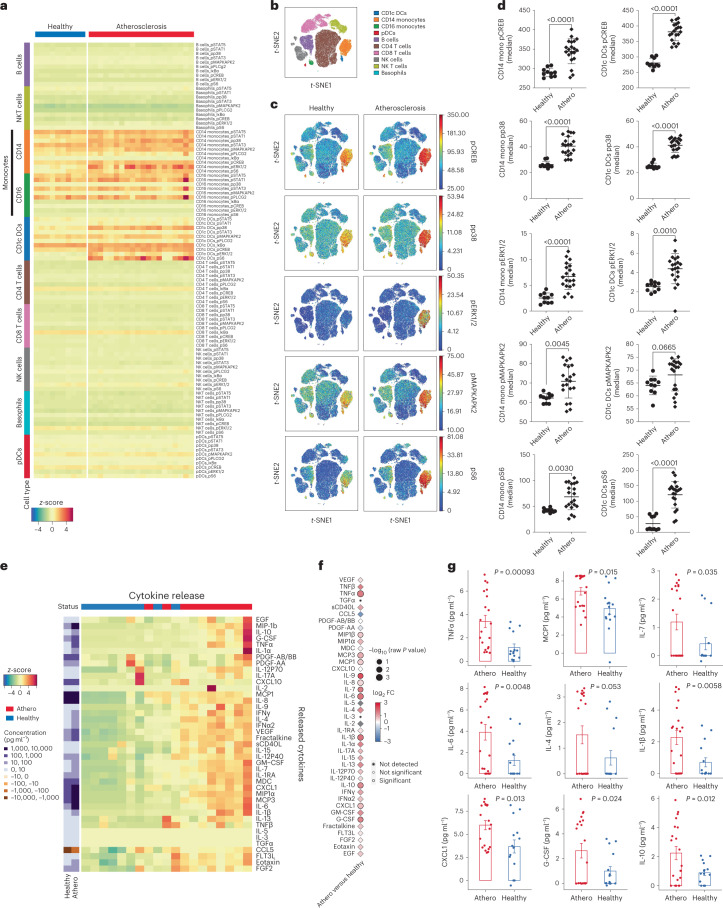
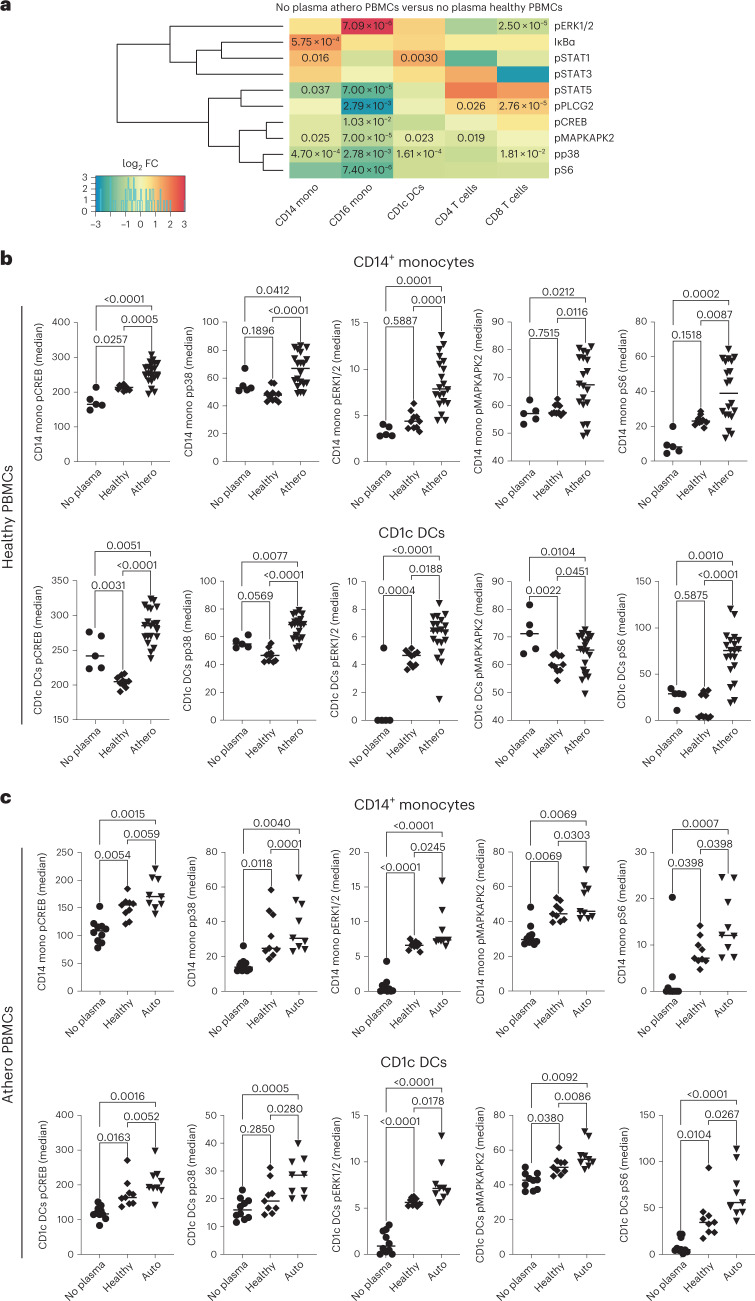
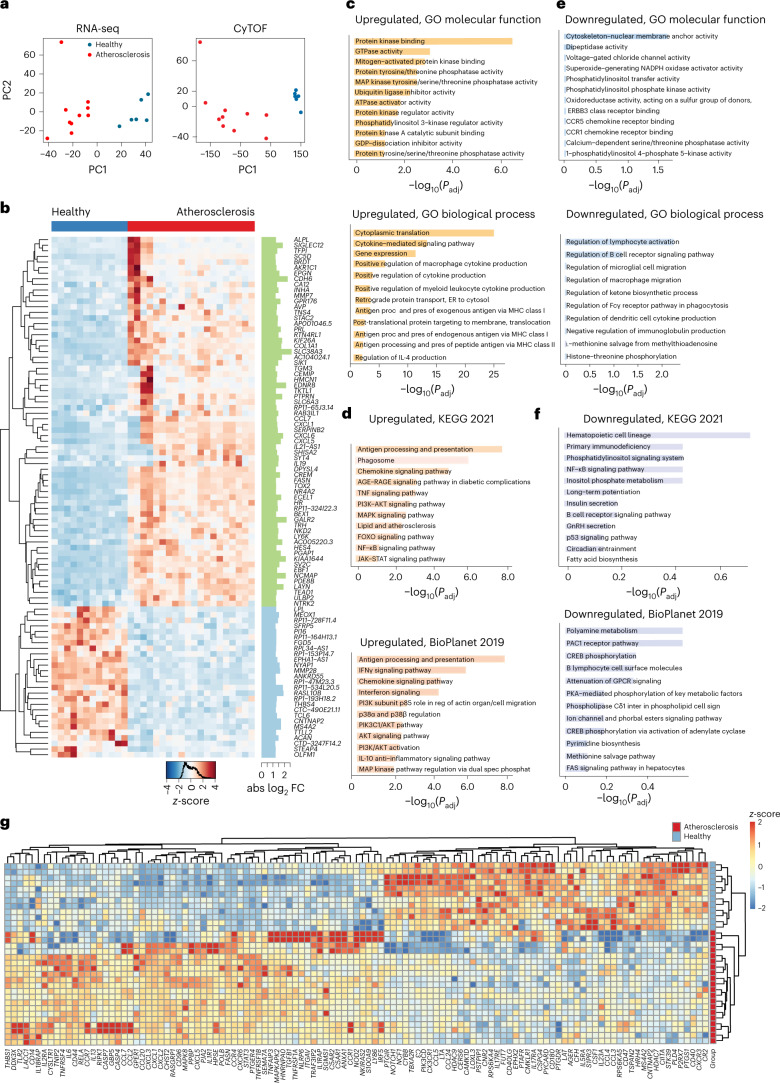
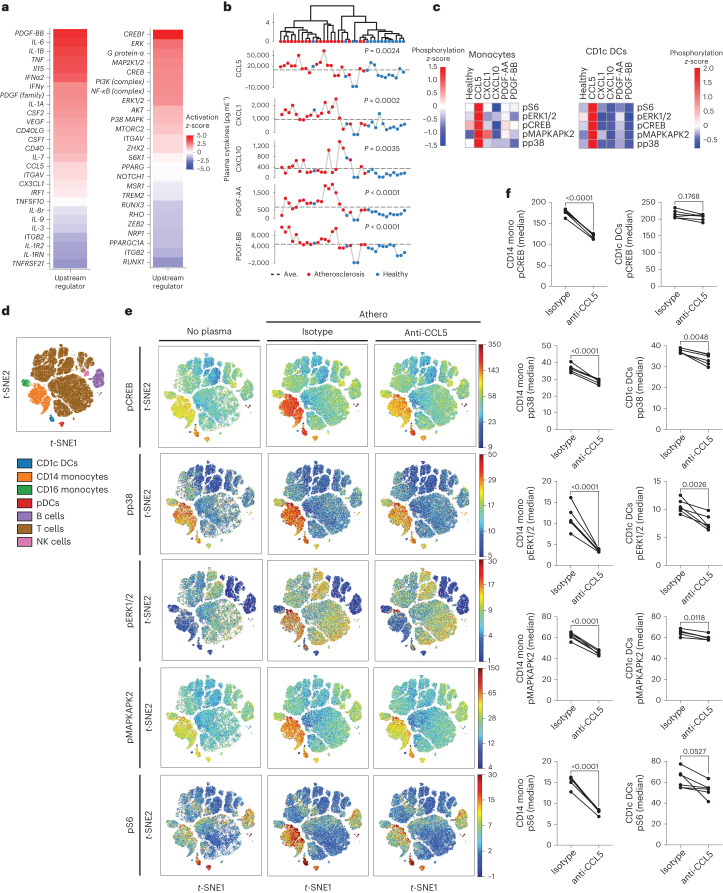
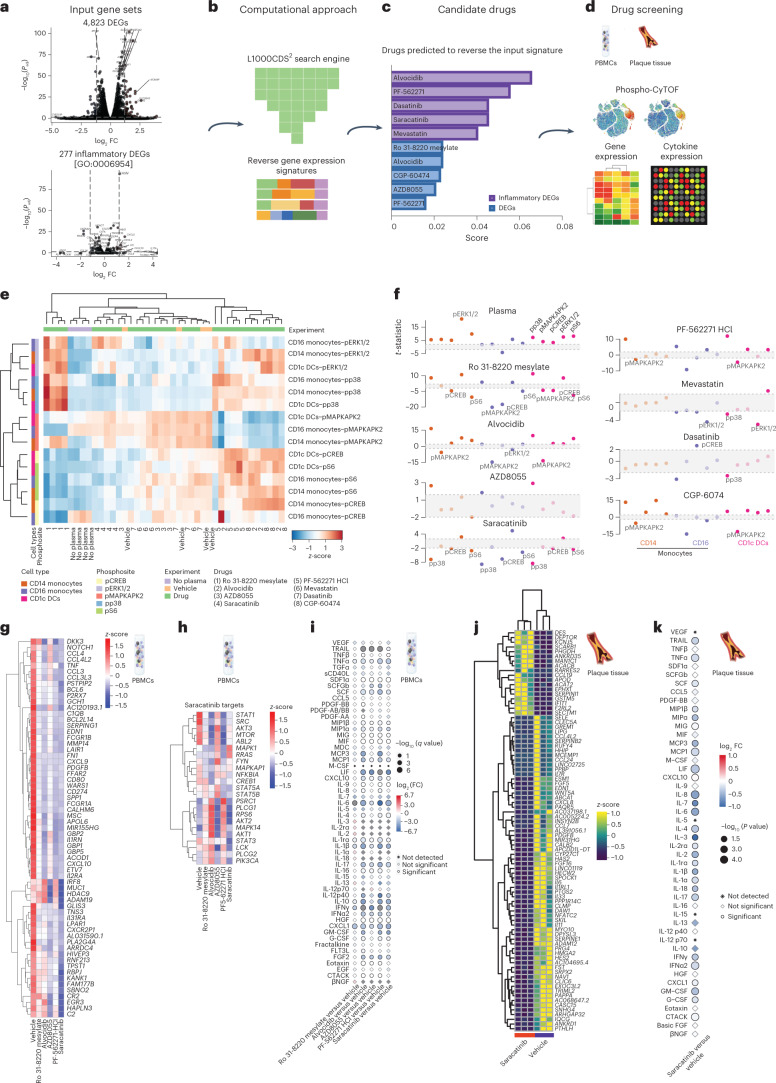
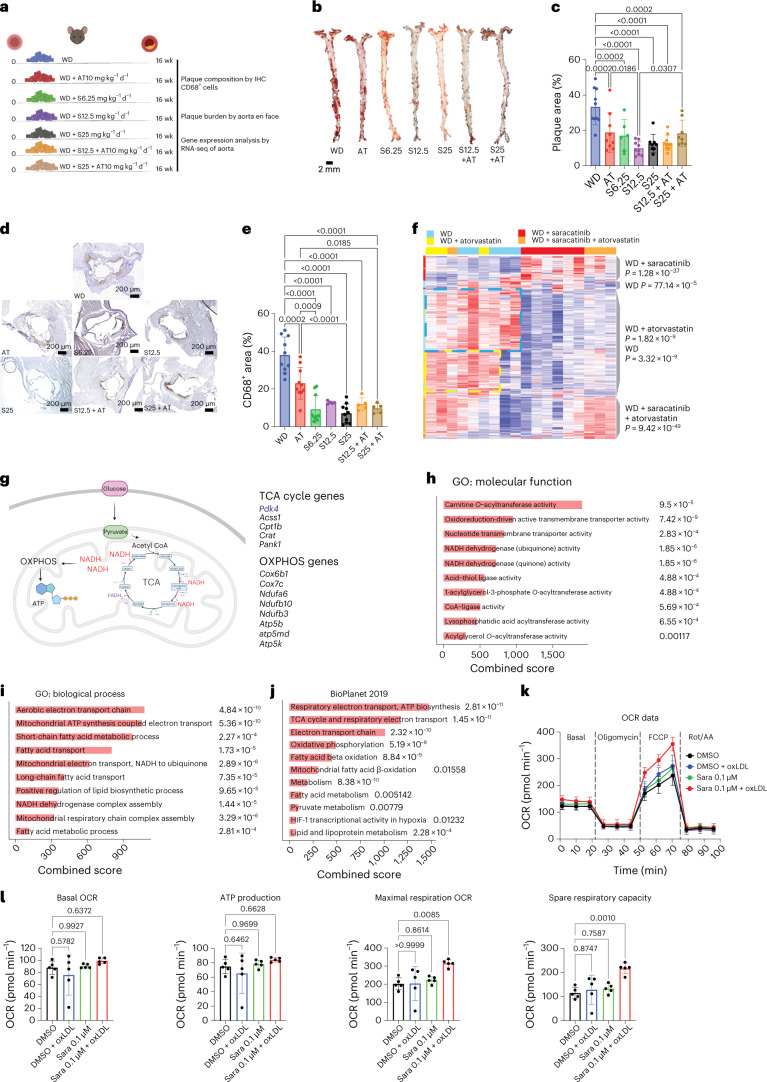
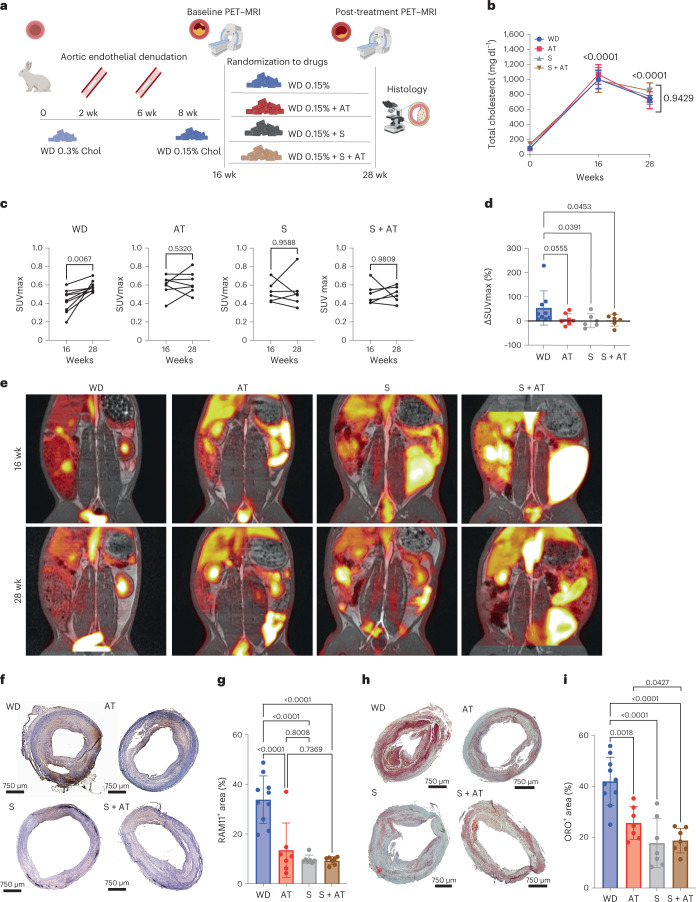
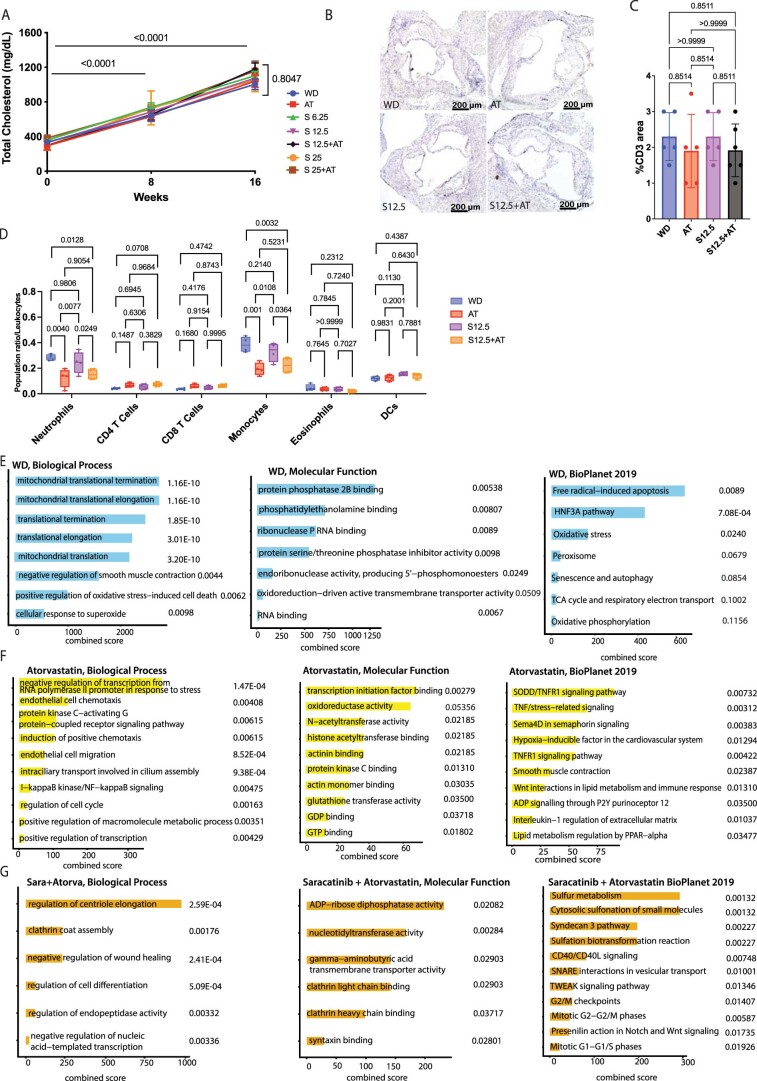
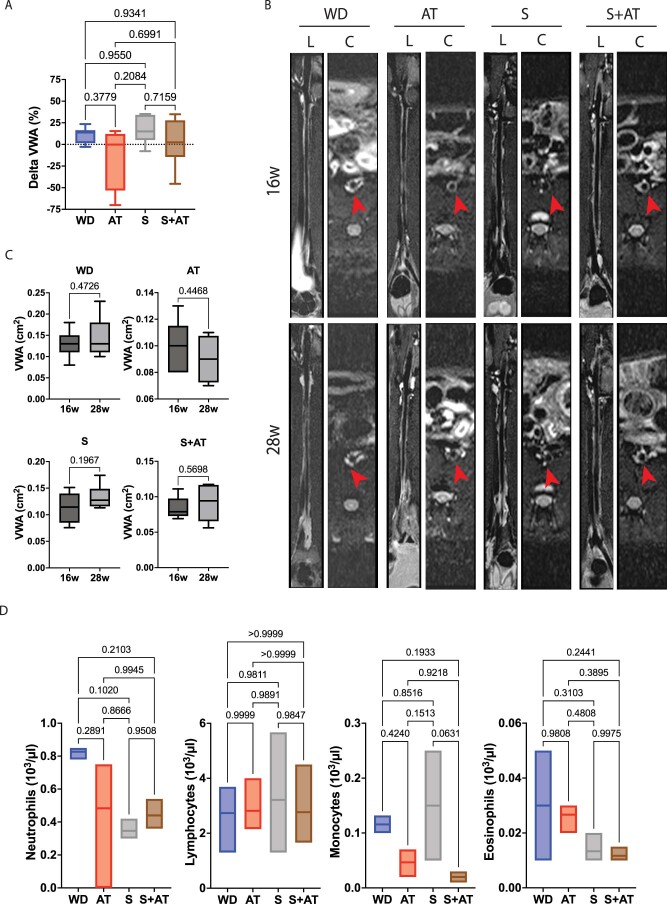
The development of new immunotherapies to treat the inflammatory mechanisms that sustain atherosclerotic cardiovascular disease (ASCVD) is urgently needed. Herein, we present a path to drug repurposing to identify immunotherapies for ASCVD. The integration of time-of-flight mass cytometry and RNA sequencing identified unique inflammatory signatures in peripheral blood mononuclear cells stimulated with ASCVD plasma. By comparing these inflammatory signatures to large-scale gene expression data from the LINCS L1000 dataset, we identified drugs that could reverse this inflammatory response. Ex vivo screens, using human samples, showed that saracatinib-a phase 2a-ready SRC and ABL inhibitor-reversed the inflammatory responses induced by ASCVD plasma. In Apoe-/- mice, saracatinib reduced atherosclerosis progression by reprogramming reparative macrophages. In a rabbit model of advanced atherosclerosis, saracatinib reduced plaque inflammation measured by [18F] fluorodeoxyglucose positron emission tomography-magnetic resonance imaging. Here we show a systems immunology-driven drug repurposing with a preclinical validation strategy to aid the development of cardiovascular immunotherapies.


Conflict of interest statement

Competing Interests statement C.G. is listed as an inventor on patent application Tech 160808G PCT/US2022/017777, filed by the Icahn School of Medicine at Mount Sinai (patent applicant), that is directly related to the method used in this manuscript to identify saracatinib as an antiatherosclerotic agent. The remaining authors declare no competing interests.

Figures

Fig. 1
Fig. 1. Single-cell mass cytometry reveals signaling dynamics of human PBMCs from patients with atherosclerosis exposed to autologous plasma.
a, Experimental design. PBMCs and plasma were isolated from peripheral venous blood of patients with ASCVD (n = 9 biologically independent samples, 5 men). Healthy plasma was isolated from healthy donors (n = 9 biologically independent samples). Ex vivo stimulation of patients’ PBMCs with their autologous plasma was compared with stimulation using pooled healthy plasma, and intracellular signaling activation was analyzed by mass cytometry (CyTOF). This figure was created with Biorender.com. b, Biclustered heat map of filtered cell type–phosphoprotein data (FDR < 10%) shows significant activation of intracellular signaling (percentage phosphorylation change, auto versus healthy) in response to autologous (auto) versus pooled healthy plasma (healthy) measured as intracellular protein phosphorylation (n = 9). CD14+ monocyte and CD1c+ DCs were the most responsive cells, as shown by the number of phosphosites activated by atherosclerotic plasma. c, viSNE plot of PBMCs from patients with atherosclerosis shows major immune cell subsets based on canonical expression markers. d, Single-cell signaling patterns in response to autologous atherosclerotic (n = 9) or pooled healthy (n = 9) plasma were visualized across this immune map. e, Dot plots show the effect of autologous plasma (n = 9) versus pooled healthy plasma (n = 9) on the phosphorylation of intracellular kinases in CD14+ monocytes and CD1c+ DCs. P values were determined by two-tailed paired t-test. mono, monocyte; NK, natural killer; t-SNE, t-distributed stochastic neighbor embedding.
Fig. 2
Fig. 2. Multiplexed mass cytometry of intracellular signaling and cytokine expression profile mark the response of healthy immune cells to plasma from patients with atherosclerosis.
a, Heat map of mass cytometry data, ordered by stimulatory plasma condition and immune cell types, highlights the activation of specific intracellular markers in monocytes and CD1c+ DCs in response to plasma from patients with atherosclerosis (athero; n = 20 biologically independent samples, 10 men) or healthy plasma (n = 10 biologically independent samples). b, viSNE plot of all major healthy PBMC cell types defined based on canonical expression patterns. c, Intracellular signaling patterns were visualized across this immune map in response to plasma from patients with atherosclerosis (n = 20) or healthy plasma (n = 10). d, Dot plots show the effect of plasma from patients with atherosclerosis (n = 20) versus healthy plasma (n = 10) on the phosphorylation of intracellular kinases in CD14+ monocytes and CD1c+ DCs. P values were determined by two-tailed unpaired t-test. Data are presented as mean ± s.d. e, Heat map of cytokines released by healthy PBMCs stimulated with atherosclerotic (red; n = 10 biologically independent samples, 5 men) versus healthy donor (blue; n = 9 biologically independent samples) plasma, with clustering based on standardized z-scores of cytokine values and corresponding concentrations (picograms per milliliter). f, Point plot of cytokines released by PBMCs stimulated with plasma from patients with atherosclerosis (n = 20 biologically independent samples, 10 men) versus healthy plasma (n = 15 biologically independent samples). P values were determined by unpaired two-tailed t-test. g, Bar graph with overlapping dots of significant cytokines released by healthy PBMCs stimulated with either atherosclerotic patient (red; n = 20) or healthy plasma (blue; n = 15). P values were determined by unpaired two-tailed t-test. Data are presented as mean ± s.e.m.
Fig. 3
Fig. 3. Single-cell mass cytometry reveals distinct resting and stimulated immune responses in PBMCs from patients with atherosclerosis and healthy donors.
a, Heat map of mass cytometry data, ordered by immune cell types, highlights the activation of specific intracellular markers in unstimulated PBMCs from patients with atherosclerosis (no plasma athero PBMCs; n = 10 biologically independent samples, 5 men) versus unstimulated PBMCs from healthy donors (no plasma healthy PBMCs; n = 5 biologically independent samples). Clustering was based on standardized z-scores of median phosphoprotein values with absolute log2 FC > 0 considered upregulated with respect to healthy donors. Unpaired two-tailed t-test was used for significance. The Benjamini–Hochberg method was used for multiple correction (FDR < 0.05) and adjusted P values <0.05 were considered significant. b, Dot plots show the effect in PBMCs from healthy donors of atherosclerotic plasma (n = 20 biologically independent samples, 10 men) versus healthy plasma (n = 10 biologically independent samples) or no stimulation (no plasma; n = 5 biologically independent samples) on the phosphorylation of intracellular kinases in CD14+ monocytes and CD1c+ DCs. P values were determined by one-way ANOVA with Tukey’s post hoc test across all groups. c, Dot plots show the effect in PBMCs from autogolous plasma from patients with atherosclerosis (n = 9 biologically independent samples, 5 males) versus healthy plasma (n = 9 biologically independent samples) or no stimulation (n = 10 biologically independent samples, 5 men) on the phosphorylation of intracellular kinases in CD14+ monocytes and CD1c+ DCs. P values were determined by one-way ANOVA with Tukey’s post hoc test across all groups.
Fig. 4
Fig. 4. RNA-seq analysis of healthy PBMCs after plasma stimulation.
a, PCA of RNA-seq and corresponding CyTOF data aggregated by cell type. b, Heat map of DEGs in response to atherosclerotic plasma (atherosclerosis; n = 20 biologically independent samples, 10 men) versus healthy plasma (n = 12 biologically independent samples) showing the z-score of transcripts with absolute log2 FC > 1.2 and normalized sequence counts >4. DESeq, Benjamini–Hochberg, P < 0.05. c, Enriched GO molecular function and GO biological processes of the significant upregulated genes in response to atherosclerotic plasma versus healthy plasma. d, Enriched KEGG and BioPlanet signaling pathways of the significant upregulated genes in response to atherosclerotic plasma versus healthy plasma. e, Enriched GO molecular function and GO biological processes of the significant downregulated genes in response to atherosclerotic plasma versus pooled healthy plasma. f, Enriched KEGG and BioPlanet signaling pathways of the significant downregulated genes in response to atherosclerotic plasma versus pooled healthy plasma. Adjusted P values in cf were obtained using Fisher’s exact test and the Benjamini–Hochberg method. g, Heat map of a subnetwork of 227 DEGs associated with inflammatory response (GO:0006954) in response to atherosclerotic plasma versus pooled healthy plasma showing the z-score of transcripts with absolute log2 FC > 1.2 and normalized sequence counts >4. abs, absolute; AGE, advanced glycation end product; ER, endoplasmic reticulum; GnRH, gonadotropin-releasing hormone; inter, interaction; Padj, adjusted P value; PC, principal component; pres, presenting; proc, processing; RAGE, receptor for advanced glycation end product; reg, regulation; spec phosphat, specific phosphatase.
Fig. 5
Fig. 5. CCL5 emerges as an upstream regulator of PBMC activation upon plasma stimulation.
a, Ingenuity Pathway Analysis performed using the DEGs in PBMCs from healthy donors stimulated with either atherosclerotic plasma (n = 20 biologically independent samples, 10 men) or plasma from healthy donors (n = 12 biologically independent samples) revealed the top upstream regulators. Upstream regulators were plotted using the activation z-score from Ingenuity Pathway Analysis. Fisher’s exact test was used; P < 0.05 was considered statistically significant. b, Differentially expressed cytokines in plasma from patients with atherosclerosis (n = 20 biologically independent samples, 10 men) versus healthy donors (n = 15 biologically independent samples). Dots represent plasma levels of the tested cytokines and are expressed as picograms per milliliter. Dotted line represents the average (Ave.). P values were calculated by two-tailed unpaired t-test; P < 0.05 was considered statistically significant. c, Heat map of phosphoprotein expression in both monocytes and CD1c+ DCs in PBMCs from healthy donors stimulated with healthy plasma alone (healthy) or in combination with CCL5 (10,000 pg µl−1), CXCL1 (600 pg µl−1), CXCL10 (200 pg µl−1), PDGF-AA (600 pg µl−1) and PDGF-BB (500 pg µl−1). z-Scores were used to identify the significant changes in phosphorylation levels (n = 3 biologically independent samples per condition). d, viSNE plot of all major PBMC cell types defined based on canonical expression patterns. e, Intracellular signaling patterns were visualized across this immune map in response to plasma from patients with atherosclerosis admixed with either an antihuman CCL5 antibody (0.16 µg µl−1; n = 6 biologically independent samples, 3 men) or isotype control antibody (0.16 µg µl−1; n = 6 biologically independent samples, 3 men). Unstimulated PBMCs were included as control (no plasma). f, Dot plots show the effect of CCL5 blocking on the phosphorylation of intracellular kinases in CD14+ monocytes and CD1c+ DCs after stimulation with atherosclerotic plasma. P values were determined by unpaired two-tailed t-test.
Fig. 6
Fig. 6. Drug repurposing computational pipeline to identify candidate anti-inflammatory small molecules for atherosclerotic disease and ex vivo screening approach.
a, Input gene set signatures consisting of 4,823 DEGs and 277 inflammatory (GO:0006954) DEGs in healthy PBMCs, in response to atherosclerotic plasma. b, LINCS L1000CDS2 search engine used to identify drugs predicted to reverse the input transcriptional signatures. This figure was created with Biorender.com. c, Candidate drugs predicted to reverse the two gene set input signatures in healthy PBMCs, in response to atherosclerotic plasma. d, Drug screening was based on the integrated analysis of phospho-CyTOF screens, gene expression analysis and cytokine secretion by PBMCs and plaques in response to atherosclerotic plasma in the presence or the absence of candidate drugs in healthy PBMCs, in response to atherosclerotic plasma. e, Single-cell phosphorylation measured by CyTOF in CD1c+ DCs and CD14+ and CD16+ monocytes from PBMCs stimulated with atherosclerotic plasma alone (plasma) or in combination with individual top candidate small molecules (1–8), n = 4 biologically independent samples/condition. f, t-Statistics of monocyte- and DC-specific phosphorylation, with positive values indicating upregulation and negative values downregulation. Plasma response is compared with no plasma treatment. Each small molecule combined with plasma treatment is compared with plasma treatment alone. Points outside the gray box indicate significance (P < 0.05, d.f. = 6), n = 4 biologically independent samples per condition (2 men). g, Heat map of DEGs showing the z-scores of transcripts with absolute log2 FC > 0 and q value (adjusted p value) <0.05 in PBMCs in response to candidate drugs plus atherosclerotic plasma versus atherosclerotic plasma alone (vehicle), n = 4 biologically independent samples per condition (2 men). h, Heat map of saracatinib target and phosphosignaling genes showing the z-scores of transcripts in PBMCs in response to candidate drugs plus atherosclerotic plasma versus atherosclerotic plasma alone (vehicle), n = 4 biologically independent samples/condition (2 men). i, Point plot of PBMC cytokines secreted in response to candidate drugs plus atherosclerotic plasma (n = 4 biologically independent samples per condition, 2 men) versus atherosclerotic plasma alone (vehicle, n = 4 biologically independent samples per condition, 2 men). P values were determined by paired two-tailed t-test. Adjusted P values were considered significant. The Benjamini–Hochberg method was used to correct for multiple correction (FDR < 0.05). j, Heat map of DEGs showing the z-scores of transcripts with absolute log2 FC > 1.2 and q value <0.001 in atherosclerotic tissue in response to saracatinib plus atherosclerotic plasma (saracatinib) versus atherosclerotic plasma alone (vehicle), n = 3 samples per condition. k, Point plot of cytokines secreted by atherosclerotic tissue in response to saracatinib plus atherosclerotic plasma (saracatinib) versus atherosclerotic plasma alone (vehicle), n = 3 biological samples per condition. P values were determined by unpaired t-test. Illustrations of representative heat maps in d and representative PBMC tubes and arteries in gk were created in Biorender.com.
Fig. 7
Fig. 7. Effect of saracatinib on atherosclerosis in vivo.
a, Experimental design to study the effect of saracatinib 6.25 (S6.25), 12.5 (S12.5) or 25 (S25) mg kg−1 d−1; atorvastatin (AT; 10 mg kg−1 d−1); or the combination of saracatinib and atorvastatin (S + AT; 12.5 or 25 and 10 mg kg−1 d−1) admixed to WD on plaque burden, composition and gene expression compared with WD alone in male Apoe−/− mice. This figure was created with Biorender.com. b, Representative images of en face preparation of aortas stained with ORO. c, Bar graphs with overlapping dots of en face ORO+ area quantification (plaque area). WD, n = 10; AT, n = 9; S6.25, n = 6; S12.5, n = 9; S25, n = 8; S12.5 + AT, n = 10; S25 + AT, n = 8 mice. P values were determined by one-way ANOVA with Tukey’s post hoc test across all groups. d, Representative images of CD68 immunostaining of the aortic root (4× magnification). e, Bar graphs with overlapping dots of CD68+ area quantification. WD, n = 10; AT, n = 10; S6.25, n = 10; S12.5, n = 5; S25, n = 10; S12.5 + AT, n = 5; S25 + AT, n = 5 mice. P values were determined by one-way ANOVA with Tukey’s post hoc test. Data are presented as mean ± s.d. f, Heat map of the top 100 DEGs hierarchically clustered expressed in the aortas across treated mice. WD, n = 5; AT, n = 3; S, n = 6; S + AT, n = 4 mice. Rows, z-scored gene expression values; columns, individual aortas. The treatment categories are indicated above the heat map and the dendrograms on the right indicate the DEGs enriched in the different categories. P values were determined by the two-sided binomial proportions test. g, Top DEGs involved in the TCA cycle and OXPHOS induced by saracatinib in the aortas of treated mice, n = 6. This figure was created with Biorender.com. h, GO molecular functions of the top 100 DEGs upregulated in the saracatinib group, n = 6 mice. The combined score (c) was calculated from the P value obtained using Fisher’s exact test. i, GO Biological Process of the top 100 DEGs upregulated in the saracatinib group, n = 6 mice. The combined score was calculated from the P value obtained using Fisher’s exact test. j, BioPlanet signaling pathway analysis of the top 100 DEGs upregulated in the saracatinib group, n = 6 mice. The combined score was calculated from the P value obtained using Fisher’s exact test. k, OCR and respiratory parameters in mouse BMDMs treated with vehicle (dimethylsulfoxide (DMSO), n = 5 biologically independent samples), DMSO + oxLDL (n = 4 biologically independent samples), 0.1 µM saracatinib (sara) or 0.1 µM saracatinib + oxLDL (n = 5 biologically independent samples/condition). Data are presented as mean ± s.d. l, Summary of respiratory parameters in mouse BMDMs treated with vehicle (DMSO), DMSO + oxLDL, 0.1 µM saracatinib or 0.1 µM saracatinib + oxLDL (n = 5, biologically independent samples per condition): basal OCR, ATP production, maximal respiratory OCR, spare respiratory capacity. P values were determined by one-way ANOVA with Dunnet’s post hoc test vs vehicle. Data are presented as mean ± s.d.
Fig. 8
Fig. 8. Effect of saracatinib in a rabbit model of advanced atherosclerosis.
a, Experimental design to study the effect of 4 mg kg−1 d−1 saracatinib (S), 3 mg kg−1 d−1 atorvastatin (AT) or the combination of saracatinib and atorvastatin (S + AT; at 4 and 3 mg kg−1 d−1) on existing plaques in male New Zealand white rabbits. This figure was created with Biorender.com. b, Total cholesterol levels in plasma of rabbits treated with WD, WD plus AT, S and S + AT. Two-way ANOVA with Tukey’s post hoc correction for multiple comparisons. Data are presented as mean ± s.e.m. WD, n = 10; AT, n = 6; S, n = 8; S + AT, n = 8 rabbits. c, Pretreatment (16 weeks) and post-treatment (28 weeks) [18F]FDG uptake by the atherosclerotic arterial wall measured as SUVmax in each treatment group. WD, n = 9; AT, n = 7; S, n = 6; S + AT, n = 6. P values were determined by paired two-tailed t-test. d, Changes in [18F]FDG uptake by the atherosclerotic arterial wall between 16 and 28 weeks, measured as change in SUVmax (ΔSUVmax) in each treatment group. WD, n = 9; AT, n = 7; S, n = 6; S + AT, n = 6. One-way ANOVA with Fisher’s least significant difference test versus WD. Data are presented as mean ± s.e.m. e, Representative images of [18F]FDG PET–MRI of rabbit aortas for each group at 16 and 28 weeks. f, Representative images of RAM11 immunostaining of the rabbit abdominal aortas (4× magnification). g, Bar graphs with overlapping dots of RAM11+ area quantification. WD, n = 10; AT, n = 7; S, n = 7; S + AT, n = 7 rabbits. P values were determined by one-way ANOVA with Tukey’s post hoc test across all groups. Data are presented as mean ± s.d. h, Representative images of ORO staining of the rabbit abdominal aortas (4× magnification). i, Bar graphs with overlapping dots of ORO+ area quantification. WD, n = 10; AT, n = 7; S, n = 7; S + AT, n = 7 rabbits. P values were determined by one-way ANOVA with Tukey’s post hoc test across all groups. Data are presented as mean ± s.d. Chol, cholesterol.
Extended Data Fig. 1
Extended Data Fig. 1. Ex-vivo plasma-stimulated PBMCs from atherosclerotic patients were stained with a panel of antibodies and analyzed by phospho-CyTOF.
A. Expression of surface canonical markers using viSNE in Cytobank. The distribution of each of the clustering parameters is presented as a color scale in z-dimension for manual identification of each cluster immune population in Fig. 1. B. Expression of surface canonical markers visualized using a heat map. C. Dot plots show the effect of autologous plasma vs. healthy plasma on the phosphorylation of intracellular kinases in CD14+ monocytes (n = 9 biologically independent samples; males=5). P values were determined by paired two-tailed t-test. D. Dot plots show the effect of autologous plasma vs. healthy plasma on the phosphorylation of intracellular kinases in CD1c+ DCs (n = 9 biologically independent samples; males=5). P values were determined by paired two-tailed t-test. E. Dot plots show the effect of autologous plasma vs. healthy plasma on the phosphorylation of intracellular kinases in CD16+ monocytes (n = 9 biologically independent samples; males=5). P values were determined by paired two-tailed t-test.
Extended Data Fig. 2
Extended Data Fig. 2. Ex-vivo stimulated healthy PBMCs were stained with a panel of antibodies and analyzed by CyTOF and Luminex.
A. Expression of surface canonical markers using viSNE in Cytobank. The distribution of each of the clustering parameters is presented as a color scale in z-dimension for the manual identification of each cluster immune population in Fig. 2. B. Expression of surface canonical markers visualized using a heatmap. C. Batch correction of CyTOF data from 2 independent experiments used for the results of Fig. 2. Blue dots correspond to responses to healthy plasma (n = 10 biologically independent samples), red dots to atherosclerosis plasma (n = 20 biologically independent samples; males=10). D. Dot plots show the effect of atherosclerotic plasma (n = 20 biologically independent samples; males=10) vs. healthy plasma (n = 10 biologically independent samples) on the phosphorylation of intracellular kinases in CD14+ monocytes and CD1c+ DCs. P values were determined by unpaired two-tailed t-test. Data are presented as mean values +/- SD. E. Dot plots show the effect of atherosclerotic plasma (n = 20 biologically independent samples; males=10) vs. healthy plasma (n = 10 biologically independent samples) on the phosphorylation of intracellular kinases in CD16+ monocytes. P values were determined by unpaired t-test, two-tailed. Data are presented as mean values +/- SD. F. Heatmap of cytokine levels in plasma of atherosclerotic (red, n = 20 biologically independent samples; males=10) vs. healthy donors’ (blue, n = 15 biologically independent samples) plasma with clustering based on standardized z-scores of cytokine values and correspondent concentrations (pg/ml). G. Point plot of cytokines levels in plasma of PBMCs stimulated with atherosclerotic patient plasma (n = 20 biologically independent samples; males=10) vs healthy plasma (n = 15 biologically independent samples). P values were determined by unpaired two-tailed t-test.
Extended Data Fig. 3
Extended Data Fig. 3. Immune responses to atheroplasma and healthy plasma versus baseline and to plasma from symptomatic or asymptomatic patients.
A. Heatmap of cytokines released by healthy PBMCs stimulated with atherosclerotic (red, n = 8 samples/condition) vs. healthy donor (light blue, n = 8 samples/condition) plasma or not stimulated (no plasma, dark blue, n = 6 samples/condition), with clustering based on standardized z-scores of cytokine values. B. Point plot of cytokines released by PBMCs stimulated with atherosclerotic patient plasma (n = 8) vs healthy plasma (n = 8) or not stimulated cells (no plasma, n = 6). P-values were determined using unpaired t-test and corrected for multiple comparison using Benjamini-Hochberg (BH) method (FDR < 0.1). C. Heatmap of log2 fold change of phosphoproteins mass cytometry data, ordered by immune cell types, shows no significant difference in PBMCs stimulated with atherosclerotic plasma from symptomatic patients (sym, n = 10, males=5) vs asymptomatic patients (asym, n = 10, males=5). D. Point plot of phosphoproteins shows no significant difference in their expression in immune cell types in PBMCs stimulated with atherosclerotic plasma from symptomatic patients (sym, n = 10, males=5) vs asymptomatic patients (asym, n = 10, males=5). P-values were determined using unpaired t-test and corrected for multiple comparison using Benjamini-Hochberg (BH) method (FDR < 0.05). P < 0.05 was considered significant. E. Point plot shows no significant difference in cytokine released by PBMCs stimulated with atherosclerotic plasma from symptomatic patients (sym, n = 10, males=5) vs asymptomatic patients (asym, n = 10, males=5). P-values were determined using unpaired two-tailed t-test. P < 0.05 was considered significant.
Extended Data Fig. 4
Extended Data Fig. 4. Integrative cross-correlation analysis of RNA-seq and aggregated mass cytometry data corroborated the atherosclerotic plasma-driven inflammatory signature and intracellular signaling.
A. Heatmap of a sub-network of cytokine DEGs in response to atherosclerotic plasma (atherosclerosis, n = 20 biologically independent samples, males=10) vs. pooled healthy plasma (healthy, n = 12 biologically independent samples), showing z-score of transcripts with absolute log2 fold change >1.2 and normalized sequence counts >4 associated with cytokine activity (GO:0005125). B. Co-expression Pearson correlation analysis of DEGs in response to atherosclerotic plasma (atherosclerosis, n = 20 biologically independent samples, males=10) vs. pooled healthy plasma (healthy, n = 12 biologically independent samples), filtered for cytokine activity (GO:0005125). C. Enriched GO terms from gene expression data in response to atherosclerotic plasma (n = 20 biologically independent samples; males=10) vs. pooled healthy plasma (n = 12 biologically independent samples). D. Hierarchically ordered heatmap of Pearson’s correlations between gene expression and phosphoprotein-cell type pairs in response to atherosclerotic plasma (n = 20 biologically independent samples, males=10) vs. pooled healthy plasma (healthy, n = 12 biologically independent samples). Only DEGs in healthy PBMCs, in response to atherosclerotic plasma, belonging to the enriched GO terms are included. E. Pairs of phosphoprotein and cell-type with the highest median cross-correlation with RNA-seq data. Box plots showing the median and range (min to max). F. Enriched TFs obtained by analyzing upregulated DEGs in healthy PBMCs, in response to atherosclerotic plasma, against ChIP-seq libraries and position weight matrix (PWM) predictions. G. Enriched TFs obtained by analyzing downregulated DEGs in healthy PBMCs, in response to atherosclerotic plasma, against ChIP-seq libraries and position weight matrix (PWM) predictions.
Extended Data Fig. 5
Extended Data Fig. 5. Circulating levels of candidate cytokines correlated with phospho-sites activated in monocytes.
A. Spearman correlation of CCL5 levels in plasma of atherosclerotic patients with intracellular signal intensity of pCREB, pp38, pERK1/2, pMAPKAPK2 and pS6 phosphorylation in monocytes. B. Spearman correlation of CXCL1 levels in plasma of atherosclerotic patients with intracellular signal intensity of pCREB, pp38, pERK1/2, pMAPKAPK2 and pS6 phosphorylation in monocytes. C. Spearman correlation of CXCL10 levels in plasma of atherosclerotic patients with intracellular signal intensity of pCREB, pp38, pERK1/2, pMAPKAPK2 and pS6 phosphorylation in monocytes. D. Spearman correlation of PDGFAA levels in plasma of atherosclerotic patients with intracellular signal intensity of pCREB, pp38, pERK1/2, pMAPKAPK2 and pS6 phosphorylation in monocytes. E. Spearman correlation of PDGFBB levels in plasma of atherosclerotic patients with intracellular signal intensity of pCREB, pp38, pERK1/2, pMAPKAPK2 and pS6 phosphorylation in monocytes. P < 0.05 was considered significant. Data are from n = 20; biologically independent samples; males=10. Data are presented as mean and error with 95% CI.
Extended Data Fig. 6
Extended Data Fig. 6. oxLDL did not reproduce the identified phosphosignaling in PBMCs stimulated with atheroplasma.
A. Principal component analysis (PCA) of CyTOF data aggregated by cell type. B. viSNE plot of all major healthy PBMC cell types defined based on canonical expression patterns. C. Intracellular signaling patterns were visualized across this immune map in response to atheroplasma (athero) vs atheroplasma + oxLDL (athero+oxLDL), stimulation with oxLDL for 6 hours (oxLDL, 50 µg/ml) or no stimulation (no plasma). N = 4 biologically independent samples/condition; males n = 1. D. Dot plots show the effect of atheroplasma (athero) vs atheroplasma + oxLDL (athero+oxLDL), stimulation with oxLDL for 6 hours (oxLDL, 50 µg/ml) or no stimulation (no plasma) on the phosphorylation of intracellular kinases in CD14+ monocytes and CD1c+ DCs (n = 4/condition). P values were determined by one-way ANOVA with Tukey’s post hoc test across all groups. E. Point plot of released cytokines of PBMCs stimulated with atheroplasma (athero, n = 6 samples), oxLDL (n = 6 samples), atheroplasma + oxLDL (athero+oxLDL, n = 6 samples), or no stimulation (no plasma; n = 6 samples). P values were determined by paired two-tailed t-test and the BH method (FDR < 0.1) was used to correct for multiple correction.
Extended Data Fig. 7
Extended Data Fig. 7. Small molecules screening identified saracatinib as negative regulator of inflammatory signatures in PBMCs and atherosclerotic tissue.
A. Top 50 candidate small molecules predicted using 4,823 DEGs input gene set in LINCS-L1000CDS2 in healthy PBMCs, in response to atherosclerotic plasma. B. Top 50 candidate small molecules predicted using 277 inflammatory (GO:0006954) DEGs as gene set input in LINCS-L1000CDS. C. Heatmap of phosphosite responses to selected candidate drugs across all immune cell types summarizing the signaling responses to atherosclerotic plasma alone (vehicle) or in combination with candidate small-molecules (1-8), n = 4 biologically independent samples/condition; males=2. D. t-statistics of cell-type-specific phosphorylation of all immune cells with positive values indicating up-regulation and negative values down-regulation. Plasma response is compared to no plasma treatment. Each small-molecule combined with plasma treatment is compared to plasma treatment alone. Points outside the grey box indicate significance (p < 0.05, df=6), n = 4/condition. E. Signaling pathway analysis of the DEGs downregulated by saracatinib in atherosclerotic tissue treated with atherosclerotic plasma alone (vehicle) or in combination with saracatinib. The combined score (c) was calculated from the p value (p) obtained using Fisher’s exact test. P < 0.05 was considered significant.
Extended Data Fig. 8
Extended Data Fig. 8. Saracatinib altered the signaling induced by athero plasma by reducing the activation of SRC, LCK and PI3K/Akt/mTOR signaling.
A. viSNE plot of major cell types in healthy PBMC defined based on canonical expression patterns. B. The phosphorylation signaling of AKT, LCK, SRC was visualized across this immune map in response to atheroplasma (athero) vs atheroplasma + saracatinib 10 µM (athero+sara), or no stimulation (no plasma); n = 4 biologically independent samples/condition, males=1. C. Dot plots show the effect of atheroplasma (athero) vs atheroplasma + saracatinib 10 µM (athero+sara), or no stimulation (no plasma) on the phosphorylation of AKT, LCK, SRC in CD14+ monocytes and CD1c+ DCs, n = 4 biologically independent samples/condition, males=1. P values were determined by one-way ANOVA with Tukey’s post hoc test across all groups. D. Dot plots show the effect of atheroplasma (athero) vs atheroplasma + saracatinib 10 µM (athero+sara), or no stimulation (no plasma) on protein levels of AKT, LCK, SRC in CD14+ monocytes; n = 4 biologically independent samples/condition, males=1. P values were determined by one-way ANOVA with Tukey’s post hoc test across all groups. E. Dot plots show the effect of atheroplasma (athero) vs atheroplasma + saracatinib 10 µM (athero+sara), or no stimulation (no plasma) on total protein levels of AKT, LCK, SRC in CD1c+ DCs; n = 4 biologically independent samples/condition, males=1. P values were determined by one-way ANOVA with Tukey’s post hoc test across all groups. F. Dot plots show the effect of atheroplasma (athero) vs atherosplasma + saracatinib 10 µM (athero+sara), or no stimulation (no plasma) on phosphorylation and total protein levels of AKT, LCK, SRC in CD16+ monocytes, CD4 + T cells, CD8 + T cells; n = 4 biologically independent samples/condition, males=1. P values were determined by one-way ANOVA with Tukey’s post hoc test across all groups. G. Dot plots show the effect of atheroplasma (athero) vs atheroplasma + saracatinib 10 µM (athero+sara), or no stimulation (no plasma) on total protein levels of AKT, LCK, SRC in CD16+ monocytes, CD4 + T cells, CD8 + T cells; n = 4 biologically independent samples/condition, males=1. P values were determined by one-way ANOVA with Tukey’s post hoc test across all groups.
Extended Data Fig. 9
Extended Data Fig. 9. Effect of saracatinib on both circulating mouse immune cell and plaque lesions.
A. Total cholesterol levels in plasma of ApoE-/- mice treated with western diet (WD), WD plus atorvastatin (10 mg/kg/day) (AT), WD plus saracatinib 6.25 mg/kg/day (S6.25), WD plus saracatinib 12.5 mg/kg/day (S12.5), WD plus saracatinib 25 mg/kg/day (S25), WD plus atorvastatin (10 mg/kg/day) and saracatinib 12.5 mg/kg/day (S12.5 + AT), WD plus atorvastatin (10 mg/kg/day) and saracatinib 25 mg/kg/day (S25 + AT); WD: n = 10; AT: n = 10; S6.25: n = 10; S12.5: n = 10; S25: n = 10; S12.5 + AT: n = 4; S25 + AT: n = 4 mice. Two-way ANOVA with Dunnett post-hoc correction for multiple comparisons. Data are presented as mean values +/- SEM. B. Representative images of CD3 immunostaining of the mouse aortic root done across the following treatments: WD, AT, S 12.5 and AT + S 12.5. (4X magnification). C. Bar graphs with overlapping dots of CD3+ area quantification. P values were determined by one-way ANOVA with Tukey’s post hoc test across all groups. WD: n = 5; AT: n = 5; S12.5: n = 5; S12.5 + AT: n = 6 mice. Data are presented as mean values +/- SD. D. CyTOF analysis of circulating immune cell from available whole blood from mice samples at 16 weeks. Major immune cell populations in blood (neutrophils, CD4 T cells, CD8 T cells, monocytes, eosinophils and dendritic cells (DCs) were analyzed across the following treatments: WD, AT, S 12.5 and AT + S 12.5. Box plots and whiskers showing the mean and range (min to max). P values were determined by one-way ANOVA with Tukey’s post hoc test across all groups. n = 4 mice/group. E. GO Molecular functions and signaling pathway analysis of the top 100 DEGs upregulated in the WD group. (n = 5 mice) The combined score (c) was calculated from the p-value obtained using Fisher’s exact test. F. GO Molecular functions and signaling pathway analysis of the top 100 DEGs upregulated in the atorvastatin group, (n = 3 mice). The combined score (c) was calculated from the p-value obtained using Fisher’s exact test. G. GO Molecular functions and signaling pathway analysis of the top 100 DEGs upregulated in the saracatinib+atorvastatin group, n = 4 mice. The combined score (c) was calculated from the p-value obtained using Fisher’s exact test.
Extended Data Fig. 10
Extended Data Fig. 10. Effect of Saracatinib in a Rabbit Model of Advanced Atherosclerosis.
A. Changes in vessel wall area (VWA, cm2) between 16 weeks and 28 weeks measured as the percentage of the difference between outer and inner wall area (delta VWA %) in each treatment group, WD: n = 7; AT: n = 4; S12.5: n = 6; S12.5 + AT: n = 6. One-way ANOVA with Tukey’s post hoc test across all groups. Box plots showing the mean and range (min to max). B. Representative cross-sectional MRI images of rabbit aortas for each group at 16 and 28 weeks (L=longitudinal sections; C=cortical sections) Red arrows indicate the aorta position. C. Pre-treatment (16 weeks) and post-treatment (28 weeks) vessel wall area (VWA, cm2) in each treatment group. P values were determined by unpaired two-tailed t-test. D. Bar graphs of complete blood count (CBC) for each group measuring the concentration of neutrophils, lymphocytes, monocytes and eosinophils (103/ul) at 28 weeks, n = 3 rabbits/group. Floating bars showing the mean and range (min to max). P values were determined by one-way ANOVA with Tukey’s post hoc test across all groups.

References

    1. Dai H, et al. The global burden of disease attributable to high body mass index in 195 countries and territories, 1990-2017: an analysis of the Global Burden of Disease Study. PLoS Med. 2020;17:e1003198. doi: 10.1371/journal.pmed.1003198. - DOI - PMC - PubMed
    1. Virani SS, et al. Heart disease and stroke statistics-2021 update: a report from the American Heart Association. Circulation. 2021;143:e254–e743. doi: 10.1161/CIR.0000000000000950. - DOI - PubMed
    1. Abdelsayed M, Kort EJ, Jovinge S, Mercola M. Repurposing drugs to treat cardiovascular disease in the era of precision medicine. Nat. Rev. Cardiol. 2022;19:751–764. doi: 10.1038/s41569-022-00717-6. - DOI - PMC - PubMed
    1. Arnett DK, et al. 2019 ACC/AHA Guideline on the Primary Prevention of Cardiovascular Disease: a report of the American College of Cardiology/American Heart Association Task Force on Clinical Practice Guidelines. Circulation. 2019;140:e596–e646. - PMC - PubMed
    1. Libby P. The changing landscape of atherosclerosis. Nature. 2021;592:524–533. doi: 10.1038/s41586-021-03392-8. - DOI - PubMed