

Analysis of the response mechanisms of Pinellia ternata to terahertz wave stresses using transcriptome and metabolic data
- PMID: 37771489
- PMCID: PMC10522861
- DOI: 10.3389/fpls.2023.1227507
Analysis of the response mechanisms of Pinellia ternata to terahertz wave stresses using transcriptome and metabolic data
Abstract
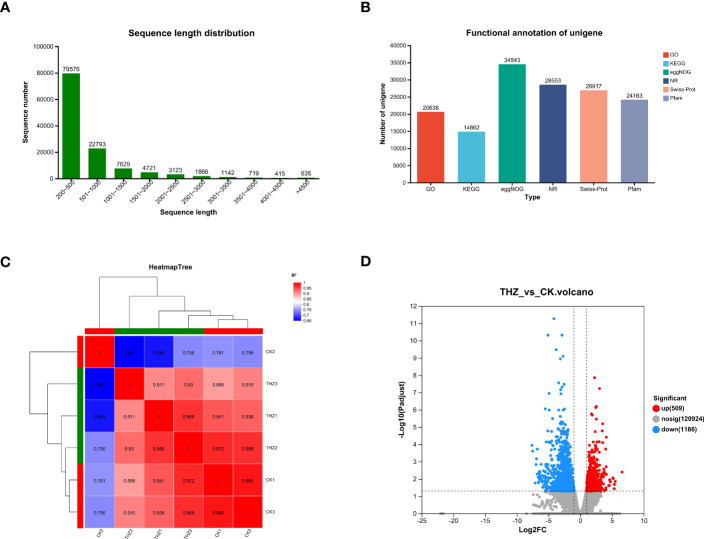
Pinellia ternata (Thunb.) Breit. (Araceae), a significant medicinal plant, has been used to treat various diseases for centuries. Terahertz radiation (THZ) is located between microwaves and infrared rays on the electromagnetic spectrum. THZ possesses low single-photon energy and a spectral fingerprint, but its effects on plant growth have not yet been investigated. The study's primary objective was to examine the transcriptome and metabolome databases of the SY line to provide a new perspective for identifying genes associated with resistance and growth promotion and comprehending the underlying molecular mechanism. Variations in the biological characteristics of P. ternata grown under control and experimental conditions were analyzed to determine the effect of THZ. Compared with the control group, phenotypic variables such as leaf length, petiole length, number of leaves, leaf petiole diameter, and proliferation coefficient exhibited significant differences. P. ternata response to THZ was analyzed regarding the effects of various coercions on root exudation. The experimental group contained considerably more sugar alcohol than the control group. The transcriptome analysis revealed 1,695 differentially expressed genes (DEGs), including 509 upregulated and 1,186 downregulated genes. In the KEGG-enriched plant hormone signaling pathway, there were 19 differentially expressed genes, 13 of which were downregulated and six of which were upregulated. In the metabolomic analysis, approximately 416 metabolites were uncovered. There were 112 DEMs that were downregulated, whereas 148 were upregulated. The P. ternata leaves displayed significant differences in phytohormone metabolites, specifically in brassinolide (BR) and abscisic acid (ABA). The rise in BR triggers alterations in internal plant hormones, resulting in faster growth and development of P. ternata. Our findings demonstrated a link between THZ and several metabolic pathway processes, which will enhance our understanding of P. ternata mechanisms.
Keywords: Pinellia ternata; metabonomic; plant hormones; terahertz; transcriptome.
Copyright © 2023 Wang, Sarsaiya, Qian, Jin, Shu, Zhang and Chen.
Conflict of interest statement
The authors declare that the research was conducted in the absence of any commercial or financial relationships that could be construed as a potential conflict of interest.
Figures


Similar articles
-
Unveiling terahertz wave stress effects and mechanisms in Pinellia ternata: Challenges, insights, and future directions.Physiol Plant. 2024 Jan-Feb;176(1):e14195. doi: 10.1111/ppl.14195. Physiol Plant. 2024. PMID: 38332400 Review.
-
Integrated analysis of metabolome and transcriptome reveals key candidate genes involved in flavonoid biosynthesis in Pinellia ternata under heat stress.J Plant Res. 2023 May;136(3):359-369. doi: 10.1007/s10265-023-01446-8. Epub 2023 Mar 7. J Plant Res. 2023. PMID: 36881276 Free PMC article.
-
Transcriptomic and metabolomic profiling provide insight into the role of sugars and hormones in leaf senescence of Pinellia ternata.Plant Cell Rep. 2024 Apr 22;43(5):125. doi: 10.1007/s00299-024-03222-x. Plant Cell Rep. 2024. PMID: 38647720
-
Transcriptome analysis reveals important regulatory genes and pathways for tuber color variation in Pinellia ternata (Thunb.) Breit.Protoplasma. 2023 Sep;260(5):1313-1325. doi: 10.1007/s00709-023-01845-7. Epub 2023 Mar 15. Protoplasma. 2023. PMID: 36918417
-
Pinellia ternata (Thunb.) Breit: A review of its germplasm resources, genetic diversity and active components.J Ethnopharmacol. 2020 Dec 5;263:113252. doi: 10.1016/j.jep.2020.113252. Epub 2020 Aug 13. J Ethnopharmacol. 2020. PMID: 32798614 Review.
Cited by
-
Unraveling the functional consequences of a novel germline missense mutation (R38C) in the yeast model of succinate dehydrogenase subunit B: insights into neurodegenerative disorders.Front Mol Neurosci. 2023 Sep 28;16:1246842. doi: 10.3389/fnmol.2023.1246842. eCollection 2023. Front Mol Neurosci. 2023. PMID: 37840772 Free PMC article.
-
Bulbil initiation: a comprehensive review on resources, development, and utilisation, with emphasis on molecular mechanisms, advanced technologies, and future prospects.Front Plant Sci. 2024 Apr 8;15:1343222. doi: 10.3389/fpls.2024.1343222. eCollection 2024. Front Plant Sci. 2024. PMID: 38650701 Free PMC article. Review.
References
-
- Ali B., Hafeez A., Ahmad S., Javed M. A., Sumaira, Afridi M. S., et al. . (2022. a). Bacillus thuringiensis PM25 ameliorates oxidative damage of salinity stress in maize via regulating growth, leaf pigments, antioxidant defense system, and stress responsive gene expression. Front. Plant Sci. 13. doi: 10.3389/fpls.2022.921668 - DOI - PMC - PubMed
-
- Ali B., Wang X., Saleem M. H., Sumaira, Hafeez A., Afridi M. S., et al. . (2022. b). PGPR-mediated salt tolerance in maize by modulating plant physiology, antioxidant defense, compatible solutes accumulation and bio-surfactant producing genes. Plants (Basel) 11 (3), 345. doi: 10.3390/plants11030345 - DOI - PMC - PubMed
LinkOut - more resources
Full Text Sources