. 2023 Sep 20:11:100524.
doi: 10.1016/j.ejro.2023.100524. eCollection 2023 Dec.

Automated advanced imaging in acute ischemic stroke. Certainties and uncertainties

Affiliations

Automated advanced imaging in acute ischemic stroke. Certainties and uncertainties

Enrico Fainardi et al. Eur J Radiol Open. .

Abstract

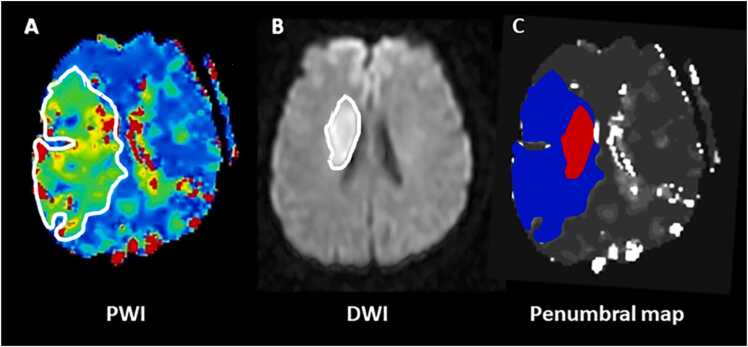
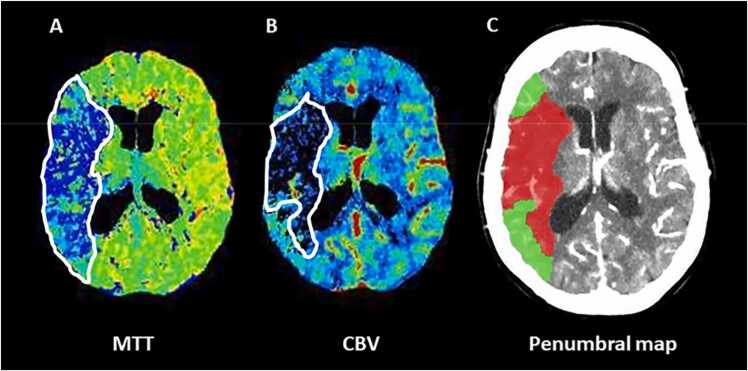
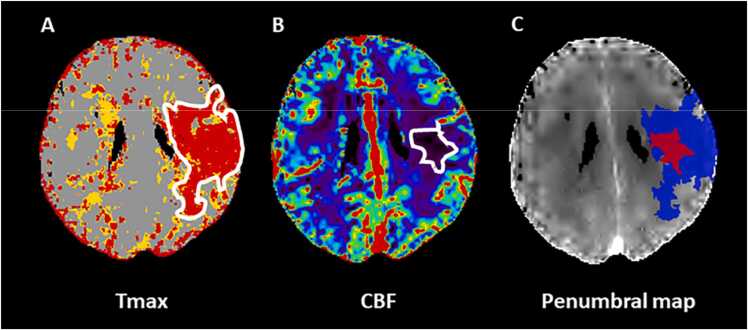
The purpose of this is study was to review pearls and pitfalls of advanced imaging, such as computed tomography perfusion and diffusion-weighed imaging and perfusion-weighted imaging in the selection of acute ischemic stroke (AIS) patients suitable for endovascular treatment (EVT) in the late time window (6-24 h from symptom onset). Advanced imaging can quantify infarct core and ischemic penumbra using specific threshold values and provides optimal selection parameters, collectively called target mismatch. More precisely, target mismatch criteria consist of core volume and/or penumbra volume and mismatch ratio (the ratio between total hypoperfusion and core volumes) with precise cut-off values. The parameters of target mismatch are automatically calculated with dedicated software packages that allow a quick and standardized interpretation of advanced imaging. However, this approach has several limitations leading to a misclassification of core and penumbra volumes. In fact, automatic software platforms are affected by technical artifacts and are not interchangeable due to a remarkable vendor-dependent variability, resulting in different estimate of target mismatch parameters. In addition, advanced imaging is not completely accurate in detecting infarct core, that can be under- or overestimated. Finally, the selection of candidates for EVT remains currently suboptimal due to the high rates of futile reperfusion and overselection caused by the use of very stringent inclusion criteria. For these reasons, some investigators recently proposed to replace advanced with conventional imaging in the selection for EVT, after the demonstration that non-contrast CT ASPECTS and computed tomography angiography collateral evaluation are not inferior to advanced images in predicting outcome in AIS patients treated with EVT. However, other authors confirmed that CTP and PWI/DWI postprocessed images are superior to conventional imaging in establishing the eligibility of patients for EVT. Therefore, the routine application of automatic assessment of advanced imaging remains a matter of debate. Recent findings suggest that the combination of conventional and advanced imaging might improving our selection criteria.

Keywords: Advanced imaging; Automatic software (maximum 6); Patient selection; Reperfusion therapies; Stroke.


Conflict of interest statement

The authors declare that they have no known competing financial interests or personal relationships that could have appeared to influence the work reported in this paper.

Figures

Fig. 1
Fig. 1
The perfusion-weighted imaging (PWI)-diffusion-weighted imaging (DWI) mismatch in a 57 year-old patient with acute ischemic stroke (AIS) and ischemic lesion in the right middle cerebral artery (MCA) territory. Panel A: Color coded PWI time to the peak of the residual function (Tmax) map indicates total critically hypoperfused tissue; Panel B: DWI shows infarct core; Panel C: penumbral map illustrates infarcted tissue (red) and ischemic penumbra (blue) obtained from the difference between PWI and DWI lesion sizes.
Fig. 2
Fig. 2
The computed tomography perfusion (CTP) mean transit time (MTT)-cerebral blood volume (CBV) mismatch in a 65 year-old patient with acute ischemic stroke (AIS) and ischemic lesion in the right middle cerebral artery (MCA) territory. Panel A: Color coded MTT map indicates total critically hypoperfused tissue; Panel B: Color coded CBV shows infarct core; Panel C: penumbral map illustrates infarcted tissue (red) and ischemic penumbra (green) obtained from the difference between MTT and CBV lesion sizes.
Fig. 3
Fig. 3
The computed tomography perfusion (CTP) time to the peak of the residual function (Tmax)-cerebral blood flow (CBF) mismatch in a 69 year-old patient with acute ischemic stroke (AIS) and ischemic lesion in the left middle cerebral artery (MCA) territory. Panel A: Color coded Tmax map indicates total critically hypoperfused tissue; Panel B: Color coded CBF shows infarct core; Panel C: penumbral map illustrates infarcted tissue (red) and ischemic penumbra (blue) obtained from the difference between Tmax and CBF lesion sizes.
Fig. 4
Fig. 4
Automatic calculation of target mismatch obtained with Olea Sphere from computed tomography perfusion in a 72 year-old patient with acute ischemic stroke (AIS) having an ischemic lesion in the left middle cerebral artery (MCA) territory. The patient was admitted at 13 h from onset with National Institute of Health Stroke Scale of 8, 6.57 mL of core volume, 94,75 mL of penumbra volume and 15.4 of mismatch ratio. Therefore, this patient satisfied both DEFUSE 3 and DAWN criteria. Panel A: Color coded time to the peak of the residual function (Tmax) maps indicate total critically hypoperfused tissue; Panel B: Color coded CBF maps show infarct core; Panel C: penumbral maps illustrate infarcted tissue (red) and ischemic penumbra (blue) resulting from the difference between Tmax and relative CBF lesion sizes.
Fig. 5
Fig. 5
Two illustrative examples of computed tomography perfusion favorable and unfavorable profiles obtained with automatic calculation of target mismatch (Olea Sphere). Panel A: a 68 year-old patient with acute ischemic stroke (AIS) having an ischemic lesion in the right middle cerebral artery (MCA) territory. The patient was admitted at 10 h from onset with National Institute of Health Stroke Scale of 20, 37.95 mL of core volume, 192.68 mL of penumbra volume and 5.1 of mismatch ratio. Therefore, this patient satisfied both DEFUSE 3 and DAWN criteria representing a typical DEFUSE 3/DAWN patient. Panel B: a 75 year-old patient with acute ischemic stroke (AIS) having an ischemic lesion in the right middle cerebral artery (MCA) territory. The patient was admitted at 15 h after onset with National Institute of Health Stroke Scale of 22, 82.30 mL of core volume, 9.81 mL of penumbra volume and 1.12 of mismatch ratio. Therefore, this patient did not satisfy both DEFUSE 3 and DAWN criteria representing a typical non-DEFUSE 3/non-DAWN patient.
Fig. 6
Fig. 6
An illustrative case of computed tomography perfusion (CTP) scotoma obtained with automatic calculation of target mismatch (Olea Sphere). A 59 year-old patient with acute ischemic stroke (AIS) having an ischemic lesion in the left middle cerebral artery (MCA) territory due to the occlusion of M2 segment admitted at 6 h after onset. A visible hypodensity on non-contrast computed tomography (NCCT) in ASPECTS regions I, M2, M3 M5 and M6 resulting in ASPECTS = 5 (Panel A), without detection of infarct core on CTP (Panel B), and with good collaterals on multiphase computed tomography angiography (Panel C). Follow-up NCCT performed at 24 h indicates a final infarct volume overlapping the hypoattenuated NCCT lesion observed at admission with hemorrhagic transformation (Panel D).
Fig. 7
Fig. 7
An illustrative case of computed tomography perfusion (CTP) ghost infarct obtained with automatic calculation of target mismatch (Olea Sphere). A 63 year-old patient with acute ischemic stroke (AIS) having an ischemic lesion in the right middle cerebral artery (MCA) territory due to the occlusion of M1 segment admitted at 1.5 h after onset. The absence of hypodense lesion on non-contrast computed tomography (NCCT) with ASPECTS = 10 (Panel A), in presence of infarct core on CTP (Panel B), and with poor collaterals on multiphase computed tomography angiography (Panel C). Follow-up NCCT performed at 24 h did not indicate any final infarct volume (Panel D).
Fig. 8
Fig. 8
The computed tomography perfusion (CTP) Tmax-Tmax mismatch in a 58 year-old patient with acute ischemic stroke (AIS) and ischemic lesion in the right middle cerebral artery (MCA) territory. Panel A: Color coded Tmax map with threshold value > 9.5 s indicates total critically hypoperfused tissue; Panel B: Color coded Tmax map with threshold value > 916 s shows infarct core; Panel C: Tmax > 9.5 s volume automatically segmented on CTP averaged images. Panel D: Tmax > 16 s volume automatically segmented on CTP averaged images. The difference between Tmax > 9.5 s and Tmax > 16 s volumes represents Tmax-Tmax mismatch. Tmax = time to the peak of the residual function.

Similar articles

Cited by

References

    1. Campbell B.C.V., Khatri P. Stroke. Lancet. 2020;396:129–142. - PubMed
    1. Powers W.J. Acute ischemic stroke. N. Engl. J. Med. 2020;383:252–260. - PubMed
    1. Ermine C.M., Bivard A., Parsons M.W., Baron J.C. The ischemic penumbra: from concept to reality. Int. J. Stroke. 2021;16:497–509. - PubMed
    1. Baron J.C. Protecting the ischaemic penumbra as an adjunct to thrombectomy for acute stroke. Nat. Rev. Neurol. 2018;14:325–337. - PubMed
    1. Heiss W.-D., Zaro-Weber O. Extension of therapeutic window in ischemic stroke by selective mismatch imaging. Int. J. Stroke. 2019;14:351–358. - PubMed

LinkOut - more resources